| Param | Original file | Final file |
|---|---|---|
| Filename | modeM0/AS1A13_012T01_9000005942cztM0_level2.fits | modeM0/AS1A13_012T01_9000005942cztM0_level2_quad_clean.evt |
| Size (bytes) | 394,416,000 | 414,815,040 |
| Size | 376.1 MB | 395.6 MB |
| Events in quadrant A | 2,238,812 | 2,374,230 |
| Events in quadrant B | 2,303,862 | 2,565,437 |
| Events in quadrant C | 2,361,786 | 2,409,785 |
| Events in quadrant D | 1,960,066 | 2,136,573 |
| Mode M9 | |||
|---|---|---|---|
| Quadrant | BADHDUFLAG | Total packets | Discarded packets |
| A | 0 | 22 | 0 |
| B | 0 | 23 | 0 |
| C | 0 | 23 | 0 |
| D | 0 | 23 | 0 |
| Mode M0 | |||
|---|---|---|---|
| Quadrant | BADHDUFLAG | Total packets | Discarded packets |
| A | 0 | 129597 | 0 |
| B | 0 | 92505 | 0 |
| C | 0 | 94268 | 0 |
| D | 0 | 135941 | 0 |
| Mode SS | |||
|---|---|---|---|
| Quadrant | BADHDUFLAG | Total packets | Discarded packets |
| A | 0 | 908 | 0 |
| B | 0 | 908 | 0 |
| C | 0 | 908 | 0 |
| D | 0 | 908 | 0 |
| Quadrant | Total seconds | Saturated seconds | Saturation percentage |
|---|---|---|---|
| A | 44812 | 3753 | 8.374989% |
| B | 44811 | 898 | 2.003972% |
| C | 44808 | 730 | 1.629173% |
| D | 44804 | 3688 | 8.231408% |
Noise dominated data is calculated using 1-second bins in cleaned event files. If a bin has >2000 counts, and if more than 50% of those come from <1% of pixels, then it is considered to be noise-dominated and hence unusable.
| Quadrant | # 1 sec bins | Bins with >0 counts | Bins with >2000 counts | High rate bins dominated by noise | Noise dominated (total time) | Noise dominated (detector-on time) | Marked lightcurve |
|---|---|---|---|---|---|---|---|
| A | 51779 | 44519 | 0 | 0 | 0.00% | 0.00% | 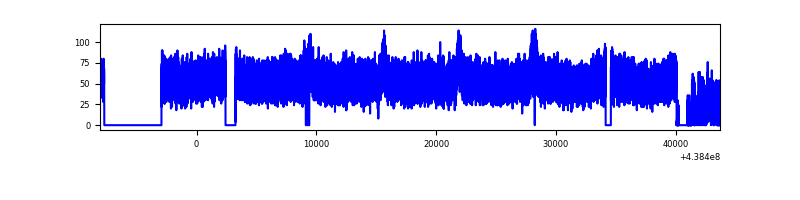 |
| B | 51780 | 44812 | 0 | 0 | 0.00% | 0.00% | 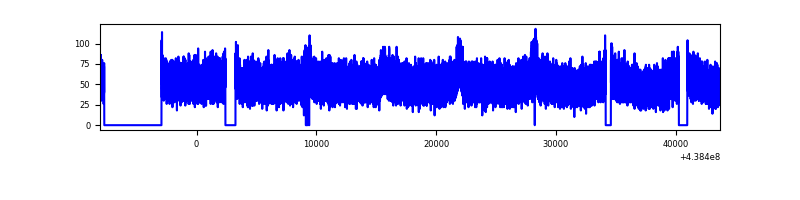 |
| C | 51780 | 44811 | 0 | 0 | 0.00% | 0.00% | 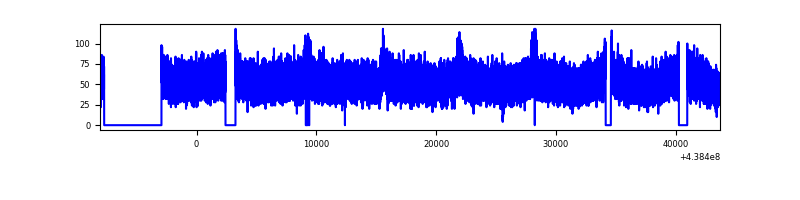 |
| D | 51780 | 44758 | 0 | 0 | 0.00% | 0.00% | 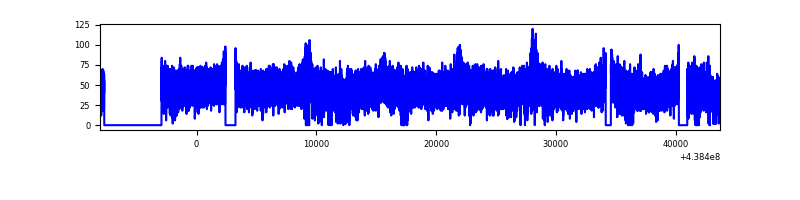 |
Top three noisy pixels from each quadrant. If the there are fewer than three noisy pixels in the level2.evt file, extra rows are filled as -1
| Pixel properties | Quadrant properties | ||||||
|---|---|---|---|---|---|---|---|
| Quadrant | DetID | PixID | Counts | Sigma | Mean | Median | Sigma |
| A | 7 | 110 | 1830 | 8.69 | 582 | 543 | 148.1 |
| A | 15 | 236 | 1799 | 8.48 | 582 | 543 | 148.1 |
| A | 0 | 29 | 1767 | 8.27 | 582 | 543 | 148.1 |
| B | 2 | 9 | 2082 | 12.13 | 606 | 574 | 124.4 |
| B | 3 | 17 | 1652 | 8.67 | 606 | 574 | 124.4 |
| B | 2 | 8 | 1637 | 8.55 | 606 | 574 | 124.4 |
| C | 1 | 81 | 1791 | 7.44 | 624 | 576 | 163.4 |
| C | 1 | 80 | 1777 | 7.35 | 624 | 576 | 163.4 |
| C | 3 | 202 | 1774 | 7.33 | 624 | 576 | 163.4 |
| D | 3 | 14 | 1470 | 6.15 | 561 | 509 | 156.3 |
| D | 10 | 189 | 1392 | 5.65 | 561 | 509 | 156.3 |
| D | 15 | 46 | 1386 | 5.61 | 561 | 509 | 156.3 |
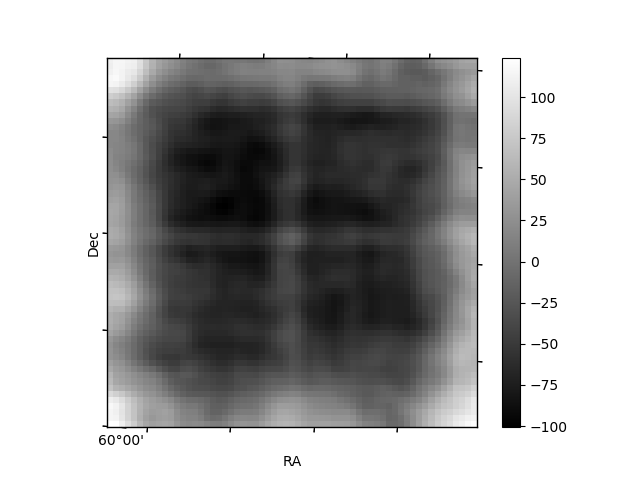
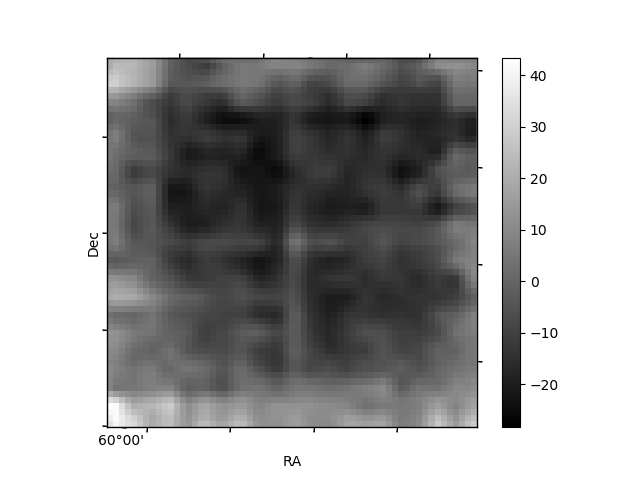
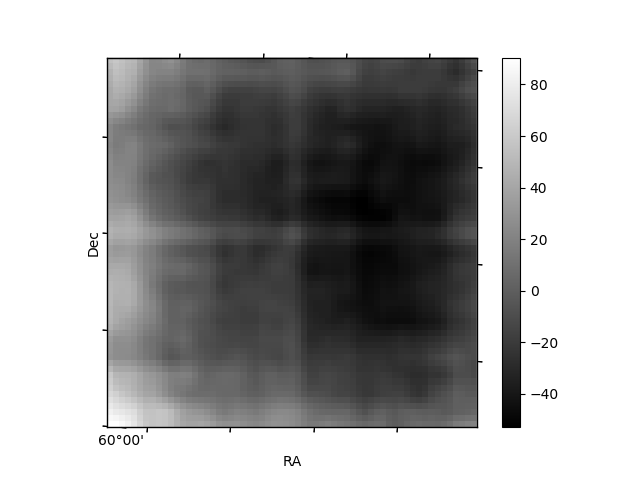
Histogram calculated using DETX and DETY for each event in the final _common_clean file
| Quadrant A | 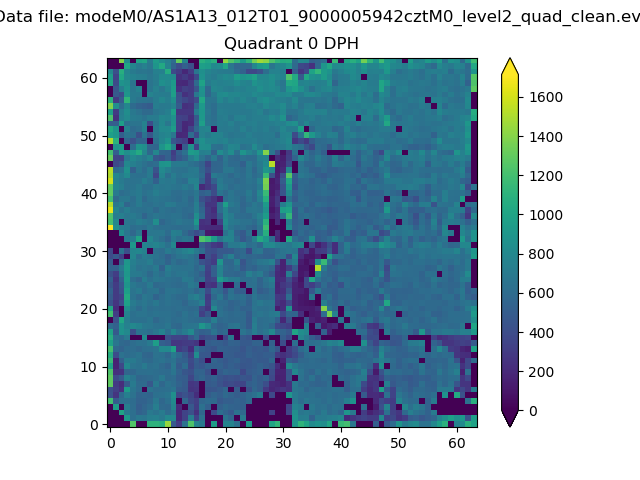 |
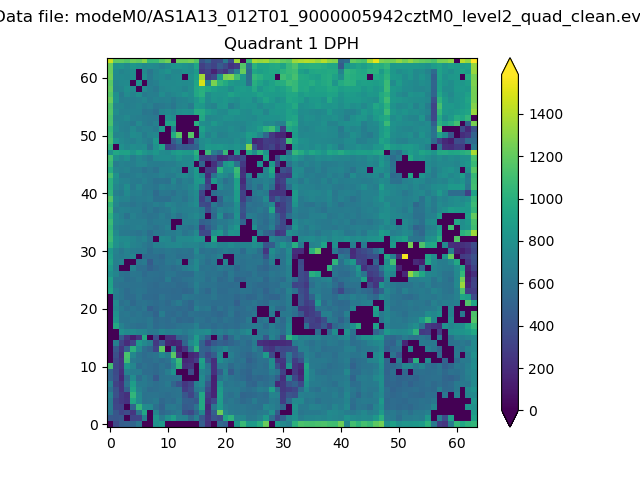 |
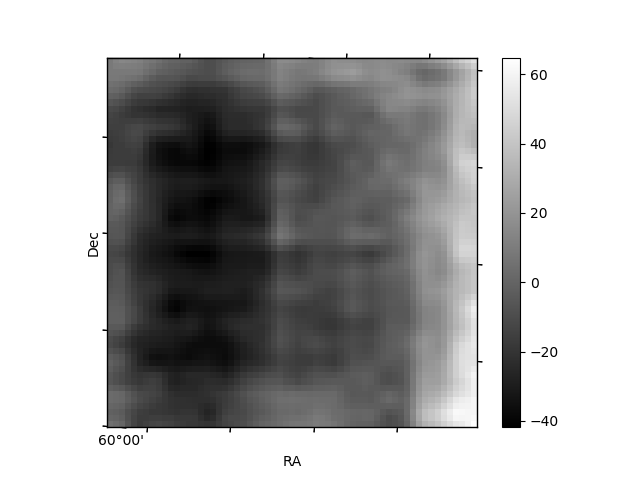
Quadrant B |
|---|---|---|---|
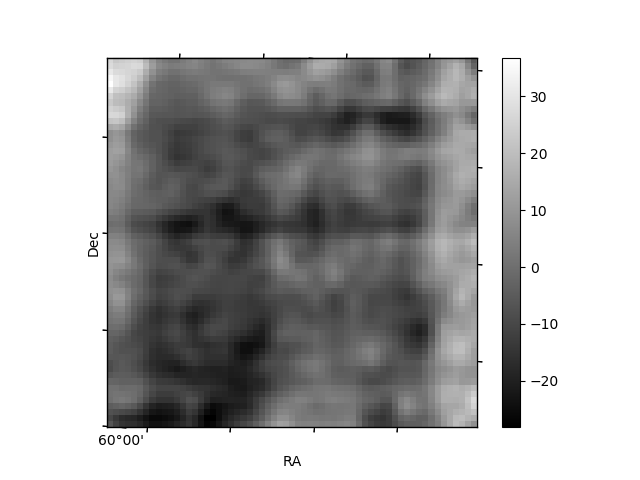
| Quadrant D | 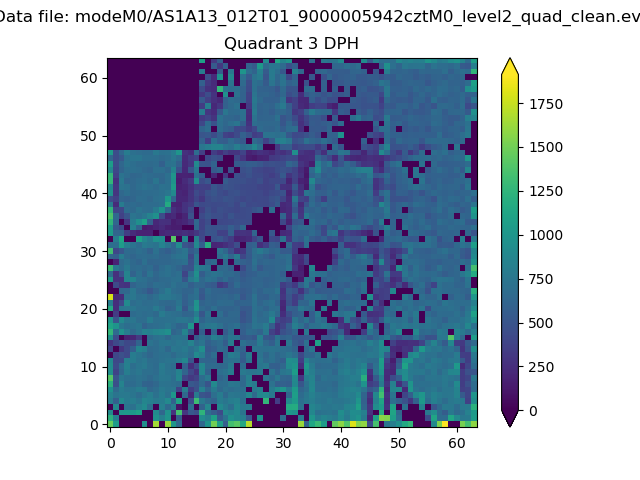 |
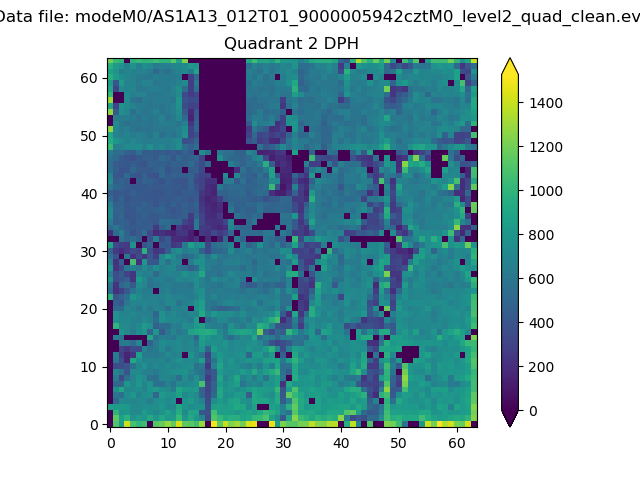 |
Quadrant C |
| Plot type | Count rate plots | Images |
|---|---|---|
| Comparison with Poisson distribution Blue bars denote a histogram of data divided into 1 sec bins. Red curve is a Poisson curve with rate = median count rate of data. |
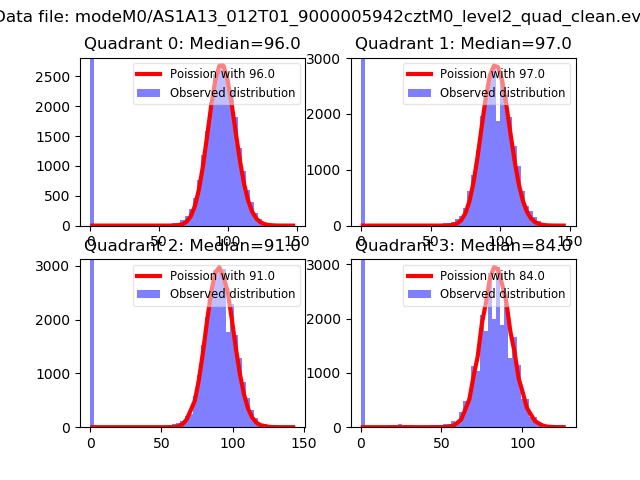 |
 |
| Quadrant-wise count rates Data is divided into 100 sec bins |
 |
|
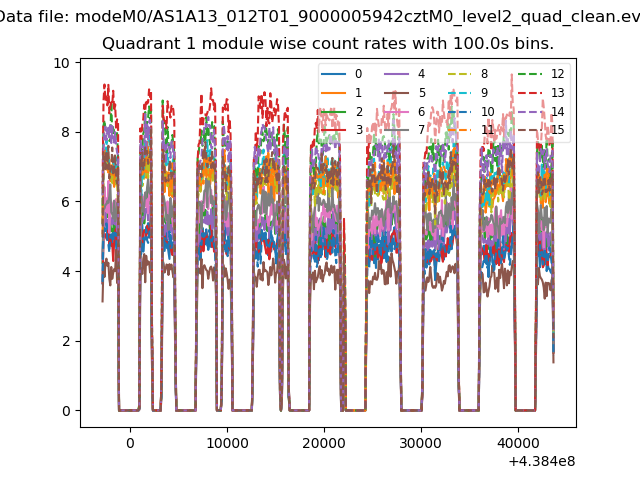
| Module-wise count rates for Quadrant A Data is divided into 100 sec bins |
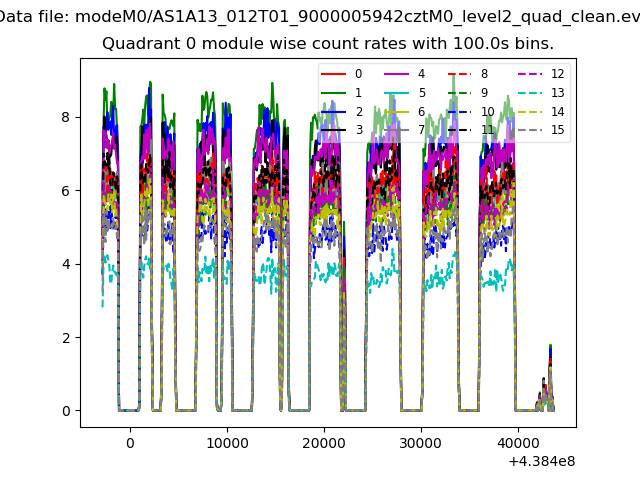 |
 |
| Module-wise count rates for Quadrant B Data is divided into 100 sec bins |
 |
 |
| Module-wise count rates for Quadrant C Data is divided into 100 sec bins |
 |
 |
| Module-wise count rates for Quadrant D Data is divided into 100 sec bins |
 |
 |
| Parameter | Plot |
|---|---|
| CZT HV Monitor | 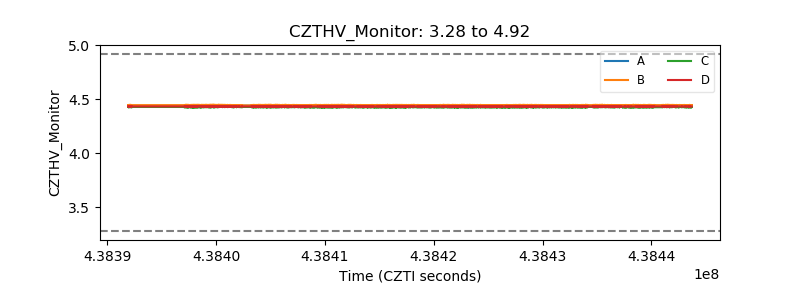 |
| D_VDD | 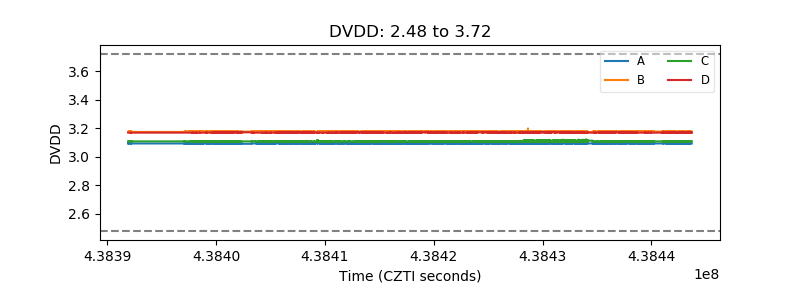 |
| Temperature 1 | 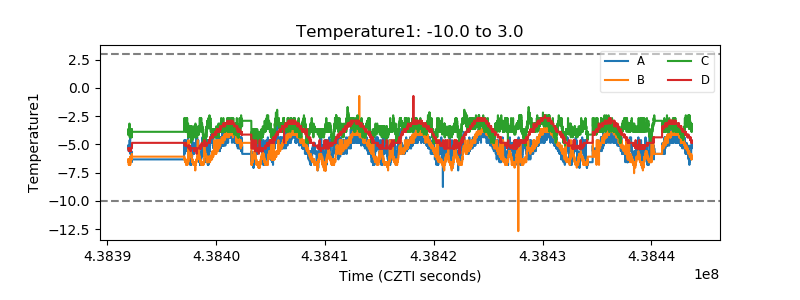 |
| Veto HV Monitor |  |
| Veto LLD | 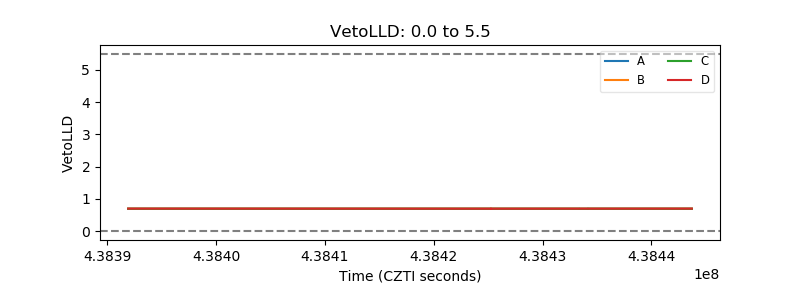 |
| Alpha Counter | 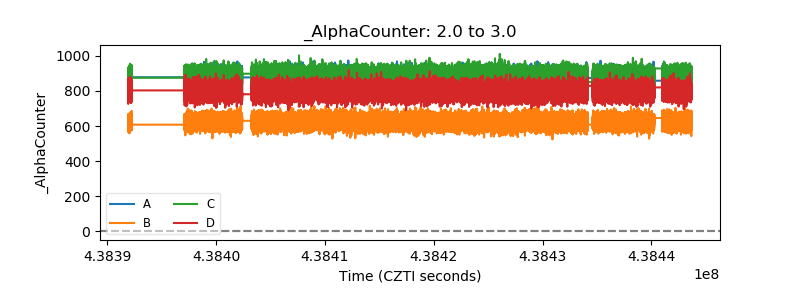 |
| _CPM_Rate | 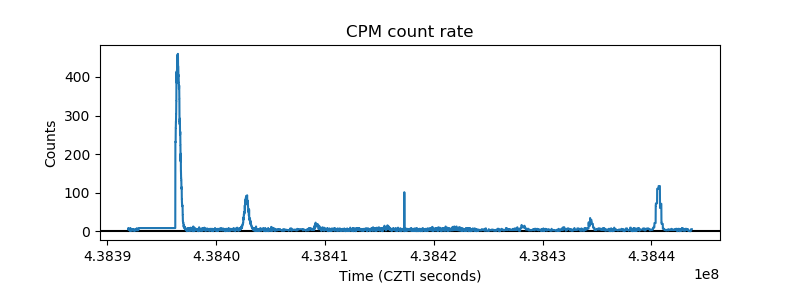 |
| CZT Counter |  |
| +2.5 Volts monitor | 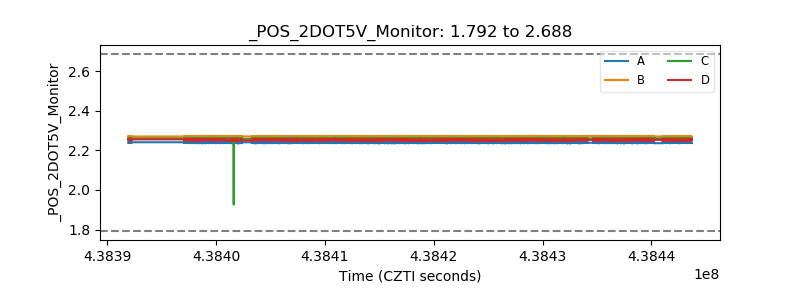 |
| +5 Volts monitor | 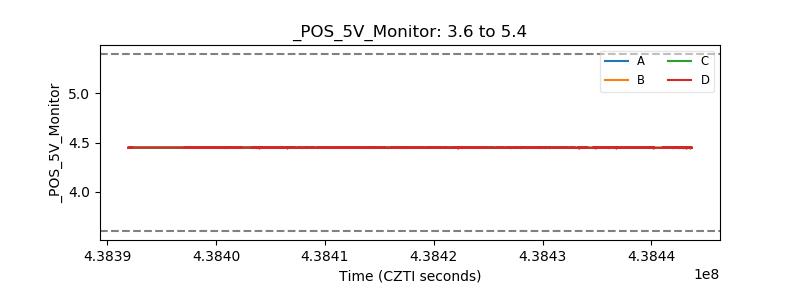 |
| _ROLL_ROT | 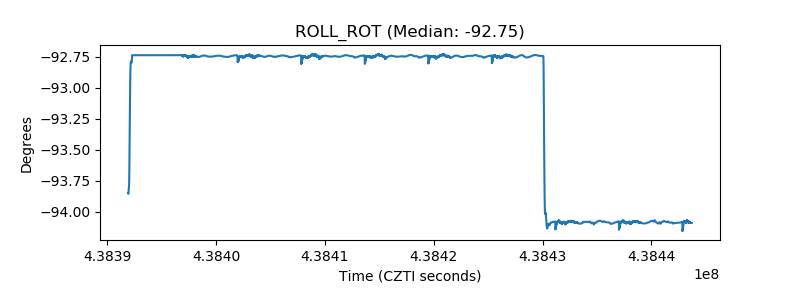 |
| _Roll_DEC | 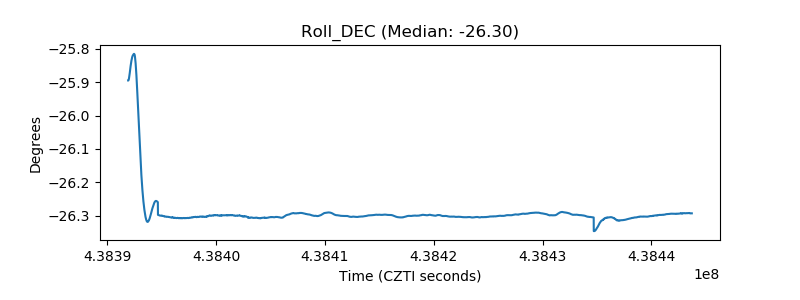 |
| _Roll_RA | 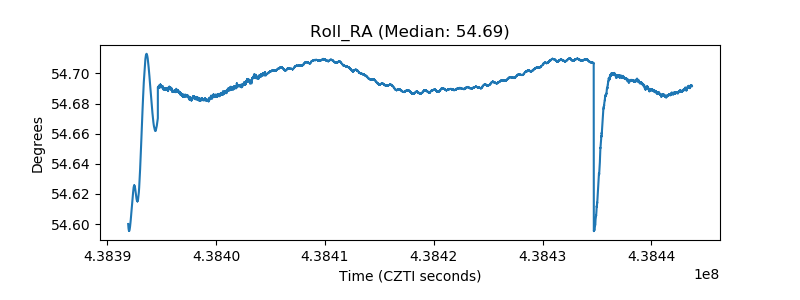 |
| Veto Counter | 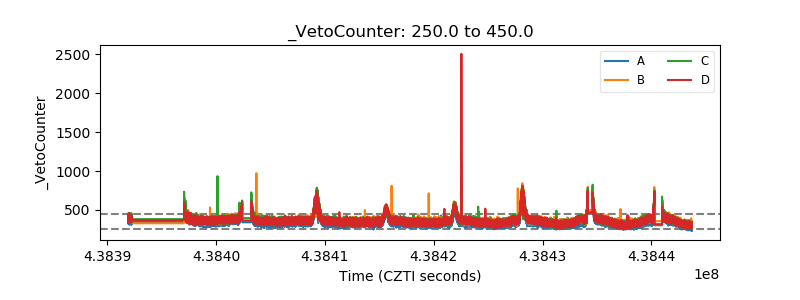 |