| Param | Original file | Final file |
|---|---|---|
| Filename | modeM0/AS1A13_080T05_9000005952cztM0_level2.fits | modeM0/AS1A13_080T05_9000005952cztM0_level2_quad_clean.evt |
| Size (bytes) | 243,506,880 | 301,069,440 |
| Size | 232.2 MB | 287.1 MB |
| Events in quadrant A | 1,428,918 | 1,877,493 |
| Events in quadrant B | 1,391,516 | 1,912,878 |
| Events in quadrant C | 1,399,814 | 1,777,668 |
| Events in quadrant D | 1,207,056 | 1,605,449 |
| Mode M9 | |||
|---|---|---|---|
| Quadrant | BADHDUFLAG | Total packets | Discarded packets |
| A | 0 | 50 | 0 |
| B | 0 | 50 | 0 |
| C | 0 | 50 | 0 |
| D | 0 | 50 | 0 |
| Mode SS | |||
|---|---|---|---|
| Quadrant | BADHDUFLAG | Total packets | Discarded packets |
| A | 0 | 576 | 0 |
| B | 0 | 576 | 0 |
| C | 0 | 576 | 0 |
| D | 0 | 576 | 0 |
| Mode M0 | |||
|---|---|---|---|
| Quadrant | BADHDUFLAG | Total packets | Discarded packets |
| A | 0 | 91746 | 0 |
| B | 0 | 73617 | 0 |
| C | 0 | 72017 | 0 |
| D | 0 | 85654 | 0 |
| Quadrant | Total seconds | Saturated seconds | Saturation percentage |
|---|---|---|---|
| A | 28280 | 2099 | 7.422207% |
| B | 28280 | 1178 | 4.165488% |
| C | 28280 | 1882 | 6.654880% |
| D | 28280 | 1835 | 6.488685% |
Noise dominated data is calculated using 1-second bins in cleaned event files. If a bin has >2000 counts, and if more than 50% of those come from <1% of pixels, then it is considered to be noise-dominated and hence unusable.
| Quadrant | # 1 sec bins | Bins with >0 counts | Bins with >2000 counts | High rate bins dominated by noise | Noise dominated (total time) | Noise dominated (detector-on time) | Marked lightcurve |
|---|---|---|---|---|---|---|---|
| A | 33260 | 28276 | 0 | 0 | 0.00% | 0.00% |  |
| B | 33260 | 28276 | 0 | 0 | 0.00% | 0.00% |  |
| C | 33260 | 27951 | 0 | 0 | 0.00% | 0.00% |  |
| D | 33260 | 28268 | 0 | 0 | 0.00% | 0.00% |  |
Top three noisy pixels from each quadrant. If the there are fewer than three noisy pixels in the level2.evt file, extra rows are filled as -1
| Pixel properties | Quadrant properties | ||||||
|---|---|---|---|---|---|---|---|
| Quadrant | DetID | PixID | Counts | Sigma | Mean | Median | Sigma |
| A | 0 | 29 | 1252 | 9.46 | 373 | 351 | 95.3 |
| A | 7 | 110 | 1172 | 8.62 | 373 | 351 | 95.3 |
| A | 0 | 30 | 1147 | 8.35 | 373 | 351 | 95.3 |
| B | 2 | 9 | 1268 | 11.93 | 372 | 355 | 76.5 |
| B | 3 | 17 | 1025 | 8.75 | 372 | 355 | 76.5 |
| B | 2 | 8 | 963 | 7.94 | 372 | 355 | 76.5 |
| C | 1 | 81 | 1116 | 8.03 | 370 | 346 | 95.8 |
| C | 3 | 202 | 1112 | 7.99 | 370 | 346 | 95.8 |
| C | 3 | 203 | 1092 | 7.78 | 370 | 346 | 95.8 |
| D | 6 | 38 | 919 | 6.09 | 348 | 316 | 99.0 |
| D | 10 | 189 | 915 | 6.05 | 348 | 316 | 99.0 |
| D | 6 | 79 | 901 | 5.91 | 348 | 316 | 99.0 |
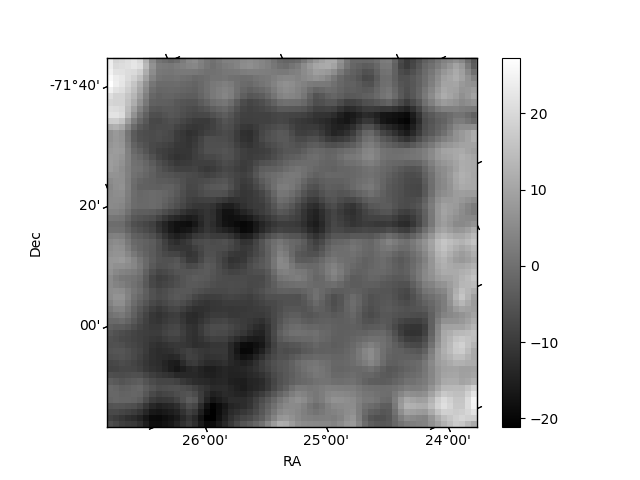
Histogram calculated using DETX and DETY for each event in the final _common_clean file
| Quadrant A | 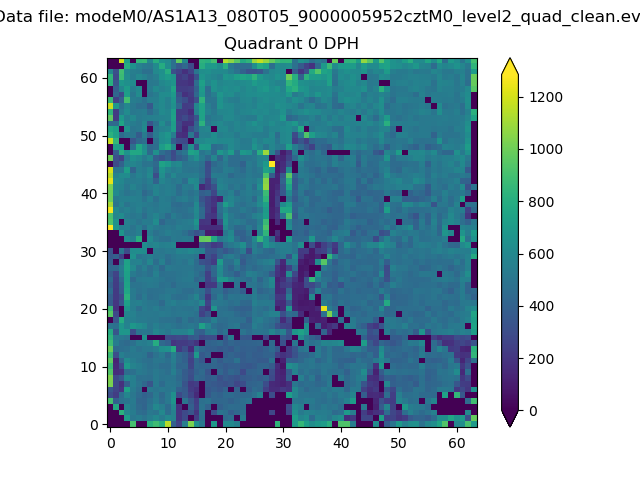 |
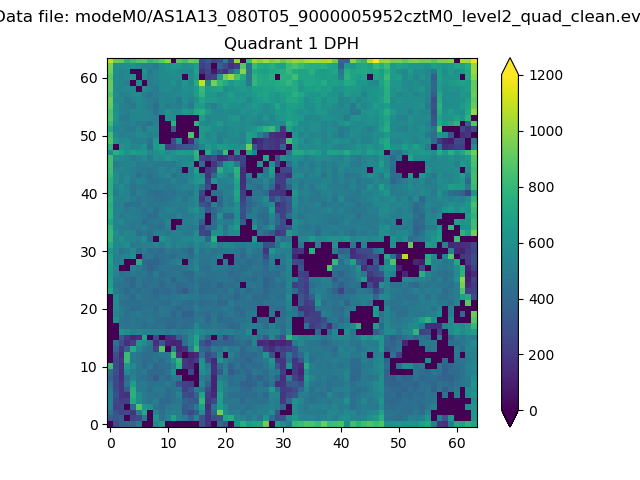 |
Quadrant B |
|---|---|---|---|
| Quadrant D |  |
 |
Quadrant C |
| Plot type | Count rate plots | Images |
|---|---|---|
| Comparison with Poisson distribution Blue bars denote a histogram of data divided into 1 sec bins. Red curve is a Poisson curve with rate = median count rate of data. |
 |
 |
| Quadrant-wise count rates Data is divided into 100 sec bins |
 |
|
| Module-wise count rates for Quadrant A Data is divided into 100 sec bins |
 |
 |
| Module-wise count rates for Quadrant B Data is divided into 100 sec bins |
 |
 |
| Module-wise count rates for Quadrant C Data is divided into 100 sec bins |
 |
 |
| Module-wise count rates for Quadrant D Data is divided into 100 sec bins |
 |
 |
| Parameter | Plot |
|---|---|
| CZT HV Monitor |  |
| D_VDD | 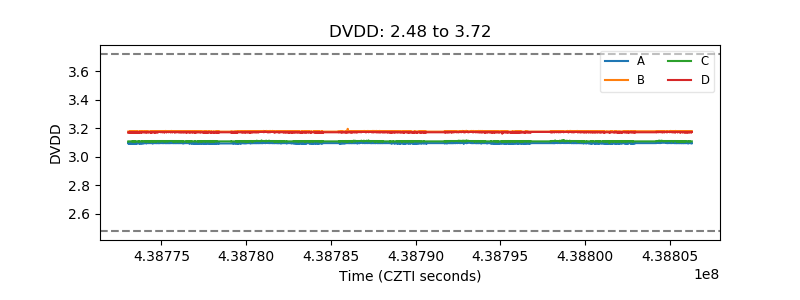 |
| Temperature 1 |  |
| Veto HV Monitor |  |
| Veto LLD |  |
| Alpha Counter |  |
| _CPM_Rate |  |
| CZT Counter |  |
| +2.5 Volts monitor | 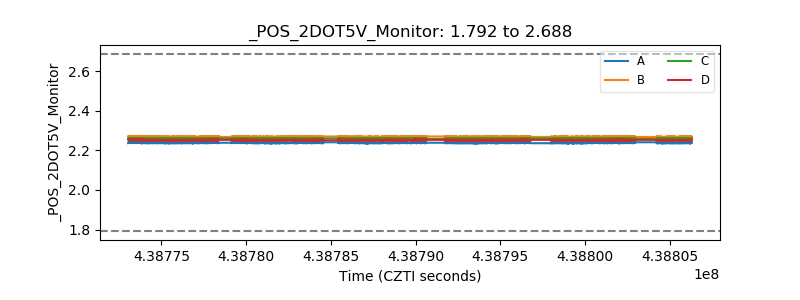 |
| +5 Volts monitor |  |
| _ROLL_ROT |  |
| _Roll_DEC |  |
| _Roll_RA |  |
| Veto Counter |  |