| Param | Original file | Final file |
|---|---|---|
| Filename | modeM0/AS1A13_080T06_9000005954cztM0_level2.fits | modeM0/AS1A13_080T06_9000005954cztM0_level2_quad_clean.evt |
| Size (bytes) | 360,685,440 | 524,404,800 |
| Size | 344.0 MB | 500.1 MB |
| Events in quadrant A | 2,061,306 | 3,251,963 |
| Events in quadrant B | 2,036,422 | 3,447,122 |
| Events in quadrant C | 2,119,588 | 3,314,382 |
| Events in quadrant D | 1,793,820 | 2,962,411 |
| Mode SS | |||
|---|---|---|---|
| Quadrant | BADHDUFLAG | Total packets | Discarded packets |
| A | 0 | 856 | 0 |
| B | 0 | 856 | 0 |
| C | 0 | 856 | 0 |
| D | 0 | 856 | 0 |
| Mode M0 | |||
|---|---|---|---|
| Quadrant | BADHDUFLAG | Total packets | Discarded packets |
| A | 0 | 156892 | 0 |
| B | 0 | 123630 | 0 |
| C | 0 | 99960 | 0 |
| D | 0 | 125875 | 0 |
| Mode M9 | |||
|---|---|---|---|
| Quadrant | BADHDUFLAG | Total packets | Discarded packets |
| A | 0 | 44 | 0 |
| B | 0 | 44 | 0 |
| C | 0 | 44 | 0 |
| D | 0 | 44 | 0 |
| Quadrant | Total seconds | Saturated seconds | Saturation percentage |
|---|---|---|---|
| A | 42337 | 4973 | 11.746227% |
| B | 42338 | 3325 | 7.853465% |
| C | 42338 | 2030 | 4.794747% |
| D | 42337 | 2608 | 6.160096% |
Noise dominated data is calculated using 1-second bins in cleaned event files. If a bin has >2000 counts, and if more than 50% of those come from <1% of pixels, then it is considered to be noise-dominated and hence unusable.
| Quadrant | # 1 sec bins | Bins with >0 counts | Bins with >2000 counts | High rate bins dominated by noise | Noise dominated (total time) | Noise dominated (detector-on time) | Marked lightcurve |
|---|---|---|---|---|---|---|---|
| A | 51996 | 42268 | 0 | 0 | 0.00% | 0.00% | 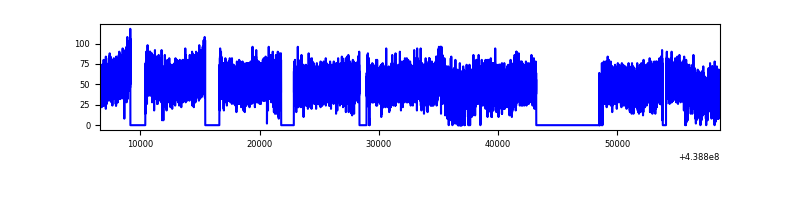 |
| B | 51996 | 42290 | 0 | 0 | 0.00% | 0.00% | 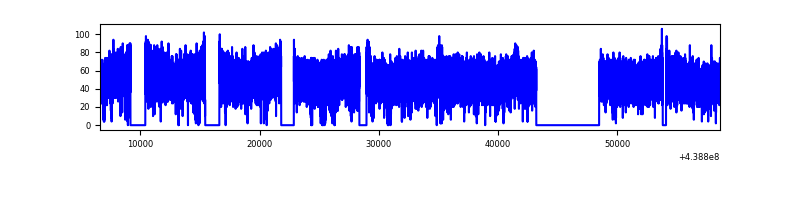 |
| C | 51996 | 42279 | 0 | 0 | 0.00% | 0.00% |  |
| D | 51995 | 42318 | 0 | 0 | 0.00% | 0.00% | 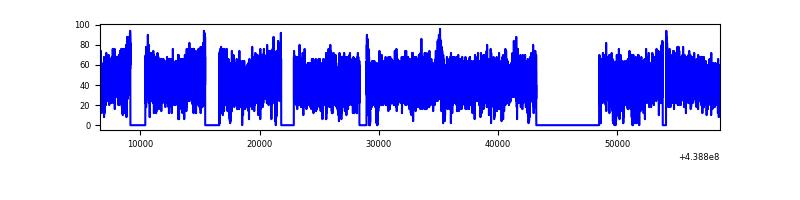 |
Top three noisy pixels from each quadrant. If the there are fewer than three noisy pixels in the level2.evt file, extra rows are filled as -1
| Pixel properties | Quadrant properties | ||||||
|---|---|---|---|---|---|---|---|
| Quadrant | DetID | PixID | Counts | Sigma | Mean | Median | Sigma |
| A | 7 | 110 | 1767 | 9.14 | 539 | 506 | 138.0 |
| A | 0 | 29 | 1669 | 8.43 | 539 | 506 | 138.0 |
| A | 7 | 109 | 1641 | 8.23 | 539 | 506 | 138.0 |
| B | 2 | 9 | 1877 | 12.62 | 542 | 517 | 107.8 |
| B | 2 | 8 | 1469 | 8.83 | 542 | 517 | 107.8 |
| B | 3 | 17 | 1462 | 8.77 | 542 | 517 | 107.8 |
| C | 1 | 81 | 1602 | 7.44 | 562 | 524 | 145.0 |
| C | 1 | 80 | 1576 | 7.26 | 562 | 524 | 145.0 |
| C | 3 | 158 | 1422 | 6.19 | 562 | 524 | 145.0 |
| D | 6 | 79 | 1331 | 5.93 | 518 | 471 | 145.0 |
| D | 6 | 38 | 1330 | 5.92 | 518 | 471 | 145.0 |
| D | 10 | 113 | 1315 | 5.82 | 518 | 471 | 145.0 |
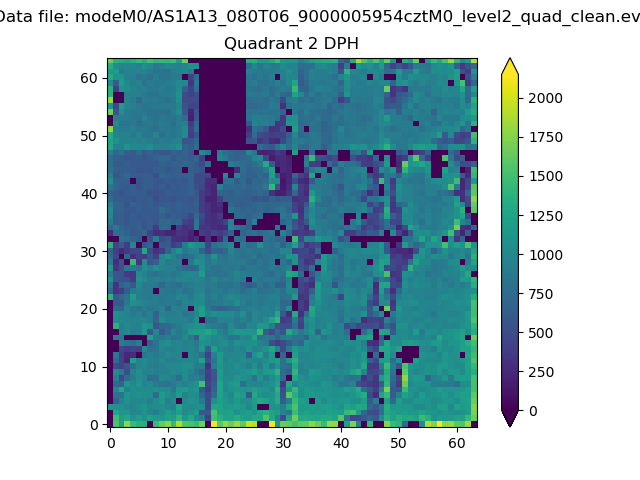
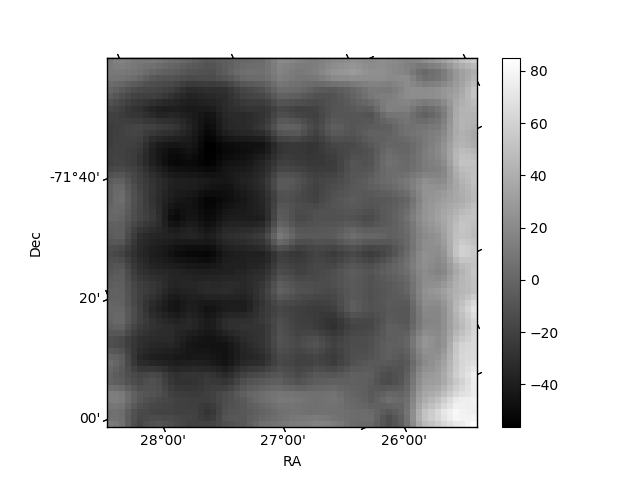
Histogram calculated using DETX and DETY for each event in the final _common_clean file
| Quadrant A |  |
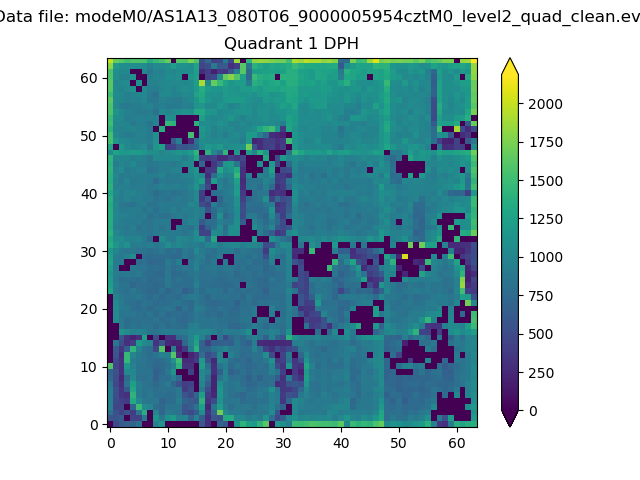 |
Quadrant B |
|---|---|---|---|
| Quadrant D | 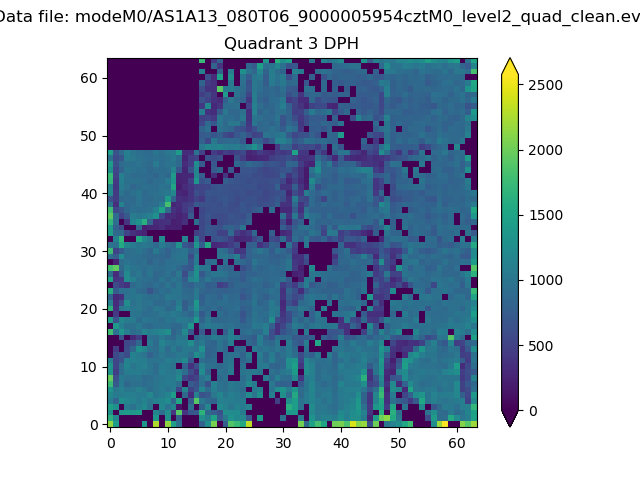 |
 |
Quadrant C |
| Plot type | Count rate plots | Images |
|---|---|---|
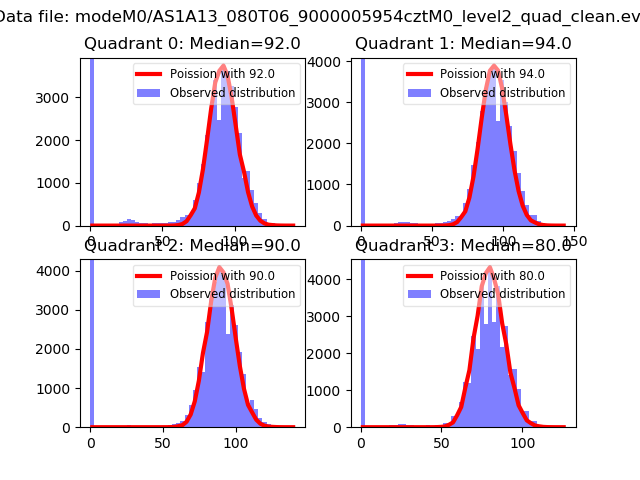
| Comparison with Poisson distribution Blue bars denote a histogram of data divided into 1 sec bins. Red curve is a Poisson curve with rate = median count rate of data. |
 |
 |
| Quadrant-wise count rates Data is divided into 100 sec bins |
 |
|
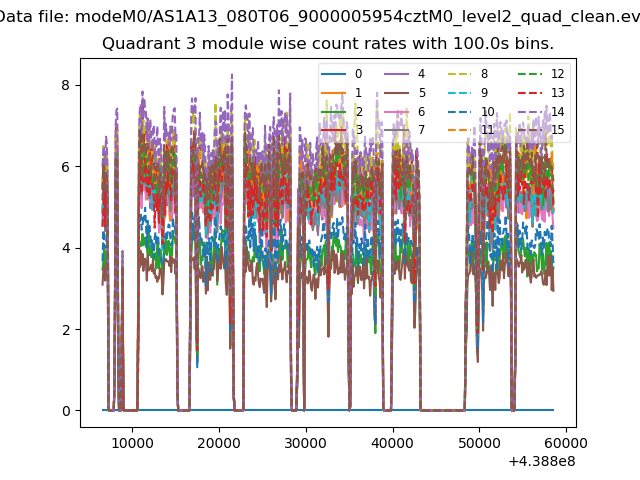
| Module-wise count rates for Quadrant A Data is divided into 100 sec bins |
 |
 |
| Module-wise count rates for Quadrant B Data is divided into 100 sec bins |
 |
 |
| Module-wise count rates for Quadrant C Data is divided into 100 sec bins |
 |
 |
| Module-wise count rates for Quadrant D Data is divided into 100 sec bins |
 |
 |
| Parameter | Plot |
|---|---|
| CZT HV Monitor |  |
| D_VDD | 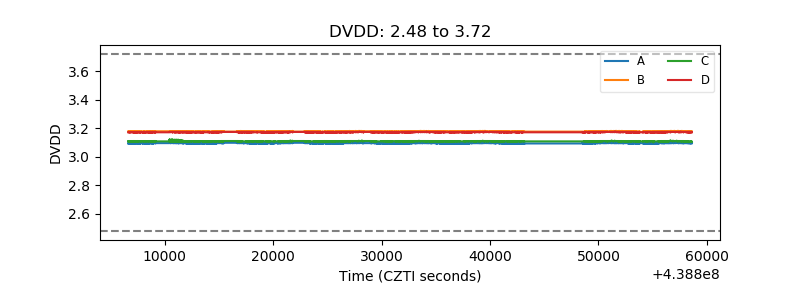 |
| Temperature 1 |  |
| Veto HV Monitor |  |
| Veto LLD |  |
| Alpha Counter |  |
| _CPM_Rate |  |
| CZT Counter |  |
| +2.5 Volts monitor |  |
| +5 Volts monitor |  |
| _ROLL_ROT | 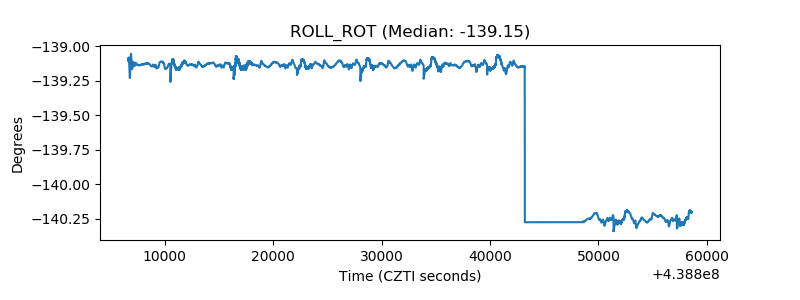 |
| _Roll_DEC | 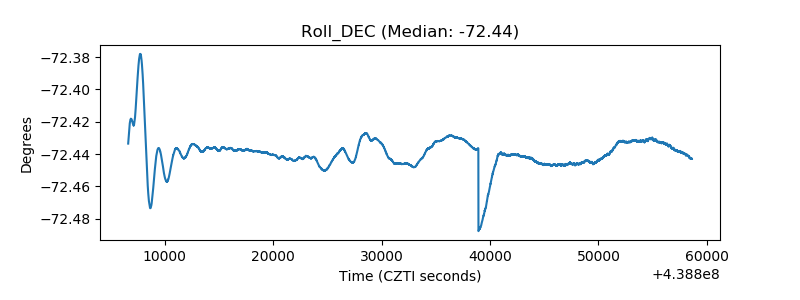 |
| _Roll_RA |  |
| Veto Counter |  |