| Param | Original file | Final file |
|---|---|---|
| Filename | modeM0/AS1A13_079T01_9000005956cztM0_level2.fits | modeM0/AS1A13_079T01_9000005956cztM0_level2_quad_clean.evt |
| Size (bytes) | 563,659,200 | 496,935,360 |
| Size | 537.5 MB | 473.9 MB |
| Events in quadrant A | 3,355,626 | 2,890,856 |
| Events in quadrant B | 3,264,092 | 2,835,057 |
| Events in quadrant C | 3,394,454 | 2,753,929 |
| Events in quadrant D | 2,679,404 | 2,198,005 |
| Mode M9 | |||
|---|---|---|---|
| Quadrant | BADHDUFLAG | Total packets | Discarded packets |
| A | 0 | 96 | 0 |
| B | 0 | 96 | 0 |
| C | 0 | 96 | 0 |
| D | 0 | 96 | 0 |
| Mode M0 | |||
|---|---|---|---|
| Quadrant | BADHDUFLAG | Total packets | Discarded packets |
| A | 0 | 191731 | 0 |
| B | 0 | 153924 | 0 |
| C | 0 | 136768 | 0 |
| D | 0 | 213326 | 0 |
| Mode SS | |||
|---|---|---|---|
| Quadrant | BADHDUFLAG | Total packets | Discarded packets |
| A | 0 | 1300 | 0 |
| B | 0 | 1298 | 0 |
| C | 0 | 1301 | 0 |
| D | 0 | 1294 | 0 |
| Quadrant | Total seconds | Saturated seconds | Saturation percentage |
|---|---|---|---|
| A | 63664 | 3312 | 5.202312% |
| B | 63737 | 3113 | 4.884133% |
| C | 63773 | 889 | 1.394007% |
| D | 63673 | 7971 | 12.518650% |
Noise dominated data is calculated using 1-second bins in cleaned event files. If a bin has >2000 counts, and if more than 50% of those come from <1% of pixels, then it is considered to be noise-dominated and hence unusable.
| Quadrant | # 1 sec bins | Bins with >0 counts | Bins with >2000 counts | High rate bins dominated by noise | Noise dominated (total time) | Noise dominated (detector-on time) | Marked lightcurve |
|---|---|---|---|---|---|---|---|
| A | 82497 | 63849 | 0 | 0 | 0.00% | 0.00% | 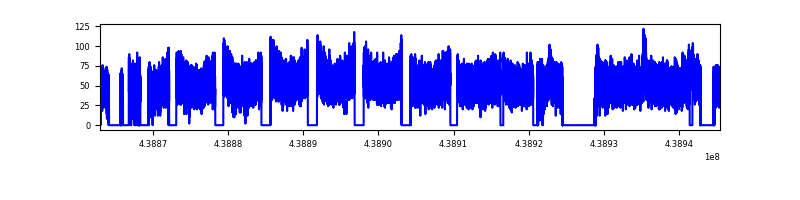 |
| B | 82488 | 63879 | 0 | 0 | 0.00% | 0.00% | 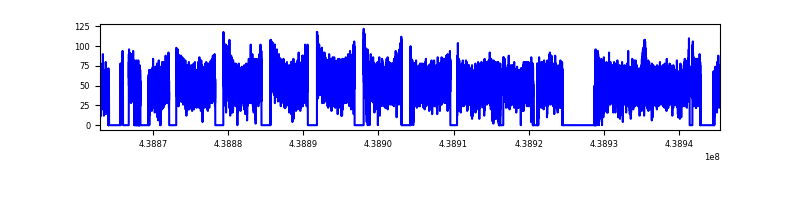 |
| C | 82495 | 63946 | 0 | 0 | 0.00% | 0.00% |  |
| D | 82496 | 63359 | 0 | 0 | 0.00% | 0.00% |  |
Top three noisy pixels from each quadrant. If the there are fewer than three noisy pixels in the level2.evt file, extra rows are filled as -1
| Pixel properties | Quadrant properties | ||||||
|---|---|---|---|---|---|---|---|
| Quadrant | DetID | PixID | Counts | Sigma | Mean | Median | Sigma |
| A | 7 | 110 | 2808 | 8.93 | 874 | 816 | 222.9 |
| A | 0 | 29 | 2654 | 8.24 | 874 | 816 | 222.9 |
| A | 15 | 236 | 2623 | 8.11 | 874 | 816 | 222.9 |
| B | 2 | 9 | 2958 | 12.4 | 863 | 820 | 172.5 |
| B | 3 | 17 | 2409 | 9.21 | 863 | 820 | 172.5 |
| B | 2 | 8 | 2278 | 8.45 | 863 | 820 | 172.5 |
| C | 3 | 202 | 2685 | 8.01 | 898 | 835 | 231.0 |
| C | 3 | 203 | 2587 | 7.58 | 898 | 835 | 231.0 |
| C | 1 | 81 | 2584 | 7.57 | 898 | 835 | 231.0 |
| D | 10 | 189 | 2010 | 6.15 | 772 | 704 | 212.4 |
| D | 6 | 79 | 1933 | 5.79 | 772 | 704 | 212.4 |
| D | 4 | 16 | 1910 | 5.68 | 772 | 704 | 212.4 |
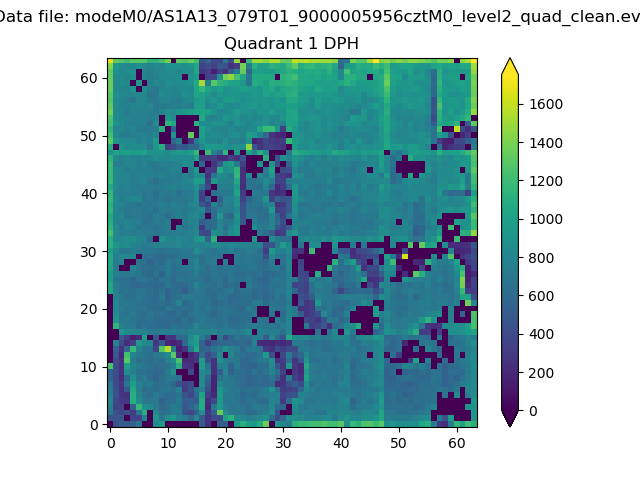
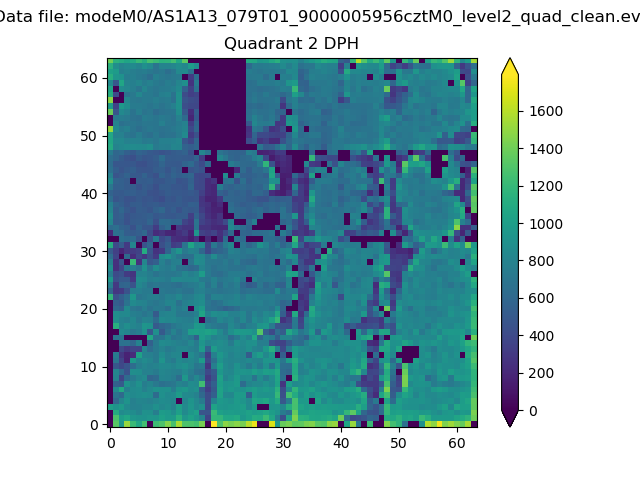
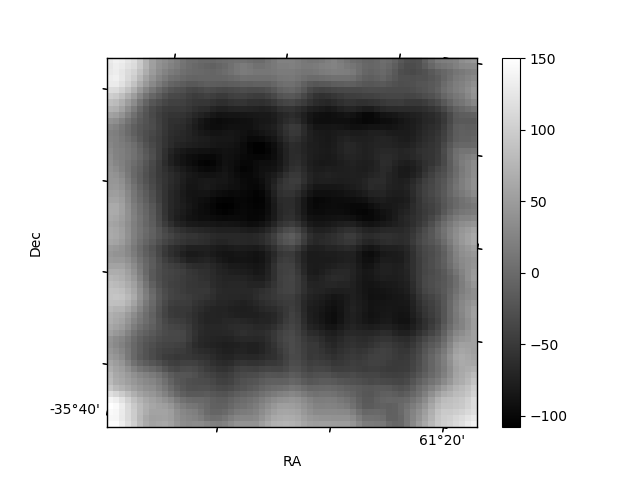
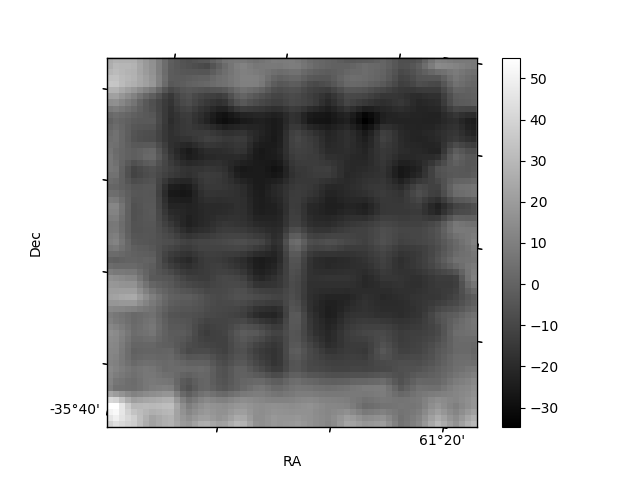
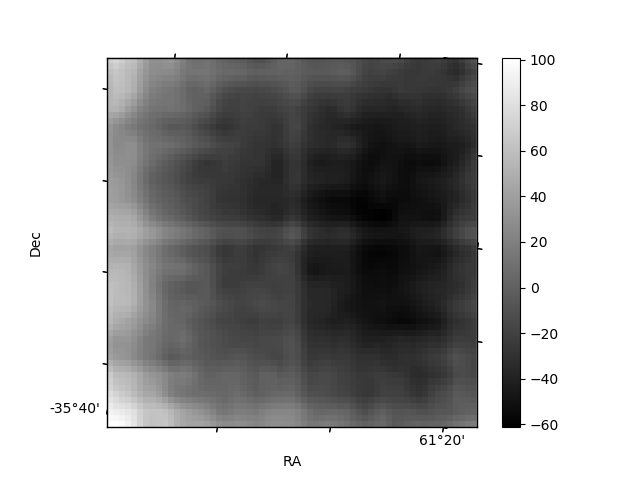
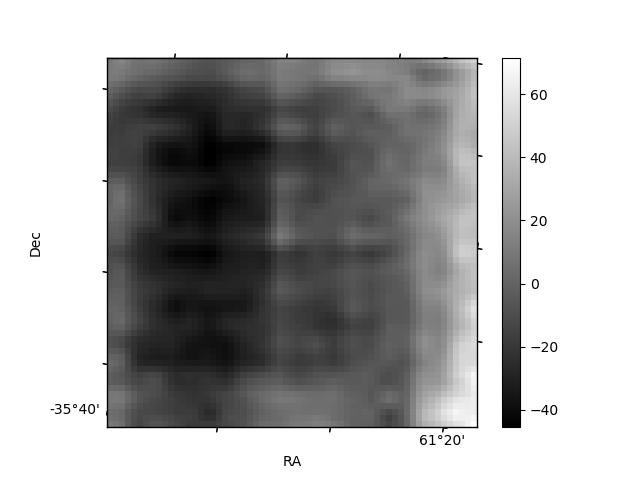
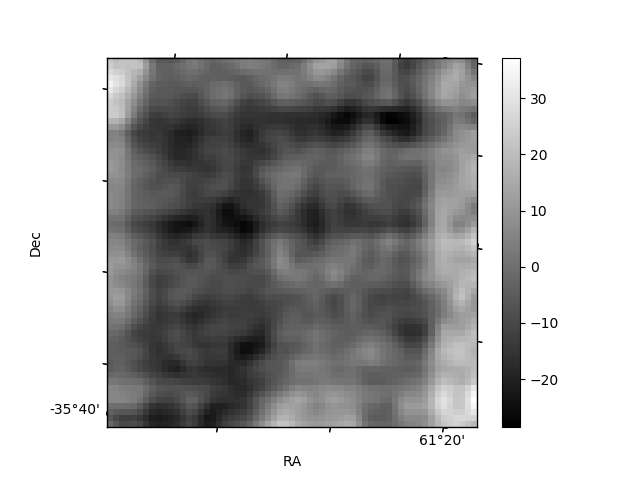
Histogram calculated using DETX and DETY for each event in the final _common_clean file
| Quadrant A |  |
 |
Quadrant B |
|---|---|---|---|
| Quadrant D | 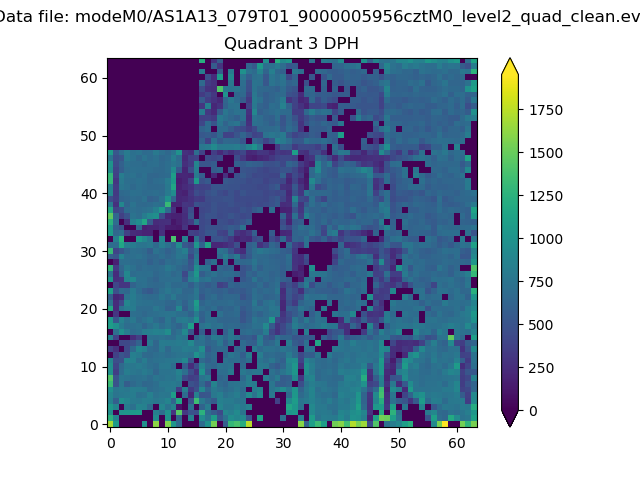 |
 |
Quadrant C |
| Plot type | Count rate plots | Images |
|---|---|---|
| Comparison with Poisson distribution Blue bars denote a histogram of data divided into 1 sec bins. Red curve is a Poisson curve with rate = median count rate of data. |
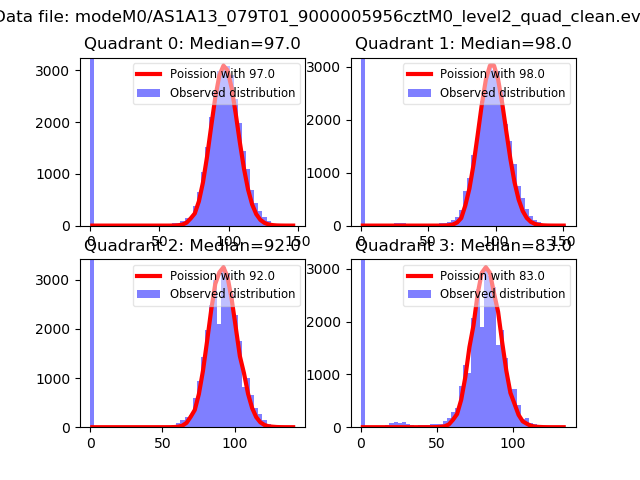 |
 |
| Quadrant-wise count rates Data is divided into 100 sec bins |
 |
|
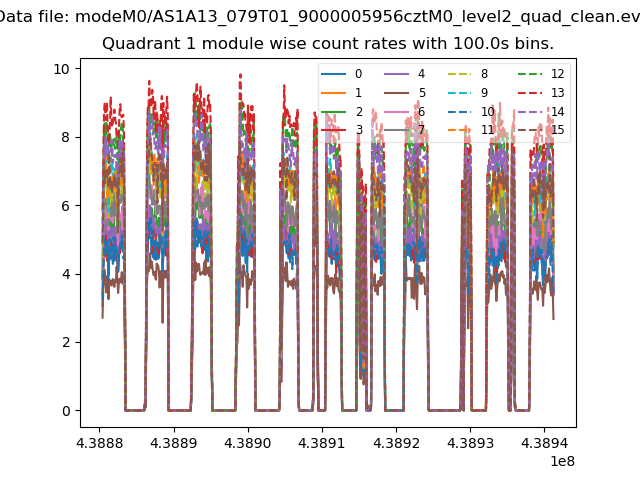
| Module-wise count rates for Quadrant A Data is divided into 100 sec bins |
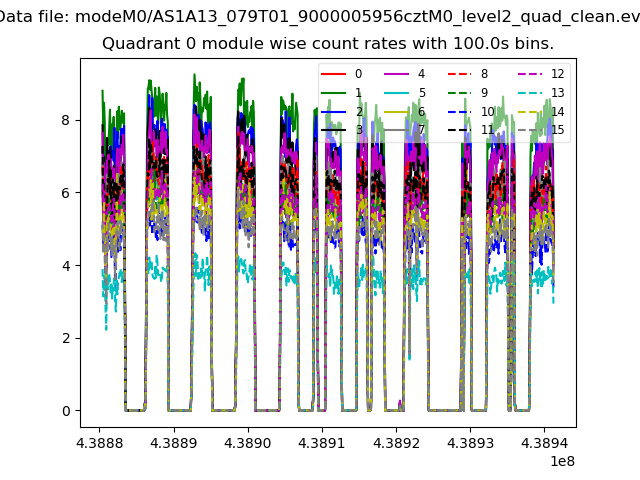 |
 |
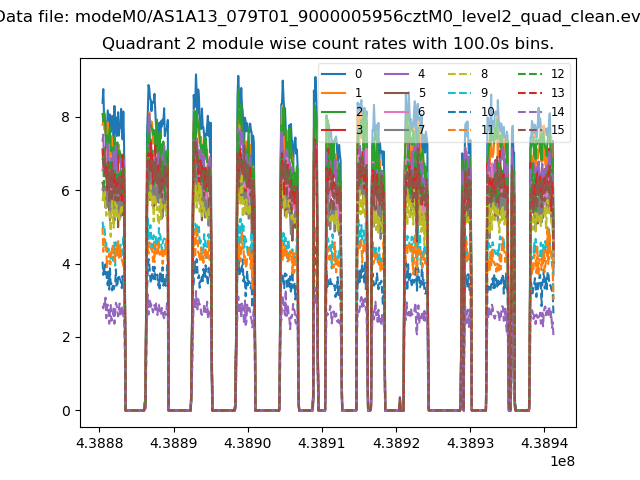
| Module-wise count rates for Quadrant B Data is divided into 100 sec bins |
 |
 |
| Module-wise count rates for Quadrant C Data is divided into 100 sec bins |
 |
 |
| Module-wise count rates for Quadrant D Data is divided into 100 sec bins |
 |
 |
| Parameter | Plot |
|---|---|
| CZT HV Monitor | 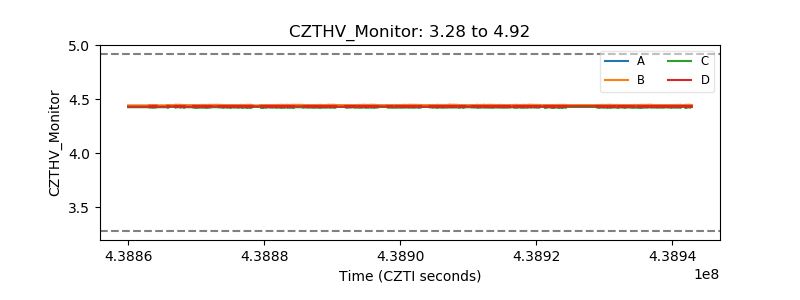 |
| D_VDD | 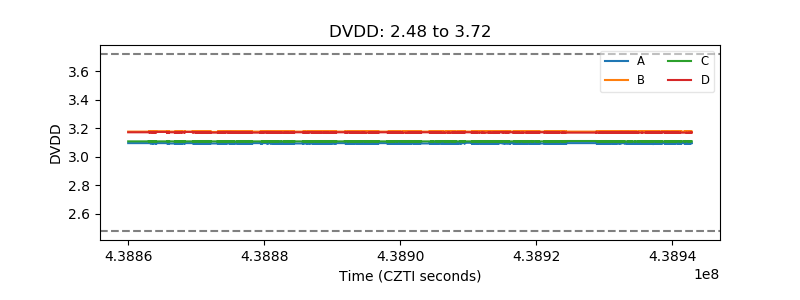 |
| Temperature 1 |  |
| Veto HV Monitor |  |
| Veto LLD | 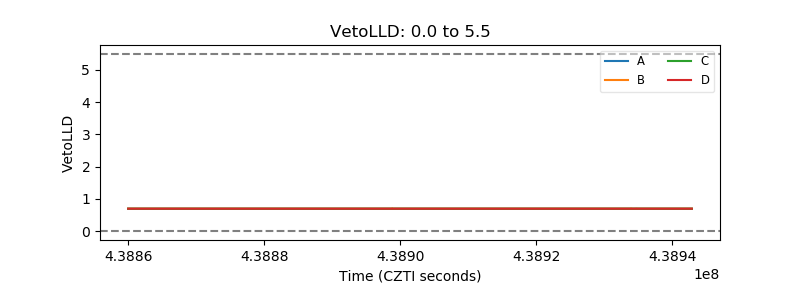 |
| Alpha Counter | 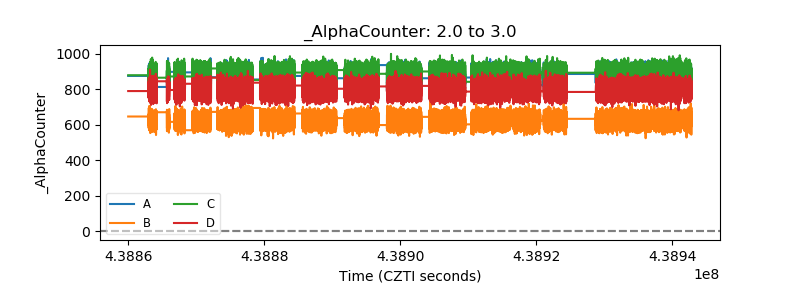 |
| _CPM_Rate | 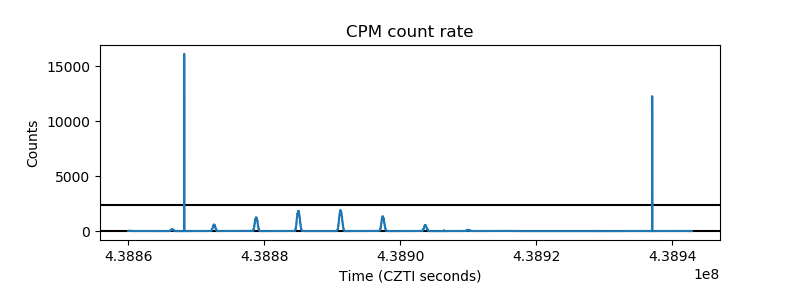 |
| CZT Counter | 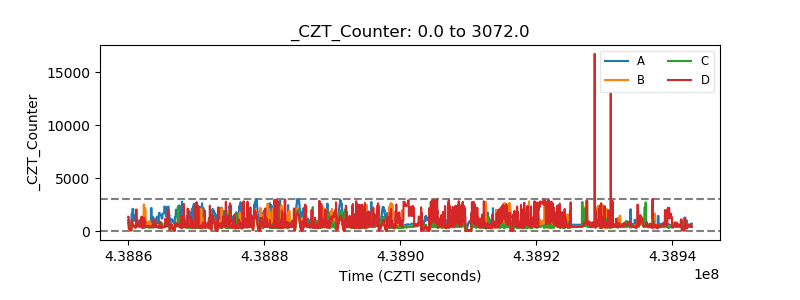 |
| +2.5 Volts monitor | 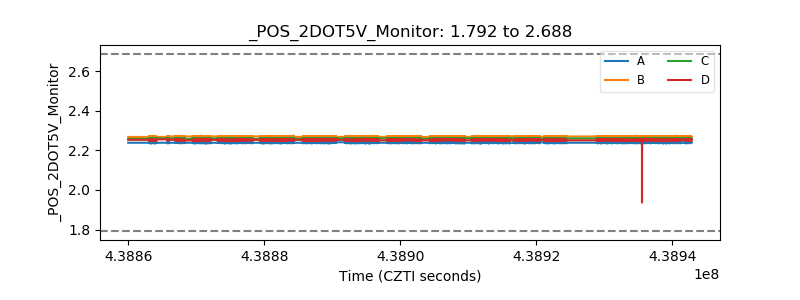 |
| +5 Volts monitor |  |
| _ROLL_ROT | 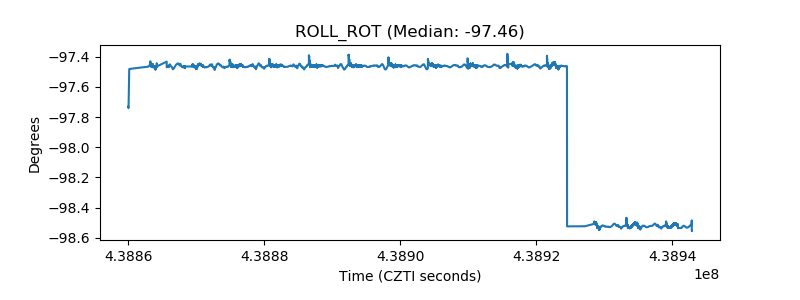 |
| _Roll_DEC | 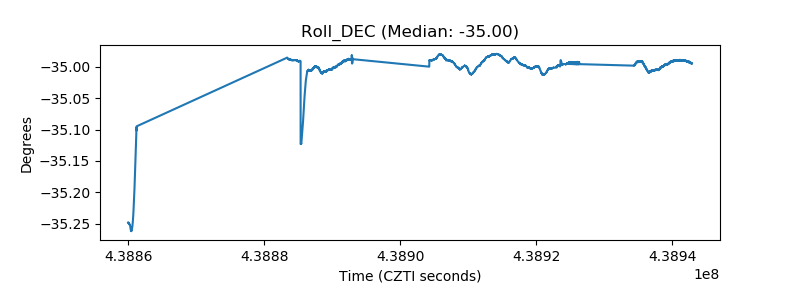 |
| _Roll_RA | 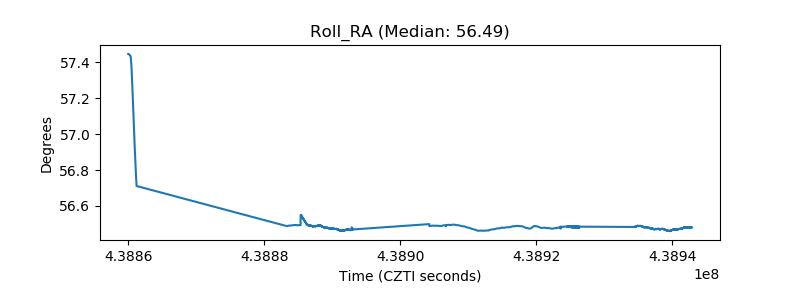 |
| Veto Counter | 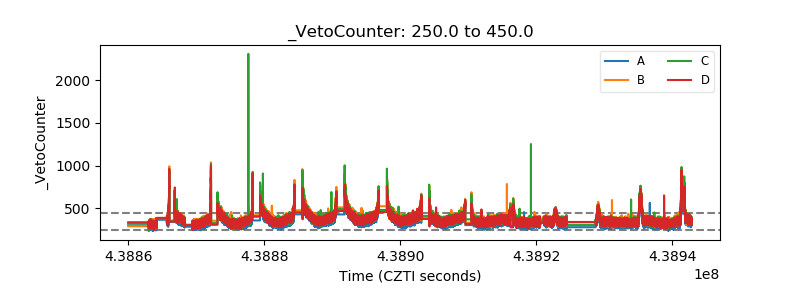 |