| Param | Original file | Final file |
|---|---|---|
| Filename | modeM0/AS1A13_073T04_9000005964cztM0_level2.fits | modeM0/AS1A13_073T04_9000005964cztM0_level2_quad_clean.evt |
| Size (bytes) | 67,446,720 | 63,175,680 |
| Size | 64.3 MB | 60.2 MB |
| Events in quadrant A | 388,792 | 363,703 |
| Events in quadrant B | 377,568 | 346,989 |
| Events in quadrant C | 398,294 | 351,877 |
| Events in quadrant D | 335,962 | 308,024 |
| Mode M0 | |||
|---|---|---|---|
| Quadrant | BADHDUFLAG | Total packets | Discarded packets |
| A | 0 | 22826 | 0 |
| B | 0 | 19389 | 0 |
| C | 0 | 16342 | 0 |
| D | 0 | 21277 | 0 |
| Mode SS | |||
|---|---|---|---|
| Quadrant | BADHDUFLAG | Total packets | Discarded packets |
| A | 0 | 156 | 0 |
| B | 0 | 156 | 0 |
| C | 0 | 156 | 0 |
| D | 0 | 156 | 0 |
| Quadrant | Total seconds | Saturated seconds | Saturation percentage |
|---|---|---|---|
| A | 7791 | 388 | 4.980105% |
| B | 7792 | 352 | 4.517454% |
| C | 7792 | 11 | 0.141170% |
| D | 7792 | 315 | 4.042608% |
Noise dominated data is calculated using 1-second bins in cleaned event files. If a bin has >2000 counts, and if more than 50% of those come from <1% of pixels, then it is considered to be noise-dominated and hence unusable.
| Quadrant | # 1 sec bins | Bins with >0 counts | Bins with >2000 counts | High rate bins dominated by noise | Noise dominated (total time) | Noise dominated (detector-on time) | Marked lightcurve |
|---|---|---|---|---|---|---|---|
| A | 7791 | 7789 | 0 | 0 | 0.00% | 0.00% | 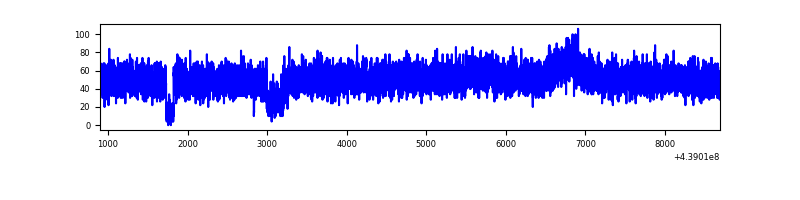 |
| B | 7792 | 7789 | 0 | 0 | 0.00% | 0.00% |  |
| C | 7792 | 7792 | 0 | 0 | 0.00% | 0.00% |  |
| D | 7792 | 7789 | 0 | 0 | 0.00% | 0.00% |  |
Top three noisy pixels from each quadrant. If the there are fewer than three noisy pixels in the level2.evt file, extra rows are filled as -1
| Pixel properties | Quadrant properties | ||||||
|---|---|---|---|---|---|---|---|
| Quadrant | DetID | PixID | Counts | Sigma | Mean | Median | Sigma |
| A | 0 | 29 | 335 | 8.6 | 101 | 95 | 27.9 |
| A | 14 | 95 | 325 | 8.24 | 101 | 95 | 27.9 |
| A | 7 | 109 | 318 | 7.99 | 101 | 95 | 27.9 |
| B | 2 | 9 | 393 | 13.28 | 99 | 95 | 22.4 |
| B | 2 | 8 | 279 | 8.2 | 99 | 95 | 22.4 |
| B | 3 | 17 | 269 | 7.75 | 99 | 95 | 22.4 |
| C | 1 | 80 | 320 | 7.62 | 105 | 98 | 29.2 |
| C | 1 | 81 | 320 | 7.62 | 105 | 98 | 29.2 |
| C | 3 | 202 | 306 | 7.14 | 105 | 98 | 29.2 |
| D | 8 | 192 | 253 | 5.75 | 96 | 87 | 28.9 |
| D | 8 | 176 | 244 | 5.44 | 96 | 87 | 28.9 |
| D | 6 | 79 | 238 | 5.23 | 96 | 87 | 28.9 |
Histogram calculated using DETX and DETY for each event in the final _common_clean file
| Quadrant A | 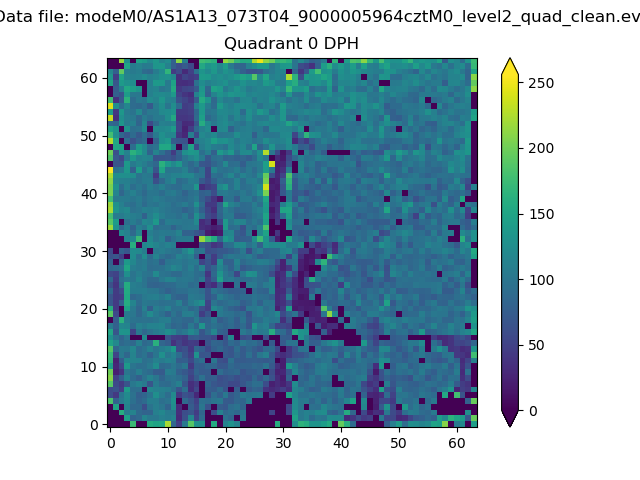 |
 |
Quadrant B |
|---|---|---|---|
| Quadrant D | 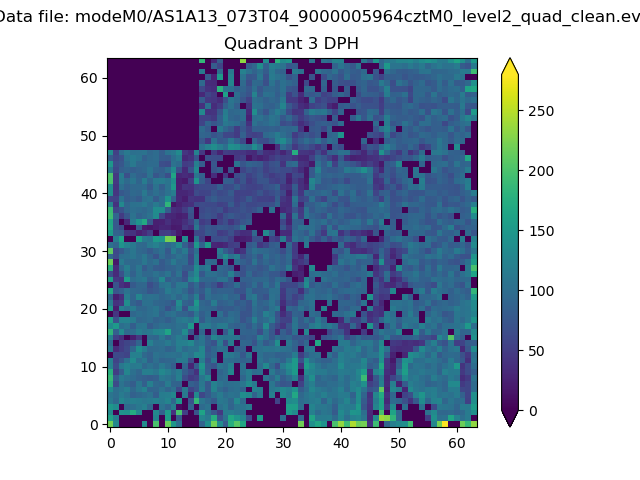 |
 |
Quadrant C |
| Plot type | Count rate plots | Images |
|---|---|---|
| Comparison with Poisson distribution Blue bars denote a histogram of data divided into 1 sec bins. Red curve is a Poisson curve with rate = median count rate of data. |
 |
 |
| Quadrant-wise count rates Data is divided into 100 sec bins |
 |
|
| Module-wise count rates for Quadrant A Data is divided into 100 sec bins |
 |
 |
| Module-wise count rates for Quadrant B Data is divided into 100 sec bins |
 |
 |
| Module-wise count rates for Quadrant C Data is divided into 100 sec bins |
 |
 |
| Module-wise count rates for Quadrant D Data is divided into 100 sec bins |
 |
 |
| Parameter | Plot |
|---|---|
| CZT HV Monitor |  |
| D_VDD | 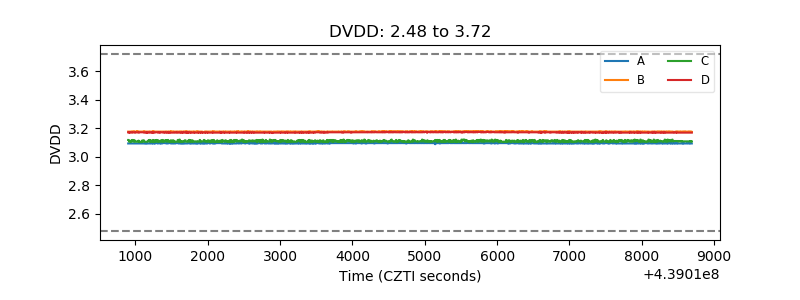 |
| Temperature 1 |  |
| Veto HV Monitor | 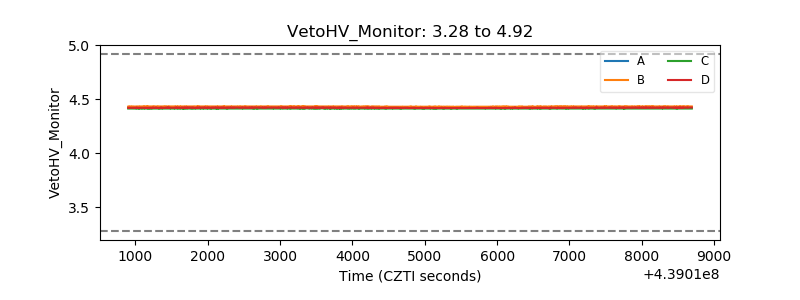 |
| Veto LLD |  |
| Alpha Counter | 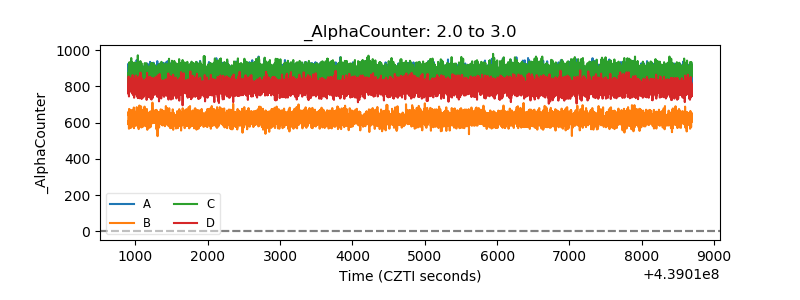 |
| _CPM_Rate |  |
| CZT Counter |  |
| +2.5 Volts monitor |  |
| +5 Volts monitor |  |
| _ROLL_ROT | 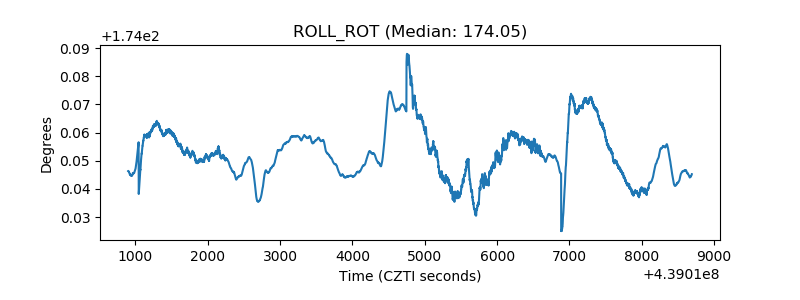 |
| _Roll_DEC | 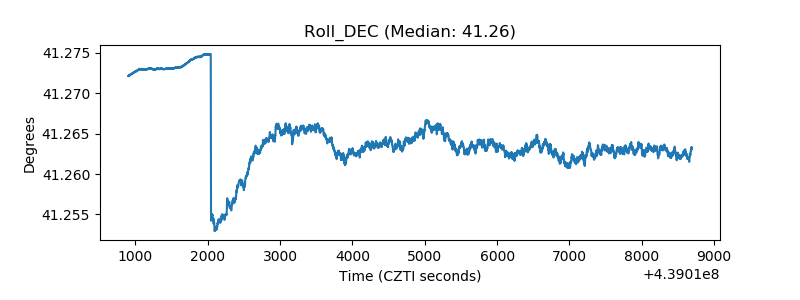 |
| _Roll_RA |  |
| Veto Counter |  |