| Param | Original file | Final file |
|---|---|---|
| Filename | modeM0/AS1A13_074T08_9000005966cztM0_level2.fits | modeM0/AS1A13_074T08_9000005966cztM0_level2_quad_clean.evt |
| Size (bytes) | 270,086,400 | 232,905,600 |
| Size | 257.6 MB | 222.1 MB |
| Events in quadrant A | 1,617,534 | 1,311,872 |
| Events in quadrant B | 1,545,068 | 1,307,303 |
| Events in quadrant C | 1,627,412 | 1,271,667 |
| Events in quadrant D | 1,325,948 | 1,099,759 |
| Mode M0 | |||
|---|---|---|---|
| Quadrant | BADHDUFLAG | Total packets | Discarded packets |
| A | 0 | 88530 | 0 |
| B | 0 | 76728 | 0 |
| C | 0 | 64336 | 0 |
| D | 0 | 92242 | 0 |
| Mode SS | |||
|---|---|---|---|
| Quadrant | BADHDUFLAG | Total packets | Discarded packets |
| A | 0 | 616 | 0 |
| B | 0 | 616 | 0 |
| C | 0 | 616 | 0 |
| D | 0 | 616 | 0 |
| Mode M9 | |||
|---|---|---|---|
| Quadrant | BADHDUFLAG | Total packets | Discarded packets |
| A | 0 | 45 | 0 |
| B | 0 | 45 | 0 |
| C | 0 | 45 | 0 |
| D | 0 | 45 | 0 |
| Quadrant | Total seconds | Saturated seconds | Saturation percentage |
|---|---|---|---|
| A | 29982 | 849 | 2.831699% |
| B | 29982 | 1333 | 4.446001% |
| C | 29982 | 477 | 1.590955% |
| D | 29982 | 2588 | 8.631846% |
Noise dominated data is calculated using 1-second bins in cleaned event files. If a bin has >2000 counts, and if more than 50% of those come from <1% of pixels, then it is considered to be noise-dominated and hence unusable.
| Quadrant | # 1 sec bins | Bins with >0 counts | Bins with >2000 counts | High rate bins dominated by noise | Noise dominated (total time) | Noise dominated (detector-on time) | Marked lightcurve |
|---|---|---|---|---|---|---|---|
| A | 34687 | 29983 | 0 | 0 | 0.00% | 0.00% |  |
| B | 34687 | 29968 | 0 | 0 | 0.00% | 0.00% | 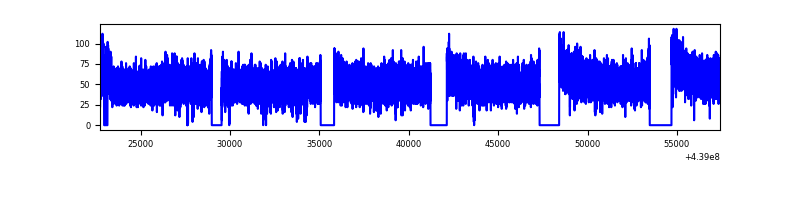 |
| C | 34687 | 29981 | 0 | 0 | 0.00% | 0.00% |  |
| D | 34687 | 29805 | 0 | 0 | 0.00% | 0.00% | 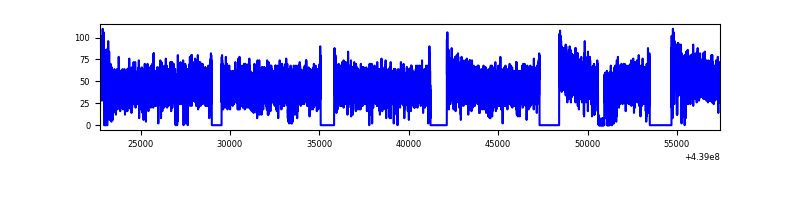 |
Top three noisy pixels from each quadrant. If the there are fewer than three noisy pixels in the level2.evt file, extra rows are filled as -1
| Pixel properties | Quadrant properties | ||||||
|---|---|---|---|---|---|---|---|
| Quadrant | DetID | PixID | Counts | Sigma | Mean | Median | Sigma |
| A | 7 | 110 | 1352 | 8.8 | 422 | 394 | 108.9 |
| A | 15 | 236 | 1254 | 7.9 | 422 | 394 | 108.9 |
| A | 7 | 109 | 1245 | 7.81 | 422 | 394 | 108.9 |
| B | 2 | 9 | 1383 | 11.95 | 409 | 389 | 83.2 |
| B | 2 | 8 | 1125 | 8.84 | 409 | 389 | 83.2 |
| B | 5 | 232 | 1023 | 7.62 | 409 | 389 | 83.2 |
| C | 1 | 80 | 1243 | 7.53 | 431 | 401 | 111.7 |
| C | 1 | 81 | 1242 | 7.53 | 431 | 401 | 111.7 |
| C | 3 | 158 | 1134 | 6.56 | 431 | 401 | 111.7 |
| D | 6 | 38 | 991 | 6.07 | 382 | 347 | 106.1 |
| D | 4 | 12 | 984 | 6.0 | 382 | 347 | 106.1 |
| D | 10 | 189 | 958 | 5.76 | 382 | 347 | 106.1 |
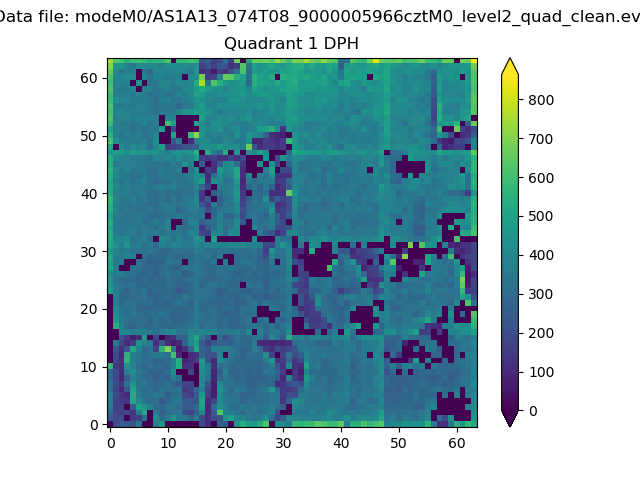
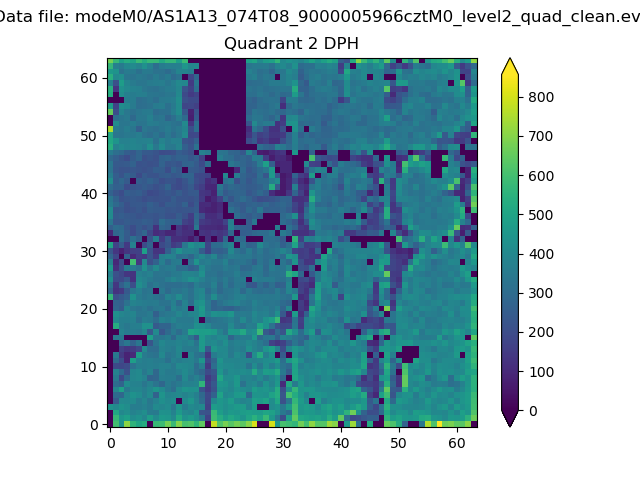
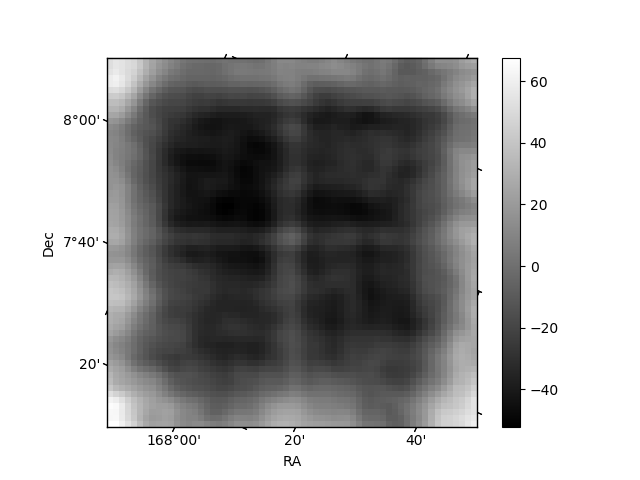
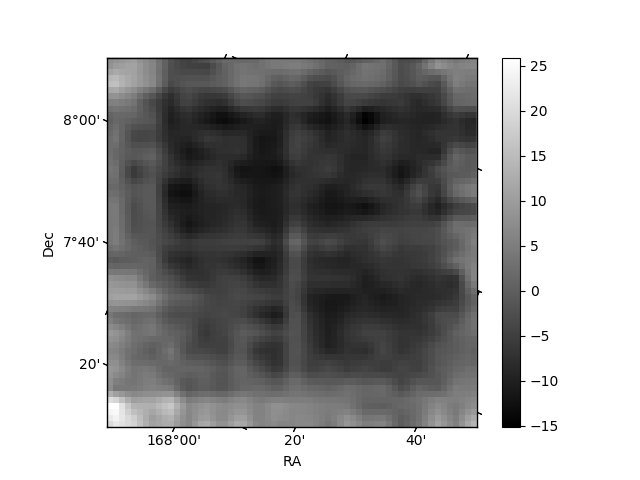
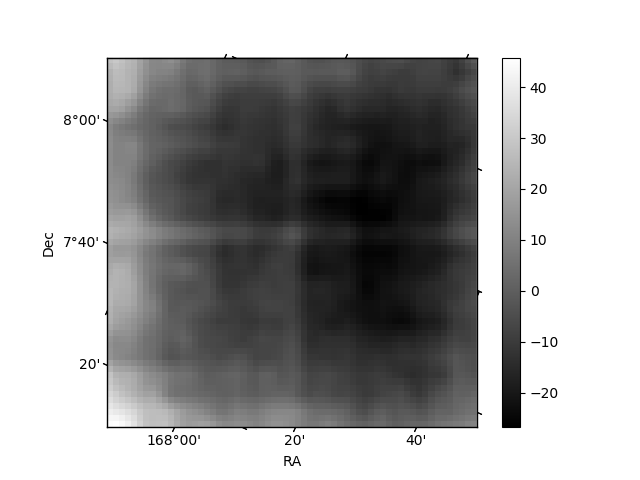
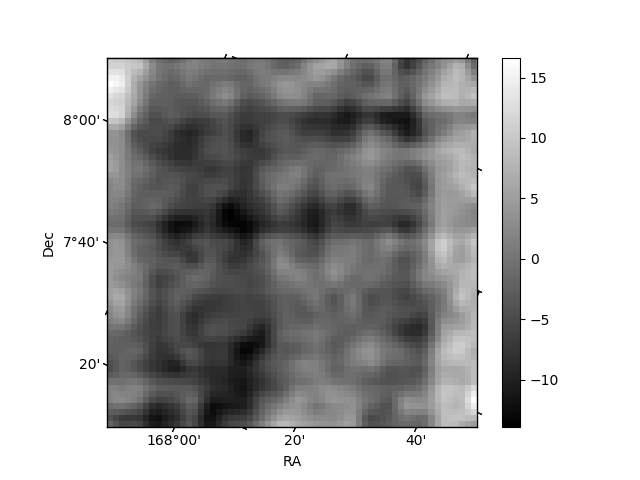
Histogram calculated using DETX and DETY for each event in the final _common_clean file
| Quadrant A |  |
 |
Quadrant B |
|---|---|---|---|
| Quadrant D | 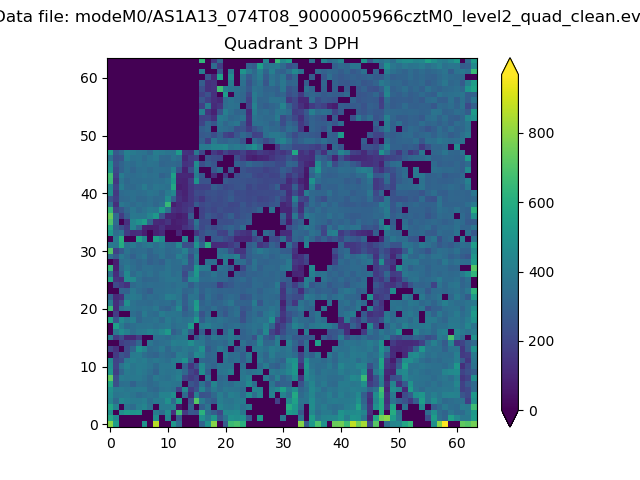 |
 |
Quadrant C |
| Plot type | Count rate plots | Images |
|---|---|---|
| Comparison with Poisson distribution Blue bars denote a histogram of data divided into 1 sec bins. Red curve is a Poisson curve with rate = median count rate of data. |
 |
 |
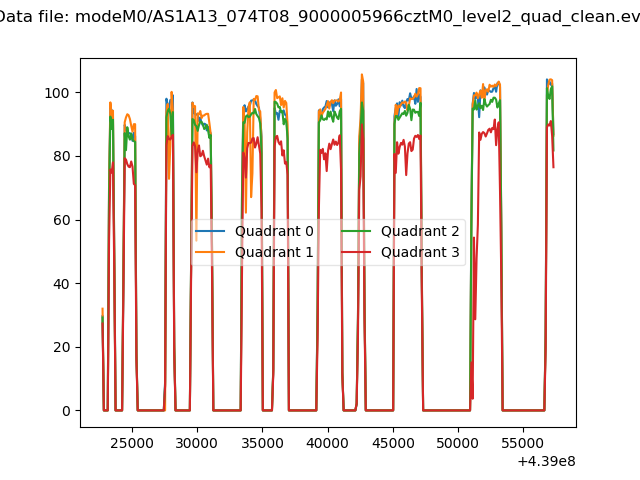
| Quadrant-wise count rates Data is divided into 100 sec bins |
 |
|
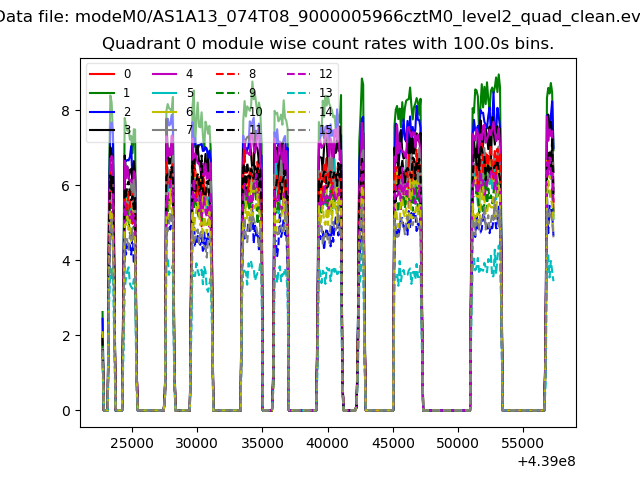
| Module-wise count rates for Quadrant A Data is divided into 100 sec bins |
 |
 |
| Module-wise count rates for Quadrant B Data is divided into 100 sec bins |
 |
 |
| Module-wise count rates for Quadrant C Data is divided into 100 sec bins |
 |
 |
| Module-wise count rates for Quadrant D Data is divided into 100 sec bins |
 |
 |
| Parameter | Plot |
|---|---|
| CZT HV Monitor | 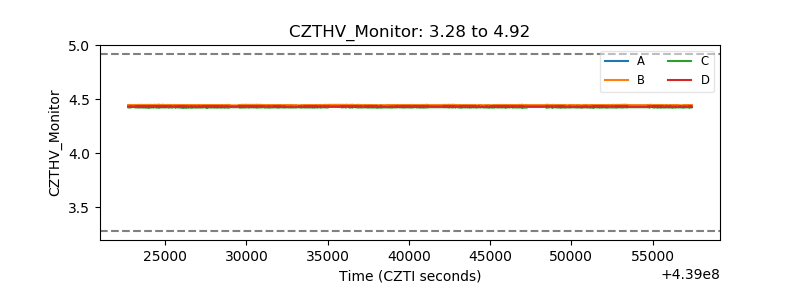 |
| D_VDD | 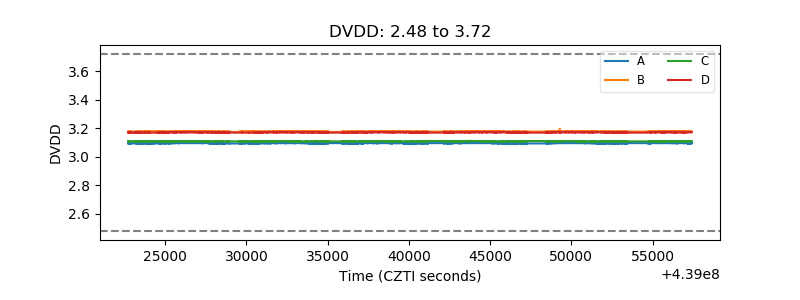 |
| Temperature 1 | 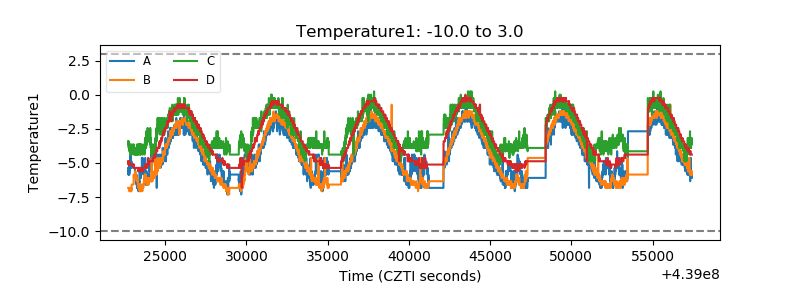 |
| Veto HV Monitor |  |
| Veto LLD | 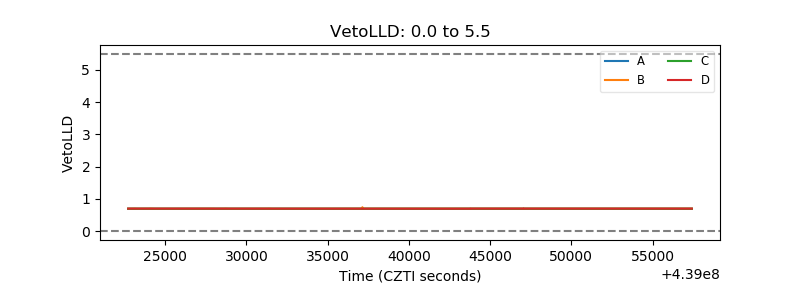 |
| Alpha Counter | 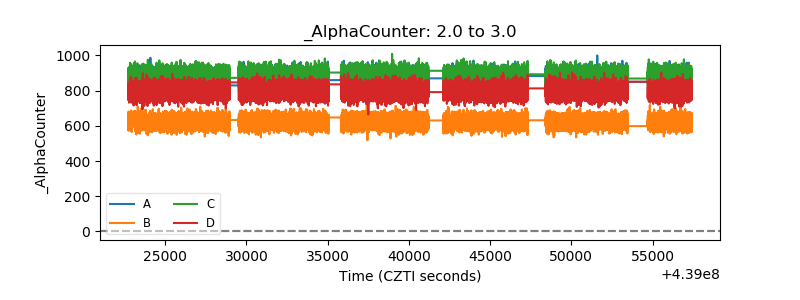 |
| _CPM_Rate | 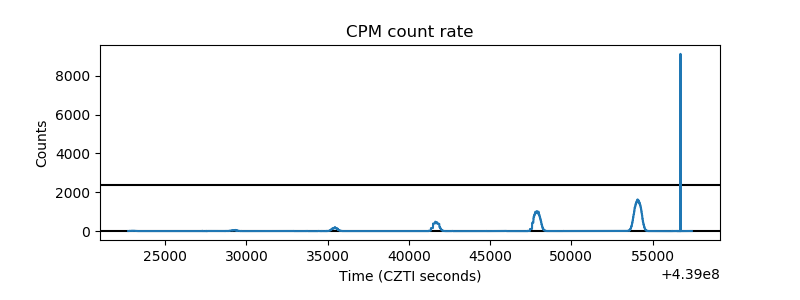 |
| CZT Counter | 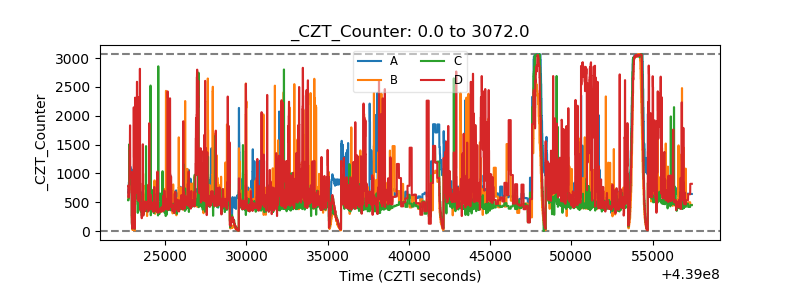 |
| +2.5 Volts monitor | 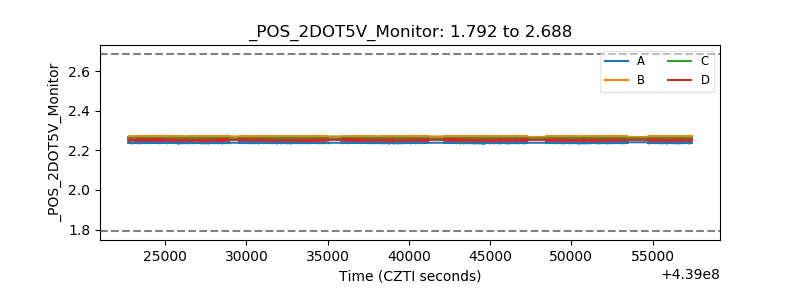 |
| +5 Volts monitor |  |
| _ROLL_ROT | 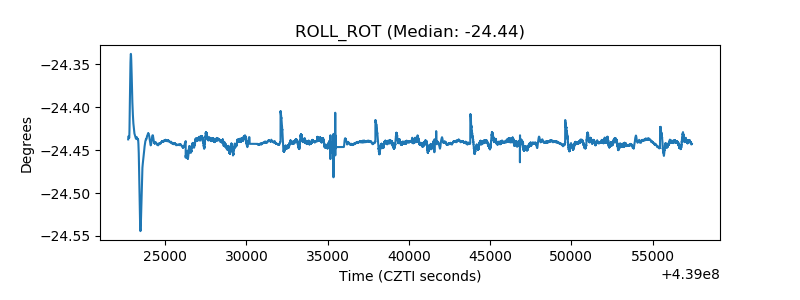 |
| _Roll_DEC | 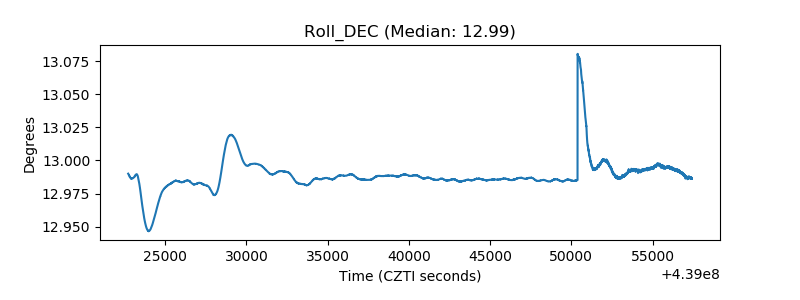 |
| _Roll_RA |  |
| Veto Counter |  |