| Param | Original file | Final file |
|---|---|---|
| Filename | modeM0/AS1A13_071T06_9000005972cztM0_level2.fits | modeM0/AS1A13_071T06_9000005972cztM0_level2_quad_clean.evt |
| Size (bytes) | 466,686,720 | 503,729,280 |
| Size | 445.1 MB | 480.4 MB |
| Events in quadrant A | 2,699,958 | 2,864,999 |
| Events in quadrant B | 2,735,534 | 3,222,381 |
| Events in quadrant C | 2,881,656 | 3,125,752 |
| Events in quadrant D | 2,101,714 | 2,338,083 |
| Mode M0 | |||
|---|---|---|---|
| Quadrant | BADHDUFLAG | Total packets | Discarded packets |
| A | 0 | 200453 | 0 |
| B | 0 | 136903 | 0 |
| C | 0 | 116110 | 0 |
| D | 0 | 212315 | 0 |
| Mode SS | |||
|---|---|---|---|
| Quadrant | BADHDUFLAG | Total packets | Discarded packets |
| A | 0 | 1096 | 0 |
| B | 0 | 1096 | 0 |
| C | 0 | 1096 | 0 |
| D | 0 | 1096 | 0 |
| Mode M9 | |||
|---|---|---|---|
| Quadrant | BADHDUFLAG | Total packets | Discarded packets |
| A | 0 | 78 | 0 |
| B | 0 | 80 | 0 |
| C | 0 | 80 | 0 |
| D | 0 | 80 | 0 |
| Quadrant | Total seconds | Saturated seconds | Saturation percentage |
|---|---|---|---|
| A | 53982 | 6994 | 12.956171% |
| B | 53983 | 2708 | 5.016394% |
| C | 53979 | 719 | 1.331999% |
| D | 53980 | 13847 | 25.652093% |
Noise dominated data is calculated using 1-second bins in cleaned event files. If a bin has >2000 counts, and if more than 50% of those come from <1% of pixels, then it is considered to be noise-dominated and hence unusable.
| Quadrant | # 1 sec bins | Bins with >0 counts | Bins with >2000 counts | High rate bins dominated by noise | Noise dominated (total time) | Noise dominated (detector-on time) | Marked lightcurve |
|---|---|---|---|---|---|---|---|
| A | 70451 | 53853 | 0 | 0 | 0.00% | 0.00% | 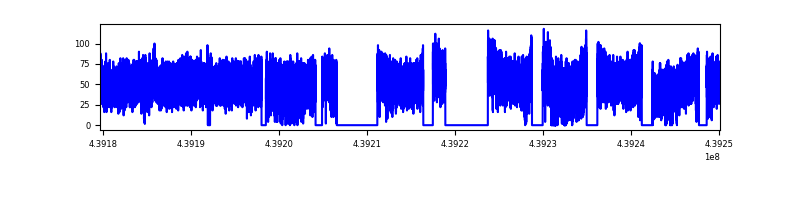 |
| B | 70452 | 53973 | 0 | 0 | 0.00% | 0.00% |  |
| C | 70452 | 53980 | 0 | 0 | 0.00% | 0.00% | 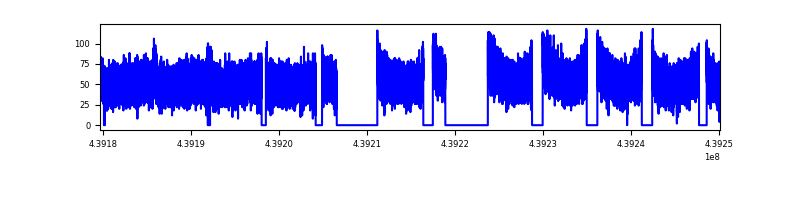 |
| D | 70452 | 53326 | 0 | 0 | 0.00% | 0.00% | 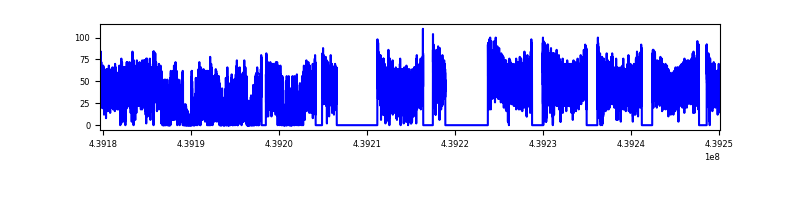 |
Top three noisy pixels from each quadrant. If the there are fewer than three noisy pixels in the level2.evt file, extra rows are filled as -1
| Pixel properties | Quadrant properties | ||||||
|---|---|---|---|---|---|---|---|
| Quadrant | DetID | PixID | Counts | Sigma | Mean | Median | Sigma |
| A | 7 | 110 | 2199 | 8.68 | 703 | 659 | 177.3 |
| A | 0 | 29 | 2170 | 8.52 | 703 | 659 | 177.3 |
| A | 15 | 236 | 2072 | 7.97 | 703 | 659 | 177.3 |
| B | 2 | 9 | 2485 | 12.48 | 724 | 690 | 143.8 |
| B | 2 | 8 | 1974 | 8.93 | 724 | 690 | 143.8 |
| B | 5 | 232 | 1904 | 8.44 | 724 | 690 | 143.8 |
| C | 3 | 202 | 2271 | 7.94 | 763 | 713 | 196.2 |
| C | 1 | 81 | 2232 | 7.74 | 763 | 713 | 196.2 |
| C | 3 | 203 | 2151 | 7.33 | 763 | 713 | 196.2 |
| D | 6 | 79 | 1542 | 5.87 | 606 | 550 | 169.1 |
| D | 6 | 38 | 1540 | 5.85 | 606 | 550 | 169.1 |
| D | 10 | 189 | 1534 | 5.82 | 606 | 550 | 169.1 |
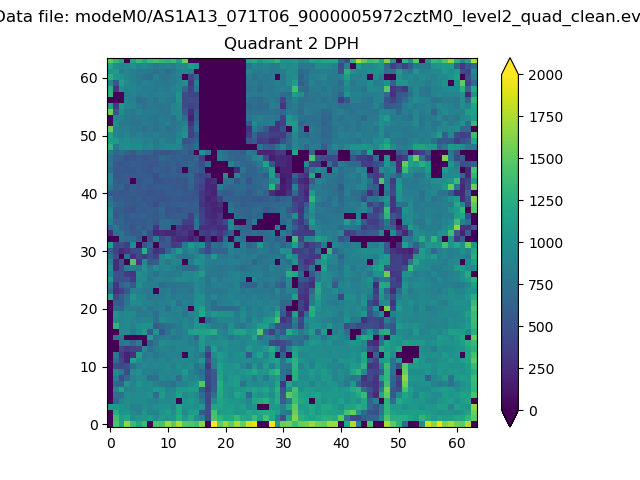
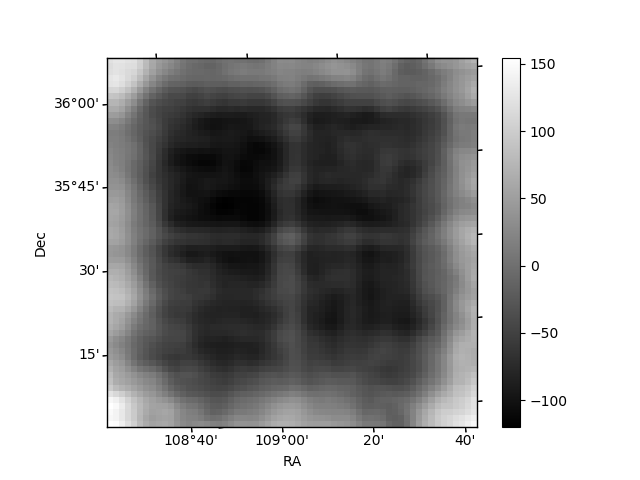
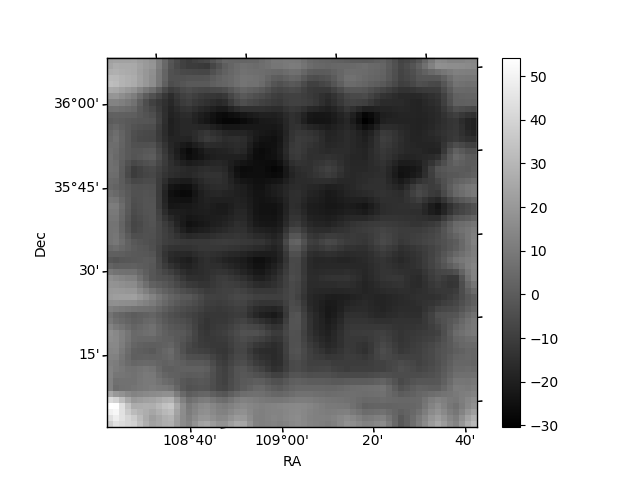
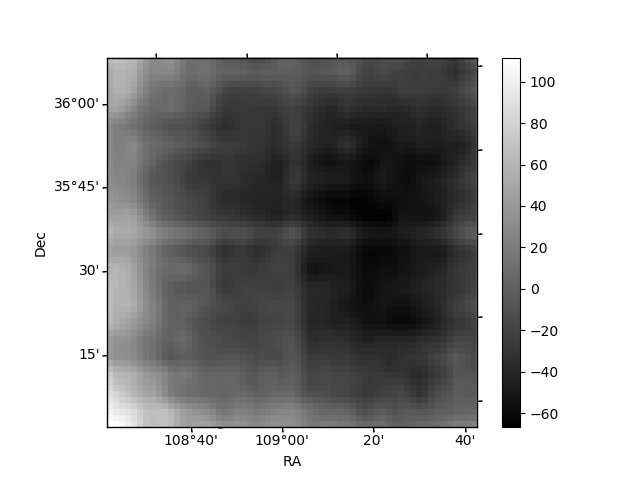
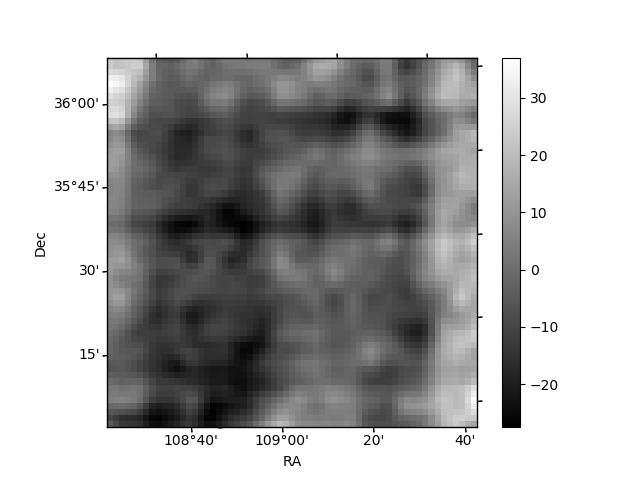
Histogram calculated using DETX and DETY for each event in the final _common_clean file
| Quadrant A | 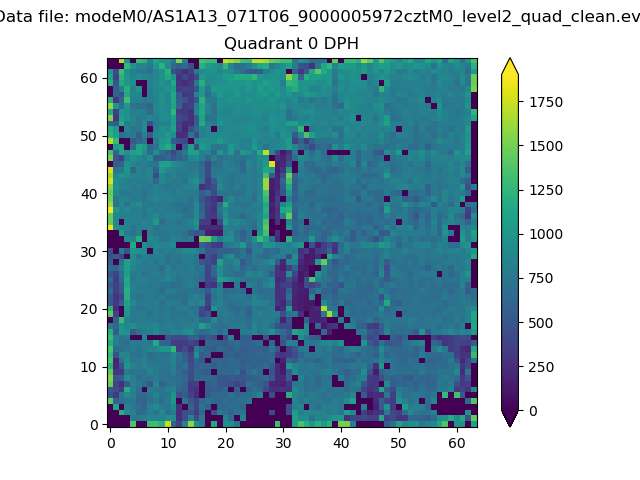 |
 |
Quadrant B |
|---|---|---|---|
| Quadrant D |  |
 |
Quadrant C |
| Plot type | Count rate plots | Images |
|---|---|---|
| Comparison with Poisson distribution Blue bars denote a histogram of data divided into 1 sec bins. Red curve is a Poisson curve with rate = median count rate of data. |
 |
 |
| Quadrant-wise count rates Data is divided into 100 sec bins |
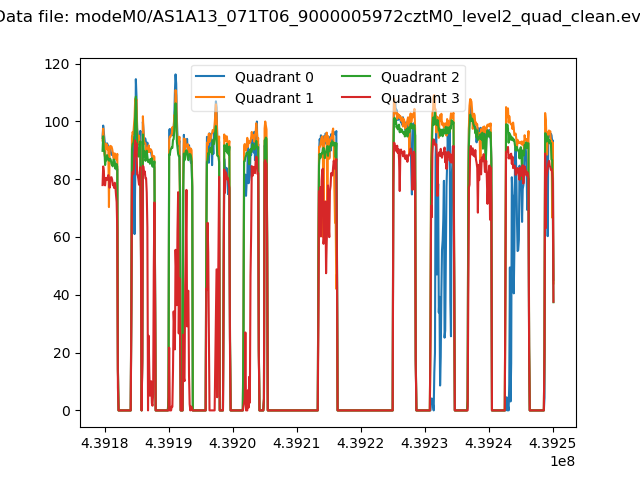 |
|
| Module-wise count rates for Quadrant A Data is divided into 100 sec bins |
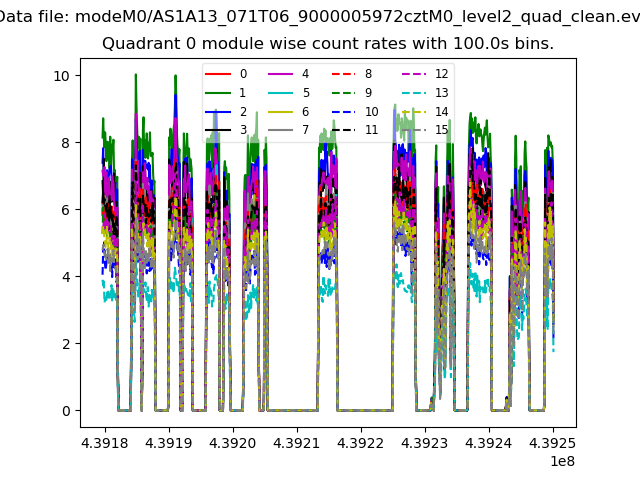 |
 |
| Module-wise count rates for Quadrant B Data is divided into 100 sec bins |
 |
 |
| Module-wise count rates for Quadrant C Data is divided into 100 sec bins |
 |
 |
| Module-wise count rates for Quadrant D Data is divided into 100 sec bins |
 |
 |
| Parameter | Plot |
|---|---|
| CZT HV Monitor |  |
| D_VDD | 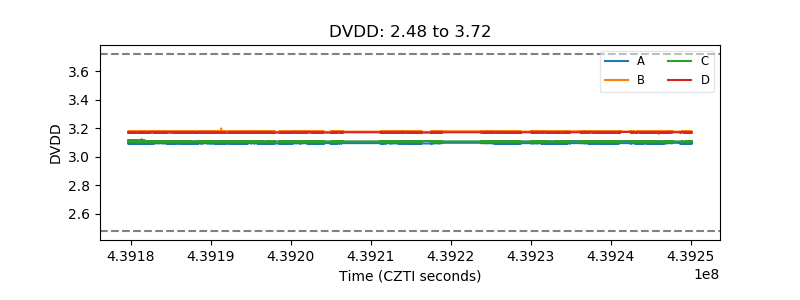 |
| Temperature 1 | 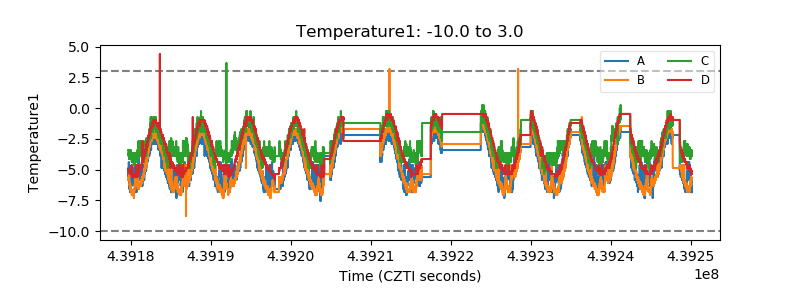 |
| Veto HV Monitor | 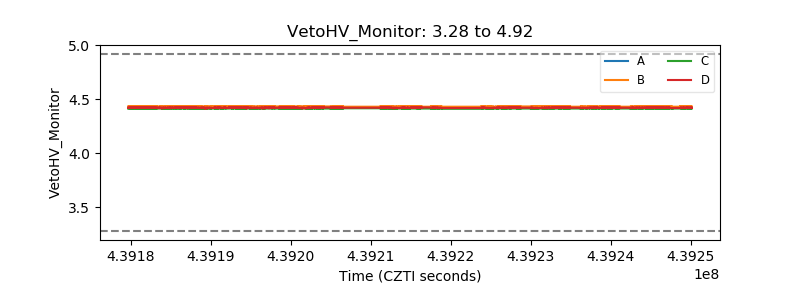 |
| Veto LLD | 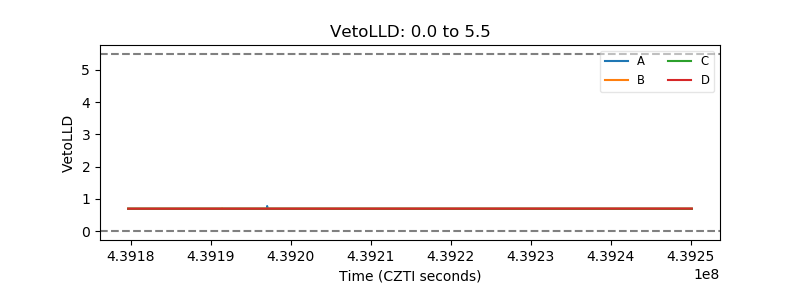 |
| Alpha Counter | 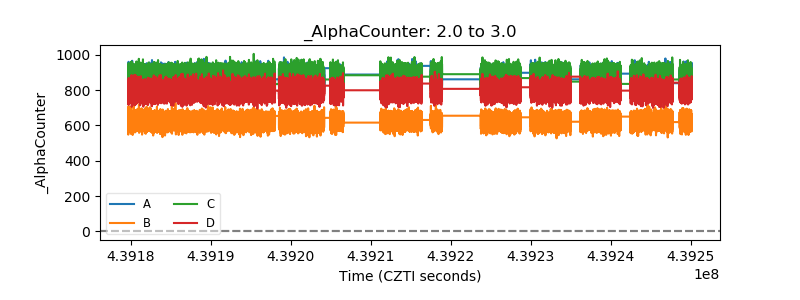 |
| _CPM_Rate | 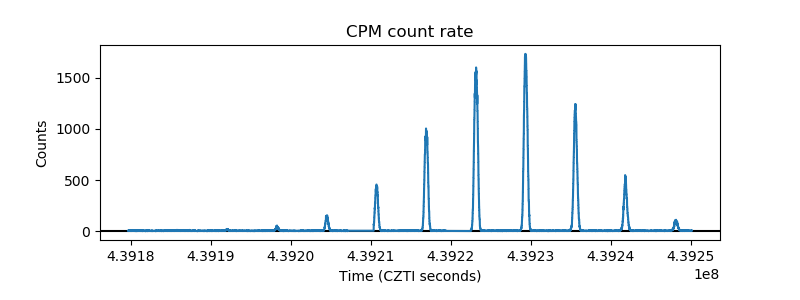 |
| CZT Counter | 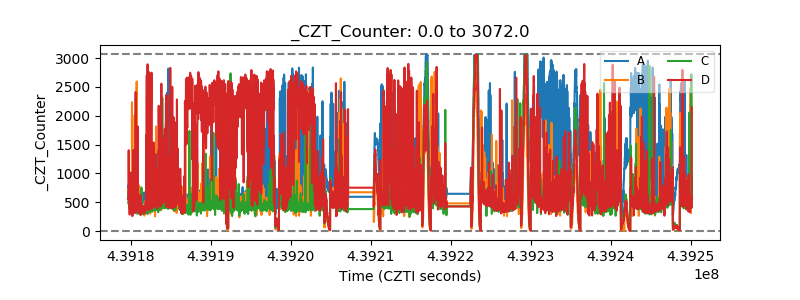 |
| +2.5 Volts monitor | 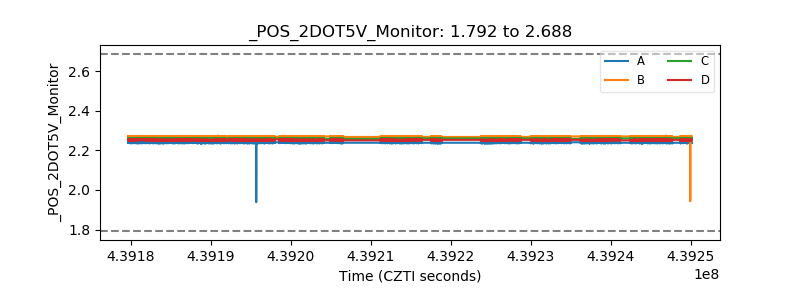 |
| +5 Volts monitor |  |
| _ROLL_ROT |  |
| _Roll_DEC | 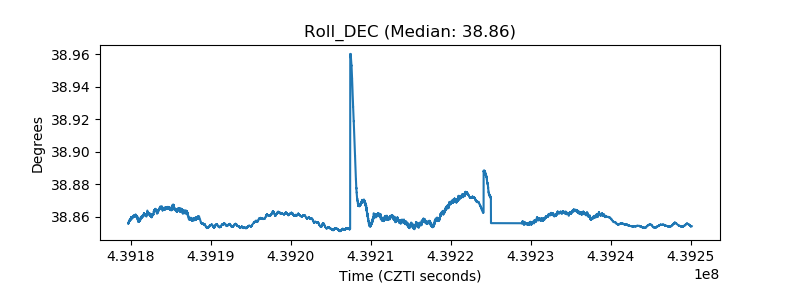 |
| _Roll_RA | 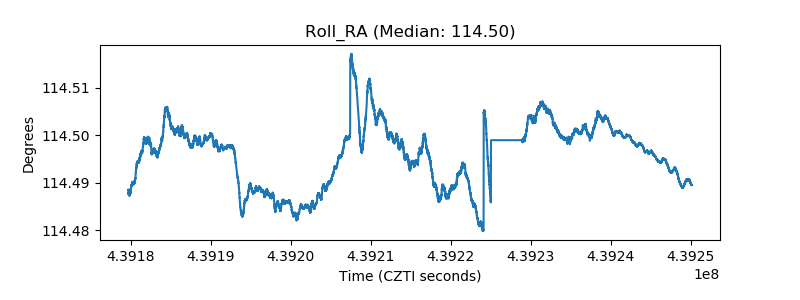 |
| Veto Counter |  |