| Param | Original file | Final file |
|---|---|---|
| Filename | modeM0/AS1A13_074T01_9000005974cztM0_level2.fits | modeM0/AS1A13_074T01_9000005974cztM0_level2_quad_clean.evt |
| Size (bytes) | 252,351,360 | 277,041,600 |
| Size | 240.7 MB | 264.2 MB |
| Events in quadrant A | 1,426,164 | 1,525,724 |
| Events in quadrant B | 1,443,466 | 1,710,874 |
| Events in quadrant C | 1,479,410 | 1,669,399 |
| Events in quadrant D | 1,254,476 | 1,448,151 |
| Mode M9 | |||
|---|---|---|---|
| Quadrant | BADHDUFLAG | Total packets | Discarded packets |
| A | 0 | 7 | 0 |
| B | 0 | 8 | 0 |
| C | 0 | 8 | 0 |
| D | 0 | 8 | 0 |
| Mode SS | |||
|---|---|---|---|
| Quadrant | BADHDUFLAG | Total packets | Discarded packets |
| A | 0 | 594 | 0 |
| B | 0 | 594 | 0 |
| C | 0 | 594 | 0 |
| D | 0 | 594 | 0 |
| Mode M0 | |||
|---|---|---|---|
| Quadrant | BADHDUFLAG | Total packets | Discarded packets |
| A | 0 | 110195 | 0 |
| B | 0 | 69499 | 0 |
| C | 0 | 68906 | 0 |
| D | 0 | 85366 | 0 |
| Quadrant | Total seconds | Saturated seconds | Saturation percentage |
|---|---|---|---|
| A | 29617 | 3808 | 12.857481% |
| B | 29620 | 812 | 2.741391% |
| C | 29620 | 1224 | 4.132343% |
| D | 29616 | 2099 | 7.087385% |
Noise dominated data is calculated using 1-second bins in cleaned event files. If a bin has >2000 counts, and if more than 50% of those come from <1% of pixels, then it is considered to be noise-dominated and hence unusable.
| Quadrant | # 1 sec bins | Bins with >0 counts | Bins with >2000 counts | High rate bins dominated by noise | Noise dominated (total time) | Noise dominated (detector-on time) | Marked lightcurve |
|---|---|---|---|---|---|---|---|
| A | 30086 | 29595 | 0 | 0 | 0.00% | 0.00% | 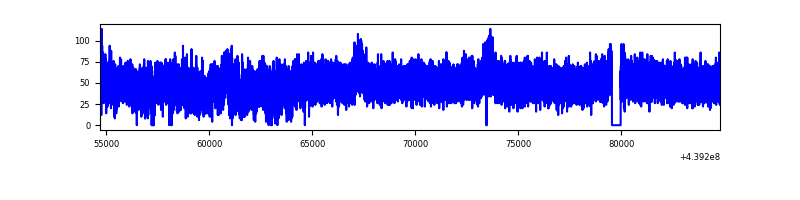 |
| B | 30085 | 29618 | 0 | 0 | 0.00% | 0.00% |  |
| C | 30085 | 29217 | 0 | 0 | 0.00% | 0.00% | 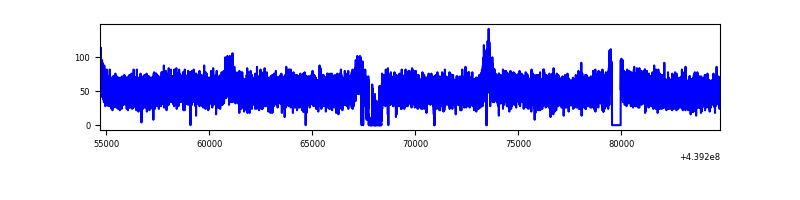 |
| D | 30085 | 29560 | 0 | 0 | 0.00% | 0.00% |  |
Top three noisy pixels from each quadrant. If the there are fewer than three noisy pixels in the level2.evt file, extra rows are filled as -1
| Pixel properties | Quadrant properties | ||||||
|---|---|---|---|---|---|---|---|
| Quadrant | DetID | PixID | Counts | Sigma | Mean | Median | Sigma |
| A | 7 | 110 | 1181 | 8.53 | 372 | 347 | 97.7 |
| A | 15 | 236 | 1137 | 8.08 | 372 | 347 | 97.7 |
| A | 0 | 29 | 1136 | 8.07 | 372 | 347 | 97.7 |
| B | 2 | 9 | 1353 | 12.42 | 382 | 361 | 79.9 |
| B | 2 | 8 | 1104 | 9.3 | 382 | 361 | 79.9 |
| B | 3 | 17 | 1078 | 8.98 | 382 | 361 | 79.9 |
| C | 3 | 202 | 1158 | 7.79 | 390 | 361 | 102.4 |
| C | 3 | 203 | 1116 | 7.38 | 390 | 361 | 102.4 |
| C | 1 | 80 | 1094 | 7.16 | 390 | 361 | 102.4 |
| D | 4 | 16 | 940 | 6.02 | 361 | 327 | 101.8 |
| D | 10 | 189 | 887 | 5.5 | 361 | 327 | 101.8 |
| D | 10 | 113 | 887 | 5.5 | 361 | 327 | 101.8 |
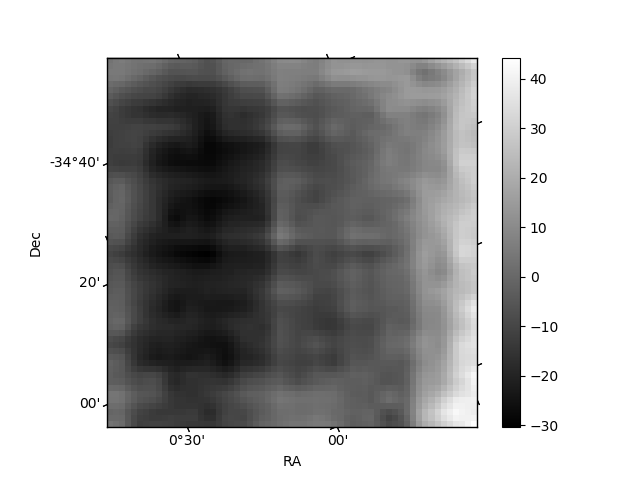
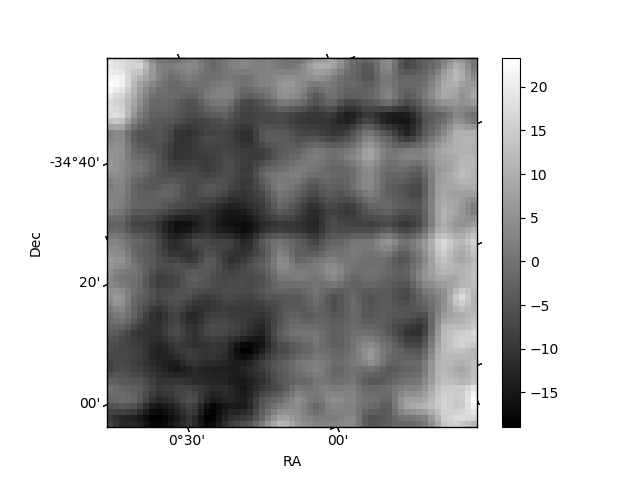
Histogram calculated using DETX and DETY for each event in the final _common_clean file
| Quadrant A | 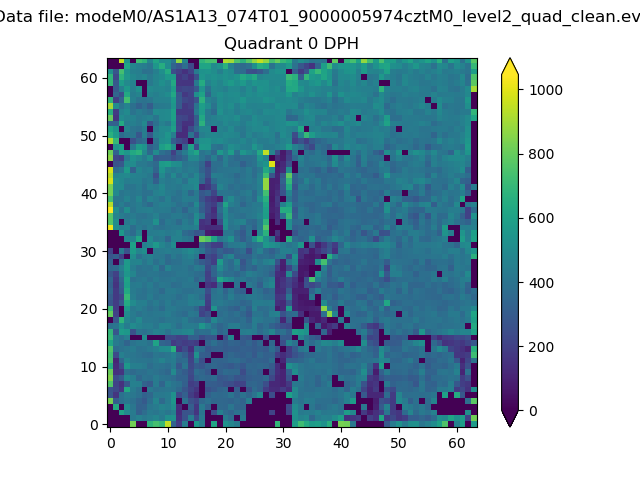 |
 |
Quadrant B |
|---|---|---|---|
| Quadrant D | 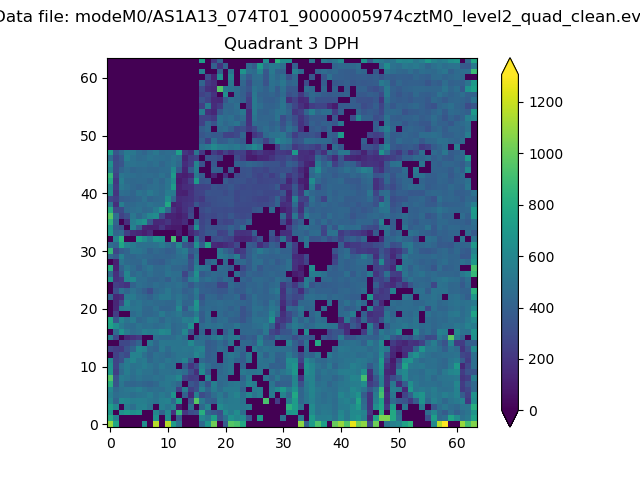 |
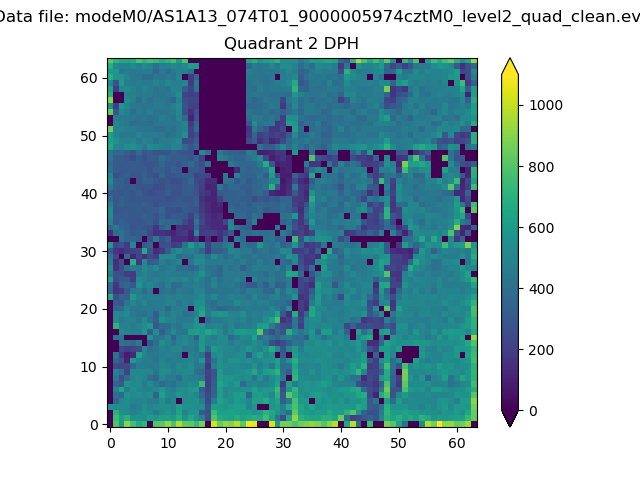 |
Quadrant C |
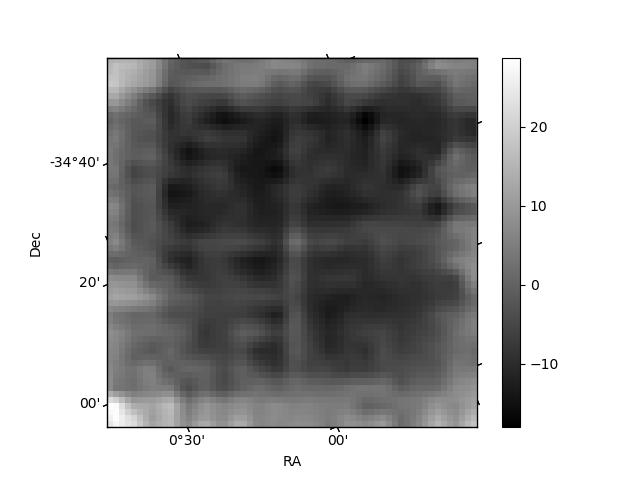
| Plot type | Count rate plots | Images |
|---|---|---|
| Comparison with Poisson distribution Blue bars denote a histogram of data divided into 1 sec bins. Red curve is a Poisson curve with rate = median count rate of data. |
 |
 |
| Quadrant-wise count rates Data is divided into 100 sec bins |
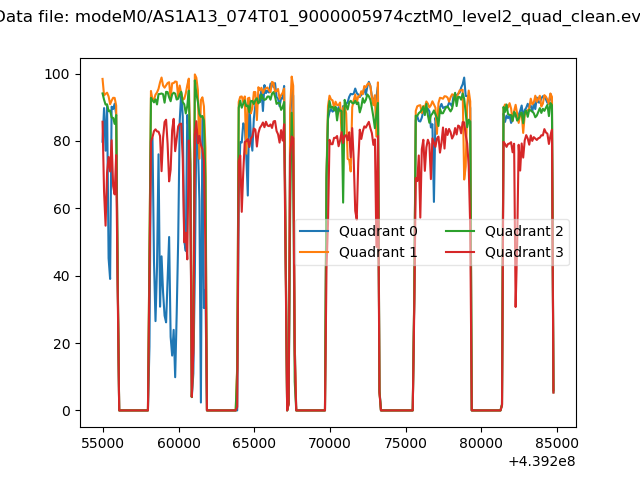 |
|
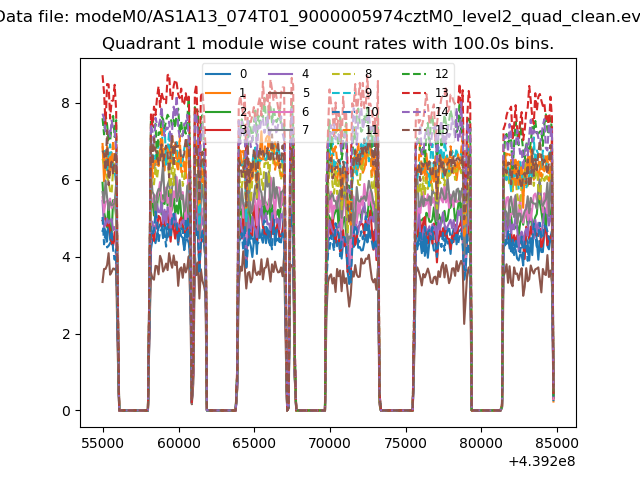
| Module-wise count rates for Quadrant A Data is divided into 100 sec bins |
 |
 |
| Module-wise count rates for Quadrant B Data is divided into 100 sec bins |
 |
 |
| Module-wise count rates for Quadrant C Data is divided into 100 sec bins |
 |
 |
| Module-wise count rates for Quadrant D Data is divided into 100 sec bins |
 |
 |
| Parameter | Plot |
|---|---|
| CZT HV Monitor | 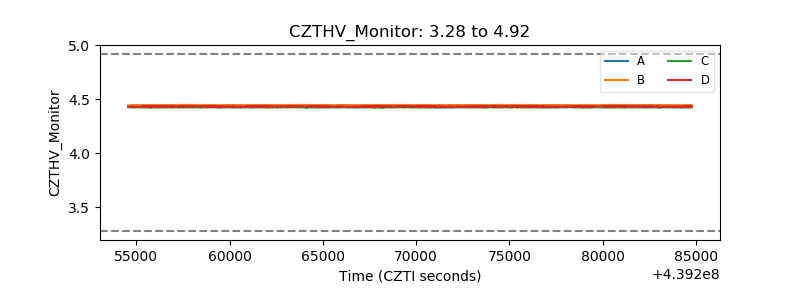 |
| D_VDD | 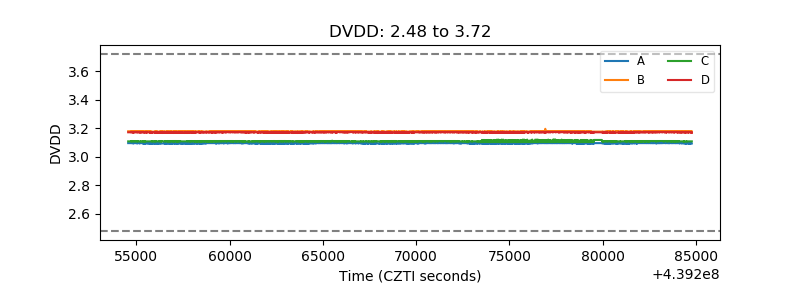 |
| Temperature 1 |  |
| Veto HV Monitor |  |
| Veto LLD | 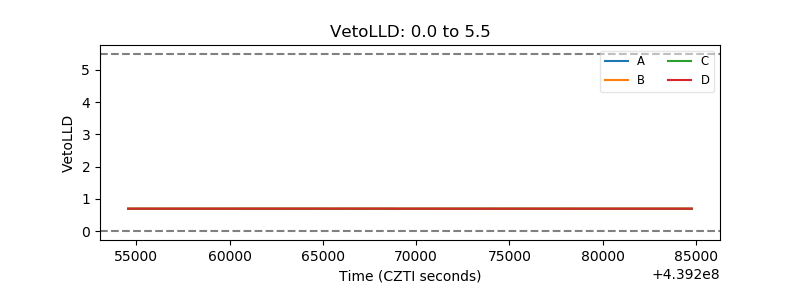 |
| Alpha Counter |  |
| _CPM_Rate | 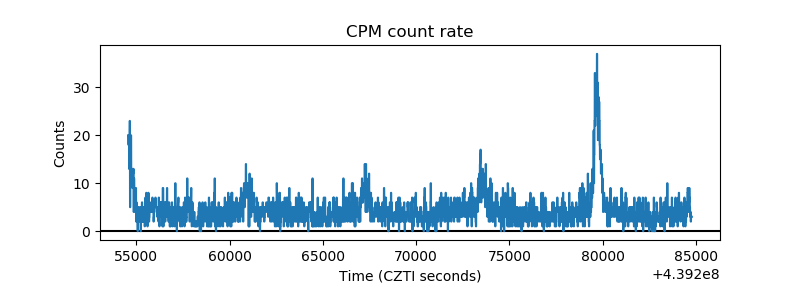 |
| CZT Counter | 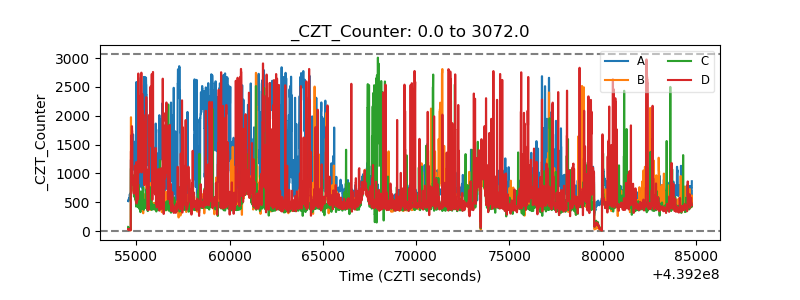 |
| +2.5 Volts monitor | 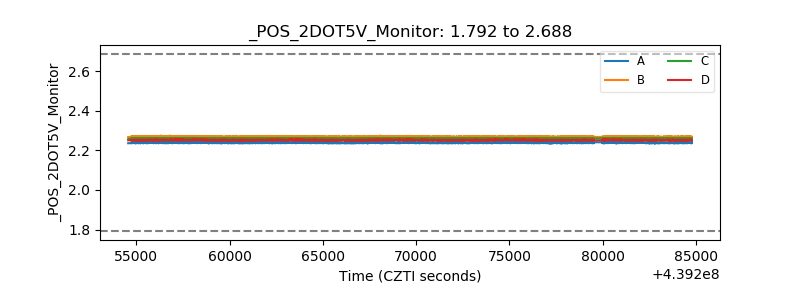 |
| +5 Volts monitor |  |
| _ROLL_ROT |  |
| _Roll_DEC | 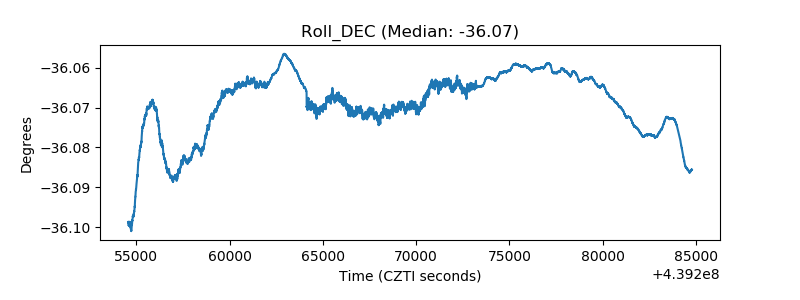 |
| _Roll_RA |  |
| Veto Counter | 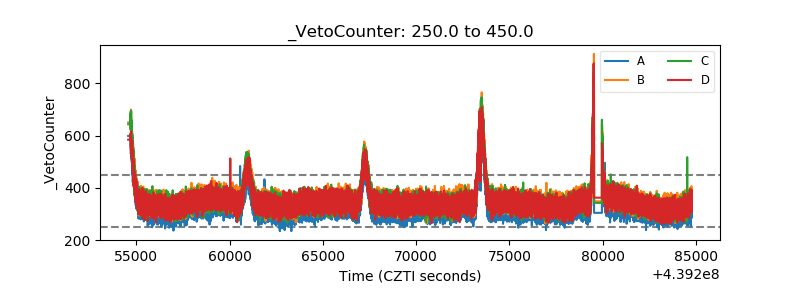 |