| Param | Original file | Final file |
|---|---|---|
| Filename | modeM0/AS1A13_074T03_9000005976cztM0_level2.fits | modeM0/AS1A13_074T03_9000005976cztM0_level2_quad_clean.evt |
| Size (bytes) | 110,088,000 | 101,643,840 |
| Size | 105.0 MB | 96.9 MB |
| Events in quadrant A | 641,134 | 574,623 |
| Events in quadrant B | 631,490 | 583,208 |
| Events in quadrant C | 654,474 | 562,905 |
| Events in quadrant D | 555,168 | 505,477 |
| Mode M0 | |||
|---|---|---|---|
| Quadrant | BADHDUFLAG | Total packets | Discarded packets |
| A | 0 | 40121 | 0 |
| B | 0 | 26756 | 0 |
| C | 0 | 26408 | 0 |
| D | 0 | 32071 | 0 |
| Mode SS | |||
|---|---|---|---|
| Quadrant | BADHDUFLAG | Total packets | Discarded packets |
| A | 0 | 250 | 0 |
| B | 0 | 250 | 0 |
| C | 0 | 250 | 0 |
| D | 0 | 250 | 0 |
| Mode M9 | |||
|---|---|---|---|
| Quadrant | BADHDUFLAG | Total packets | Discarded packets |
| A | 0 | 26 | 0 |
| B | 0 | 26 | 0 |
| C | 0 | 26 | 0 |
| D | 0 | 26 | 0 |
| Quadrant | Total seconds | Saturated seconds | Saturation percentage |
|---|---|---|---|
| A | 12320 | 558 | 4.529221% |
| B | 12320 | 319 | 2.589286% |
| C | 12320 | 247 | 2.004870% |
| D | 12320 | 676 | 5.487013% |
Noise dominated data is calculated using 1-second bins in cleaned event files. If a bin has >2000 counts, and if more than 50% of those come from <1% of pixels, then it is considered to be noise-dominated and hence unusable.
| Quadrant | # 1 sec bins | Bins with >0 counts | Bins with >2000 counts | High rate bins dominated by noise | Noise dominated (total time) | Noise dominated (detector-on time) | Marked lightcurve |
|---|---|---|---|---|---|---|---|
| A | 14795 | 12319 | 0 | 0 | 0.00% | 0.00% |  |
| B | 14795 | 12318 | 0 | 0 | 0.00% | 0.00% | 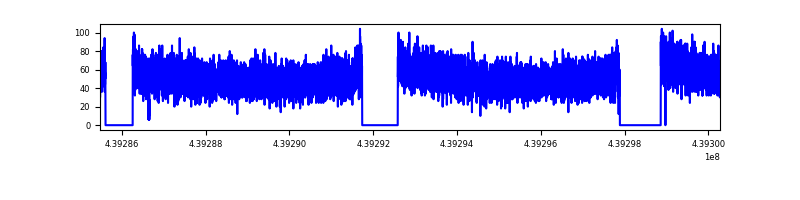 |
| C | 14795 | 12319 | 0 | 0 | 0.00% | 0.00% |  |
| D | 14795 | 12307 | 0 | 0 | 0.00% | 0.00% |  |
Top three noisy pixels from each quadrant. If the there are fewer than three noisy pixels in the level2.evt file, extra rows are filled as -1
| Pixel properties | Quadrant properties | ||||||
|---|---|---|---|---|---|---|---|
| Quadrant | DetID | PixID | Counts | Sigma | Mean | Median | Sigma |
| A | 15 | 236 | 499 | 7.75 | 166 | 156 | 44.2 |
| A | 7 | 110 | 499 | 7.75 | 166 | 156 | 44.2 |
| A | 0 | 30 | 495 | 7.66 | 166 | 156 | 44.2 |
| B | 2 | 9 | 608 | 12.36 | 166 | 157 | 36.5 |
| B | 2 | 8 | 491 | 9.15 | 166 | 157 | 36.5 |
| B | 3 | 17 | 435 | 7.62 | 166 | 157 | 36.5 |
| C | 3 | 203 | 498 | 7.33 | 173 | 161 | 46.0 |
| C | 3 | 202 | 492 | 7.2 | 173 | 161 | 46.0 |
| C | 1 | 81 | 467 | 6.66 | 173 | 161 | 46.0 |
| D | 6 | 79 | 434 | 6.33 | 159 | 145 | 45.6 |
| D | 3 | 14 | 398 | 5.54 | 159 | 145 | 45.6 |
| D | 10 | 189 | 397 | 5.52 | 159 | 145 | 45.6 |
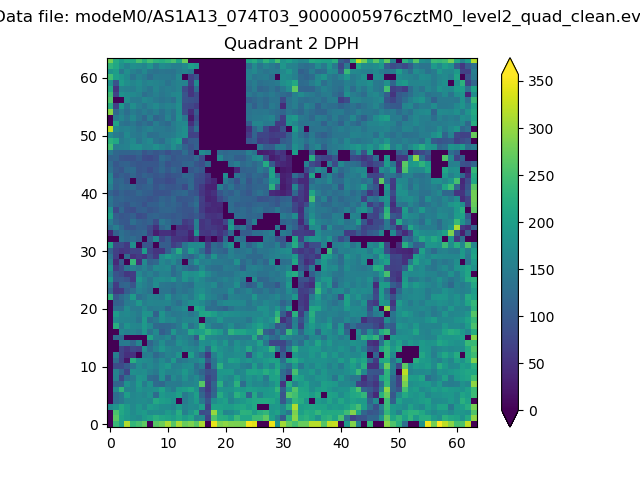
Histogram calculated using DETX and DETY for each event in the final _common_clean file
| Quadrant A | 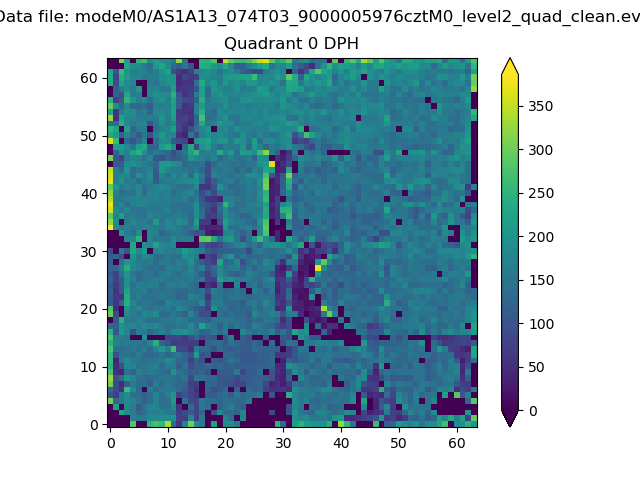 |
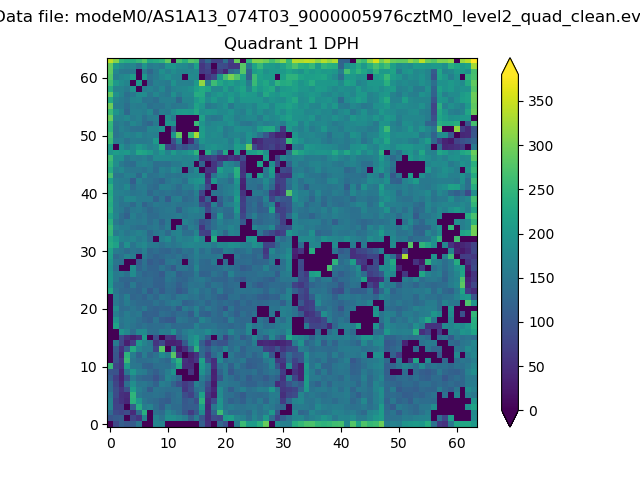 |
Quadrant B |
|---|---|---|---|
| Quadrant D | 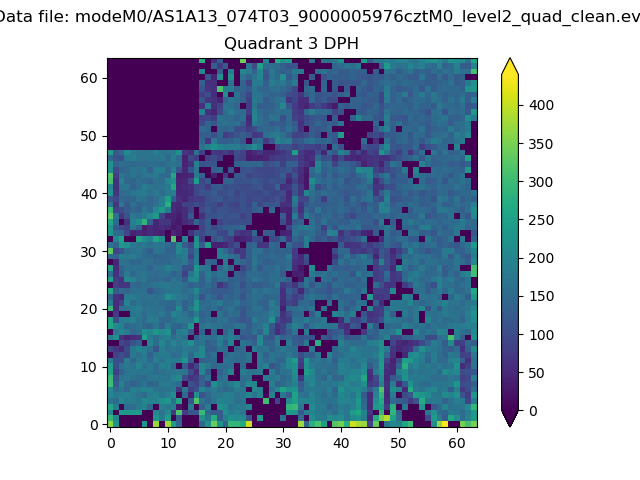 |
 |
Quadrant C |
| Plot type | Count rate plots | Images |
|---|---|---|
| Comparison with Poisson distribution Blue bars denote a histogram of data divided into 1 sec bins. Red curve is a Poisson curve with rate = median count rate of data. |
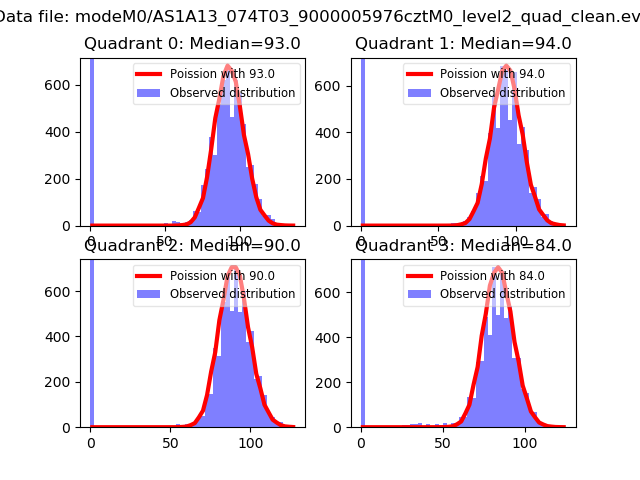 |
 |
| Quadrant-wise count rates Data is divided into 100 sec bins |
 |
|
| Module-wise count rates for Quadrant A Data is divided into 100 sec bins |
 |
 |
| Module-wise count rates for Quadrant B Data is divided into 100 sec bins |
 |
 |
| Module-wise count rates for Quadrant C Data is divided into 100 sec bins |
 |
 |
| Module-wise count rates for Quadrant D Data is divided into 100 sec bins |
 |
 |
| Parameter | Plot |
|---|---|
| CZT HV Monitor | 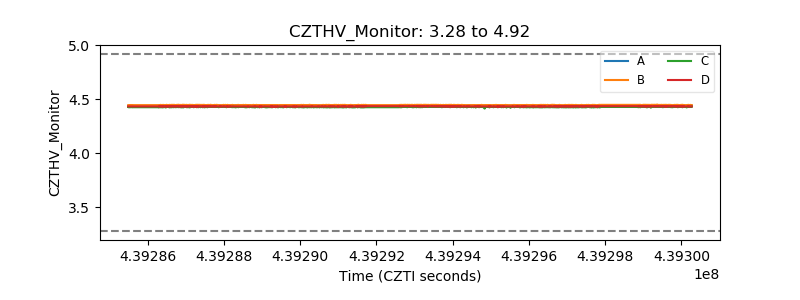 |
| D_VDD |  |
| Temperature 1 |  |
| Veto HV Monitor | 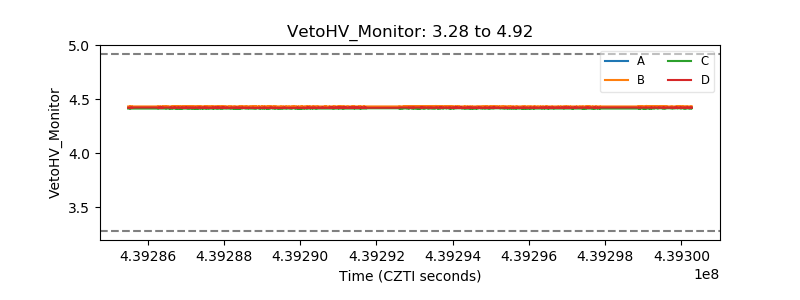 |
| Veto LLD |  |
| Alpha Counter | 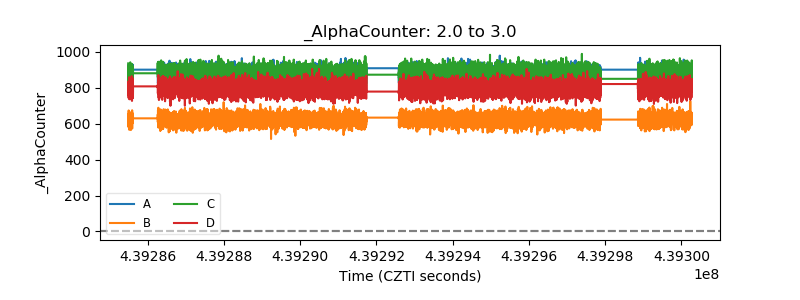 |
| _CPM_Rate | 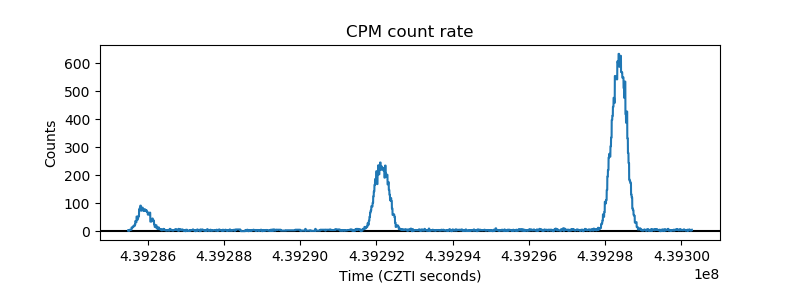 |
| CZT Counter | 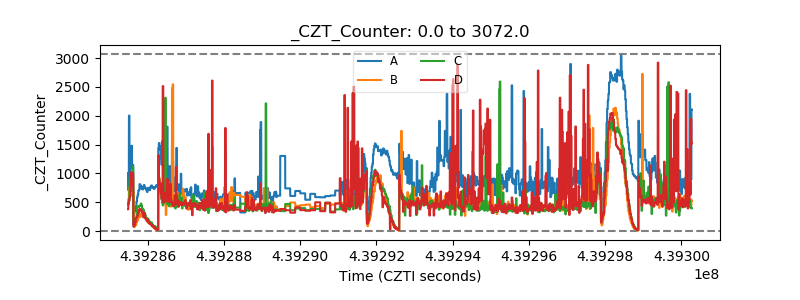 |
| +2.5 Volts monitor |  |
| +5 Volts monitor | 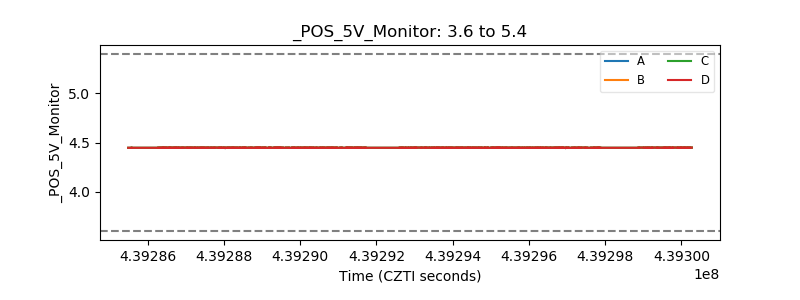 |
| _ROLL_ROT |  |
| _Roll_DEC |  |
| _Roll_RA |  |
| Veto Counter |  |