| Param | Original file | Final file |
|---|---|---|
| Filename | modeM0/AS1A13_059T01_9000005990cztM0_level2.fits | modeM0/AS1A13_059T01_9000005990cztM0_level2_quad_clean.evt |
| Size (bytes) | 553,219,200 | 569,972,160 |
| Size | 527.6 MB | 543.6 MB |
| Events in quadrant A | 3,302,880 | 3,484,079 |
| Events in quadrant B | 3,126,128 | 3,356,722 |
| Events in quadrant C | 3,305,987 | 3,329,973 |
| Events in quadrant D | 2,715,696 | 2,791,087 |
| Mode M0 | |||
|---|---|---|---|
| Quadrant | BADHDUFLAG | Total packets | Discarded packets |
| A | 0 | 180398 | 0 |
| B | 0 | 151483 | 0 |
| C | 0 | 133234 | 0 |
| D | 0 | 189668 | 0 |
| Mode SS | |||
|---|---|---|---|
| Quadrant | BADHDUFLAG | Total packets | Discarded packets |
| A | 0 | 1274 | 0 |
| B | 0 | 1274 | 0 |
| C | 0 | 1274 | 0 |
| D | 0 | 1274 | 0 |
| Mode M9 | |||
|---|---|---|---|
| Quadrant | BADHDUFLAG | Total packets | Discarded packets |
| A | 0 | 69 | 0 |
| B | 0 | 69 | 0 |
| C | 0 | 69 | 0 |
| D | 0 | 69 | 0 |
| Quadrant | Total seconds | Saturated seconds | Saturation percentage |
|---|---|---|---|
| A | 62680 | 1285 | 2.050096% |
| B | 62678 | 2964 | 4.728932% |
| C | 62683 | 769 | 1.226808% |
| D | 62687 | 5680 | 9.060890% |
Noise dominated data is calculated using 1-second bins in cleaned event files. If a bin has >2000 counts, and if more than 50% of those come from <1% of pixels, then it is considered to be noise-dominated and hence unusable.
| Quadrant | # 1 sec bins | Bins with >0 counts | Bins with >2000 counts | High rate bins dominated by noise | Noise dominated (total time) | Noise dominated (detector-on time) | Marked lightcurve |
|---|---|---|---|---|---|---|---|
| A | 69893 | 62685 | 0 | 0 | 0.00% | 0.00% |  |
| B | 69893 | 62615 | 0 | 0 | 0.00% | 0.00% |  |
| C | 69893 | 62646 | 0 | 0 | 0.00% | 0.00% |  |
| D | 69893 | 62596 | 0 | 0 | 0.00% | 0.00% | 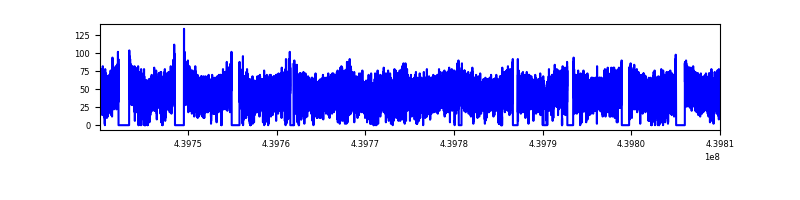 |
Top three noisy pixels from each quadrant. If the there are fewer than three noisy pixels in the level2.evt file, extra rows are filled as -1
| Pixel properties | Quadrant properties | ||||||
|---|---|---|---|---|---|---|---|
| Quadrant | DetID | PixID | Counts | Sigma | Mean | Median | Sigma |
| A | 7 | 110 | 2686 | 8.6 | 860 | 801 | 219.1 |
| A | 15 | 236 | 2610 | 8.26 | 860 | 801 | 219.1 |
| A | 7 | 109 | 2591 | 8.17 | 860 | 801 | 219.1 |
| B | 2 | 9 | 2920 | 12.68 | 827 | 784 | 168.4 |
| B | 3 | 17 | 2334 | 9.2 | 827 | 784 | 168.4 |
| B | 2 | 8 | 2267 | 8.81 | 827 | 784 | 168.4 |
| C | 1 | 81 | 2552 | 7.69 | 872 | 808 | 226.7 |
| C | 3 | 202 | 2528 | 7.59 | 872 | 808 | 226.7 |
| C | 1 | 80 | 2494 | 7.44 | 872 | 808 | 226.7 |
| D | 10 | 189 | 2000 | 5.8 | 783 | 709 | 222.6 |
| D | 3 | 14 | 1995 | 5.78 | 783 | 709 | 222.6 |
| D | 12 | 6 | 1945 | 5.55 | 783 | 709 | 222.6 |
Histogram calculated using DETX and DETY for each event in the final _common_clean file
| Quadrant A |  |
 |
Quadrant B |
|---|---|---|---|
| Quadrant D | 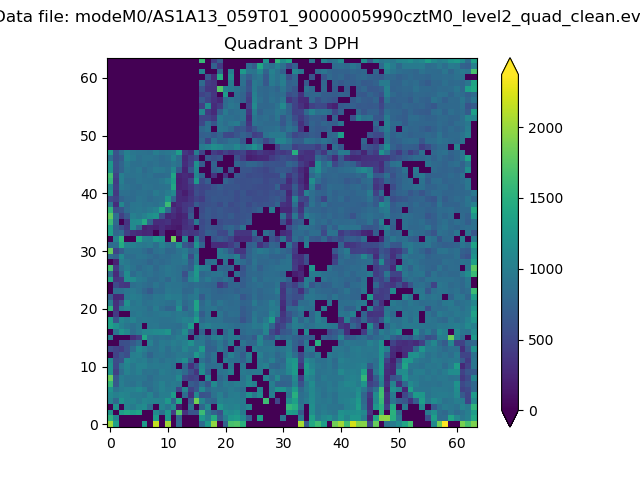 |
 |
Quadrant C |
| Plot type | Count rate plots | Images |
|---|---|---|
| Comparison with Poisson distribution Blue bars denote a histogram of data divided into 1 sec bins. Red curve is a Poisson curve with rate = median count rate of data. |
 |
 |
| Quadrant-wise count rates Data is divided into 100 sec bins |
 |
|
| Module-wise count rates for Quadrant A Data is divided into 100 sec bins |
 |
 |
| Module-wise count rates for Quadrant B Data is divided into 100 sec bins |
 |
 |
| Module-wise count rates for Quadrant C Data is divided into 100 sec bins |
 |
 |
| Module-wise count rates for Quadrant D Data is divided into 100 sec bins |
 |
 |
| Parameter | Plot |
|---|---|
| CZT HV Monitor |  |
| D_VDD |  |
| Temperature 1 |  |
| Veto HV Monitor |  |
| Veto LLD |  |
| Alpha Counter |  |
| _CPM_Rate |  |
| CZT Counter |  |
| +2.5 Volts monitor |  |
| +5 Volts monitor |  |
| _ROLL_ROT | 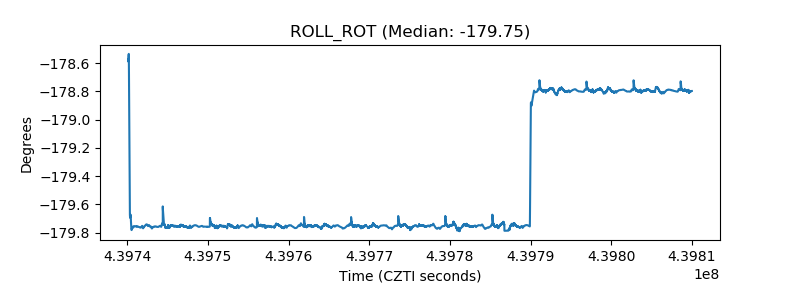 |
| _Roll_DEC |  |
| _Roll_RA |  |
| Veto Counter |  |