| Param | Original file | Final file |
|---|---|---|
| Filename | modeM0/AS1A13_004T09_9000005992cztM0_level2.fits | modeM0/AS1A13_004T09_9000005992cztM0_level2_quad_clean.evt |
| Size (bytes) | 726,082,560 | 787,654,080 |
| Size | 692.4 MB | 751.2 MB |
| Events in quadrant A | 4,358,442 | 4,837,195 |
| Events in quadrant B | 4,172,776 | 4,809,686 |
| Events in quadrant C | 4,323,074 | 4,636,875 |
| Events in quadrant D | 3,661,918 | 4,101,600 |
| Mode SS | |||
|---|---|---|---|
| Quadrant | BADHDUFLAG | Total packets | Discarded packets |
| A | 0 | 1622 | 0 |
| B | 0 | 1624 | 0 |
| C | 0 | 1624 | 0 |
| D | 0 | 1624 | 0 |
| Mode M9 | |||
|---|---|---|---|
| Quadrant | BADHDUFLAG | Total packets | Discarded packets |
| A | 0 | 128 | 0 |
| B | 0 | 128 | 0 |
| C | 0 | 128 | 0 |
| D | 0 | 128 | 0 |
| Mode M0 | |||
|---|---|---|---|
| Quadrant | BADHDUFLAG | Total packets | Discarded packets |
| A | 0 | 237816 | 0 |
| B | 0 | 181168 | 0 |
| C | 0 | 168537 | 0 |
| D | 0 | 218569 | 0 |
| Quadrant | Total seconds | Saturated seconds | Saturation percentage |
|---|---|---|---|
| A | 79772 | 2505 | 3.140200% |
| B | 79778 | 2352 | 2.948181% |
| C | 79775 | 978 | 1.225948% |
| D | 79764 | 4560 | 5.716865% |
Noise dominated data is calculated using 1-second bins in cleaned event files. If a bin has >2000 counts, and if more than 50% of those come from <1% of pixels, then it is considered to be noise-dominated and hence unusable.
| Quadrant | # 1 sec bins | Bins with >0 counts | Bins with >2000 counts | High rate bins dominated by noise | Noise dominated (total time) | Noise dominated (detector-on time) | Marked lightcurve |
|---|---|---|---|---|---|---|---|
| A | 104452 | 79700 | 0 | 0 | 0.00% | 0.00% |  |
| B | 104452 | 79757 | 0 | 0 | 0.00% | 0.00% | 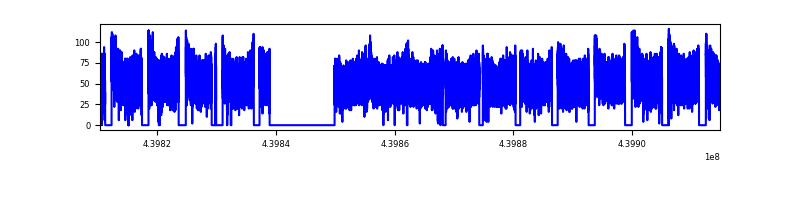 |
| C | 104452 | 79779 | 0 | 0 | 0.00% | 0.00% | 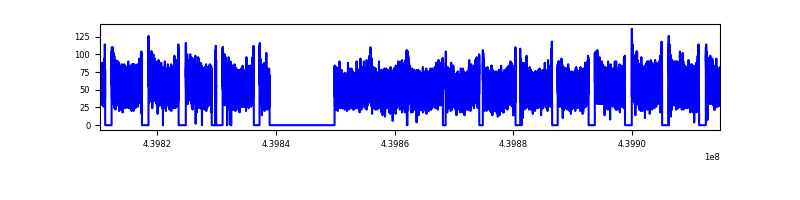 |
| D | 104452 | 79696 | 0 | 0 | 0.00% | 0.00% |  |
Top three noisy pixels from each quadrant. If the there are fewer than three noisy pixels in the level2.evt file, extra rows are filled as -1
| Pixel properties | Quadrant properties | ||||||
|---|---|---|---|---|---|---|---|
| Quadrant | DetID | PixID | Counts | Sigma | Mean | Median | Sigma |
| A | 7 | 110 | 3641 | 9.03 | 1134 | 1059 | 286.1 |
| A | 0 | 29 | 3369 | 8.07 | 1134 | 1059 | 286.1 |
| A | 15 | 236 | 3360 | 8.04 | 1134 | 1059 | 286.1 |
| B | 2 | 9 | 3787 | 12.61 | 1104 | 1050 | 217.1 |
| B | 2 | 8 | 3023 | 9.09 | 1104 | 1050 | 217.1 |
| B | 3 | 17 | 2943 | 8.72 | 1104 | 1050 | 217.1 |
| C | 3 | 202 | 3380 | 7.84 | 1144 | 1062 | 295.8 |
| C | 3 | 203 | 3295 | 7.55 | 1144 | 1062 | 295.8 |
| C | 1 | 81 | 3232 | 7.34 | 1144 | 1062 | 295.8 |
| D | 6 | 38 | 2687 | 5.94 | 1053 | 959 | 290.9 |
| D | 7 | 3 | 2657 | 5.84 | 1053 | 959 | 290.9 |
| D | 10 | 113 | 2649 | 5.81 | 1053 | 959 | 290.9 |
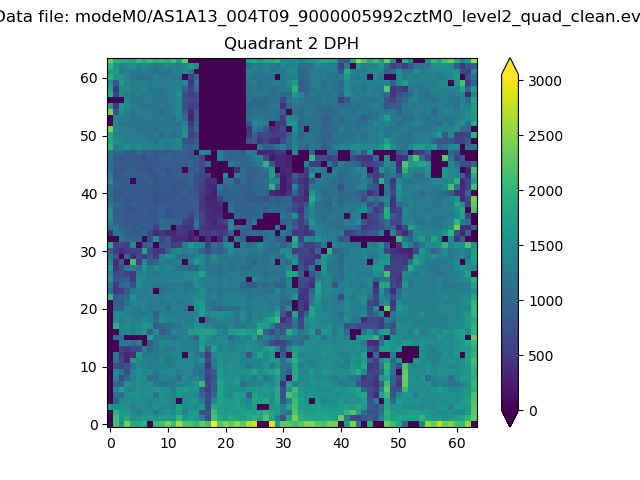
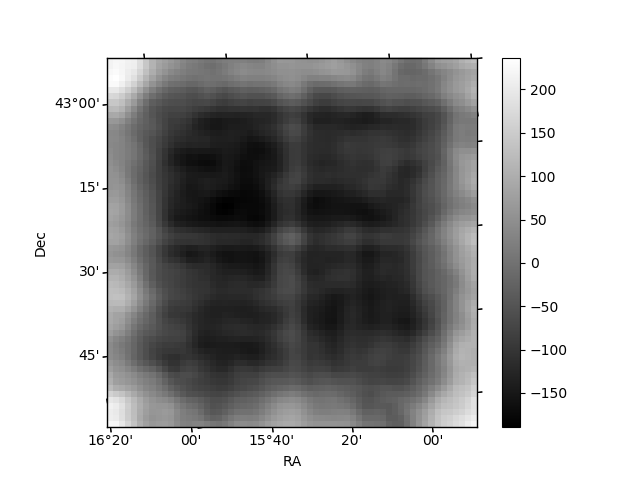
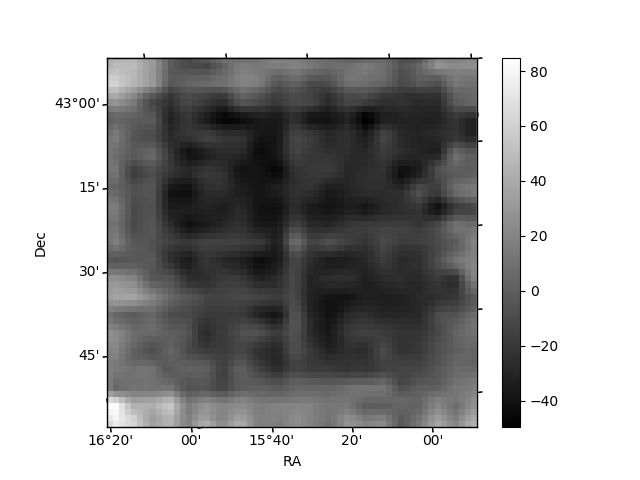
Histogram calculated using DETX and DETY for each event in the final _common_clean file
| Quadrant A | 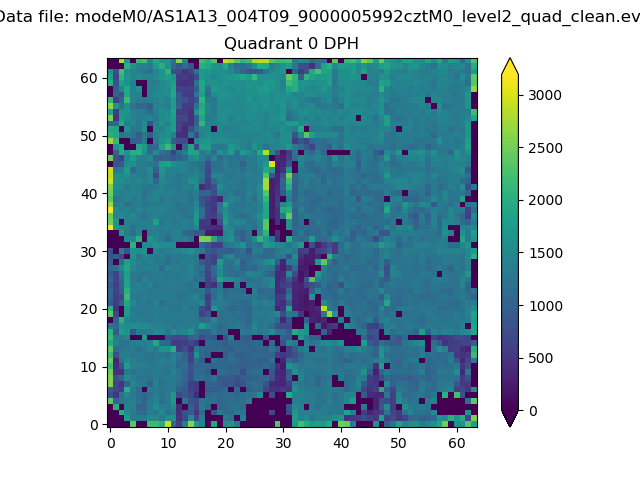 |
 |
Quadrant B |
|---|---|---|---|
| Quadrant D |  |
 |
Quadrant C |
| Plot type | Count rate plots | Images |
|---|---|---|
| Comparison with Poisson distribution Blue bars denote a histogram of data divided into 1 sec bins. Red curve is a Poisson curve with rate = median count rate of data. |
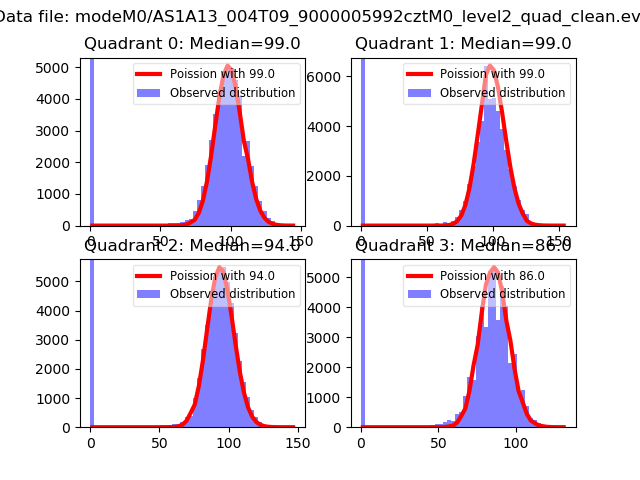 |
 |
| Quadrant-wise count rates Data is divided into 100 sec bins |
 |
|
| Module-wise count rates for Quadrant A Data is divided into 100 sec bins |
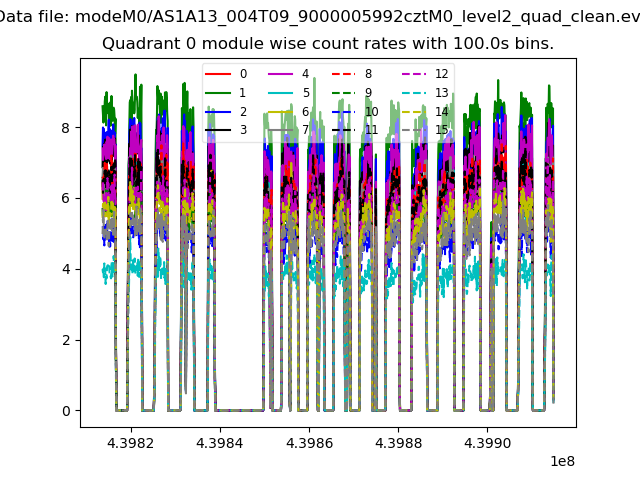 |
 |
| Module-wise count rates for Quadrant B Data is divided into 100 sec bins |
 |
 |
| Module-wise count rates for Quadrant C Data is divided into 100 sec bins |
 |
 |
| Module-wise count rates for Quadrant D Data is divided into 100 sec bins |
 |
 |
| Parameter | Plot |
|---|---|
| CZT HV Monitor |  |
| D_VDD | 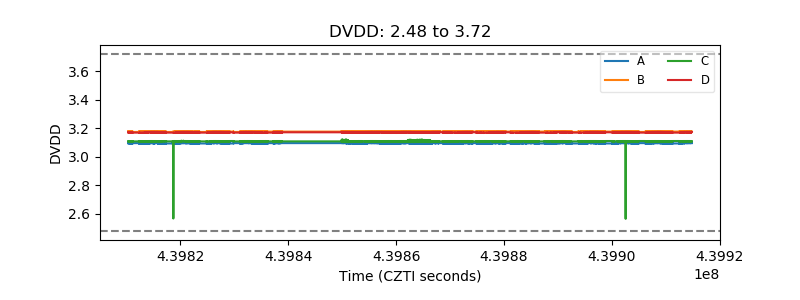 |
| Temperature 1 | 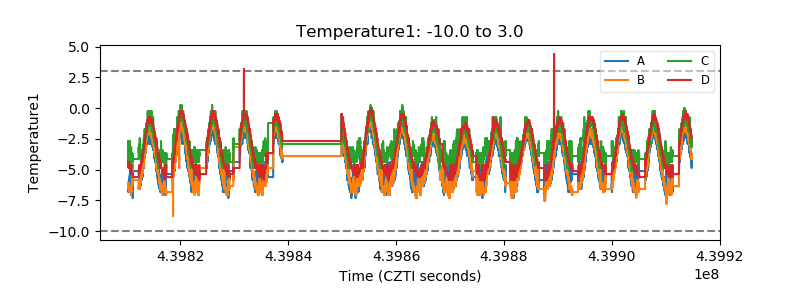 |
| Veto HV Monitor |  |
| Veto LLD |  |
| Alpha Counter | 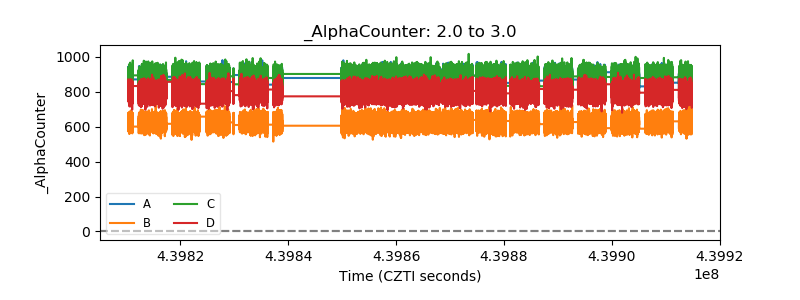 |
| _CPM_Rate | 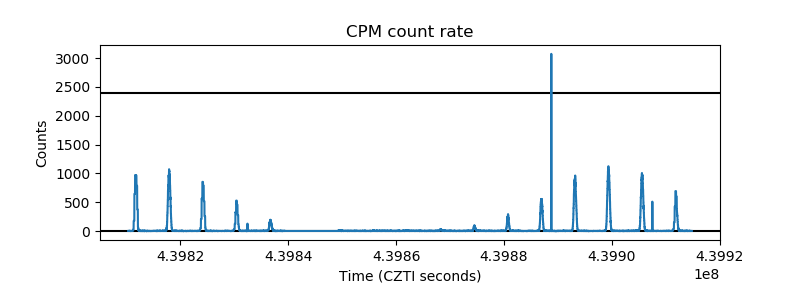 |
| CZT Counter |  |
| +2.5 Volts monitor | 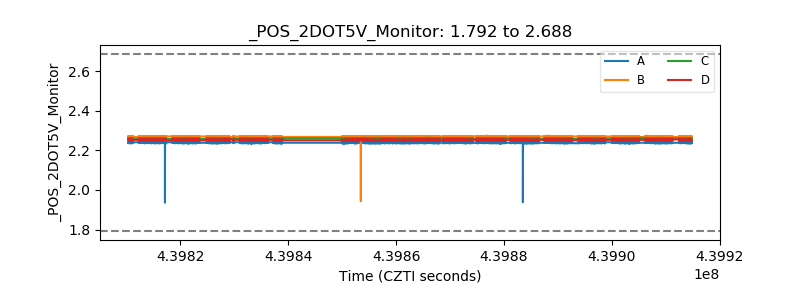 |
| +5 Volts monitor |  |
| _ROLL_ROT |  |
| _Roll_DEC | 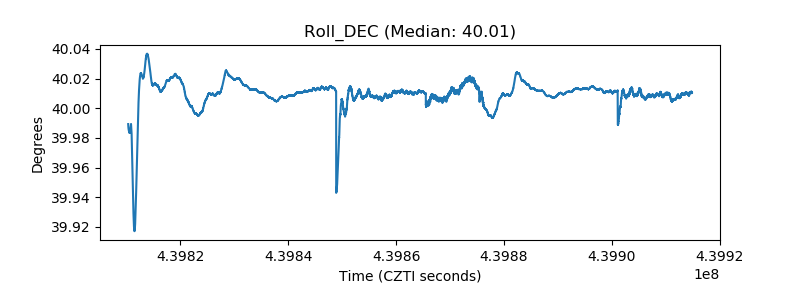 |
| _Roll_RA | 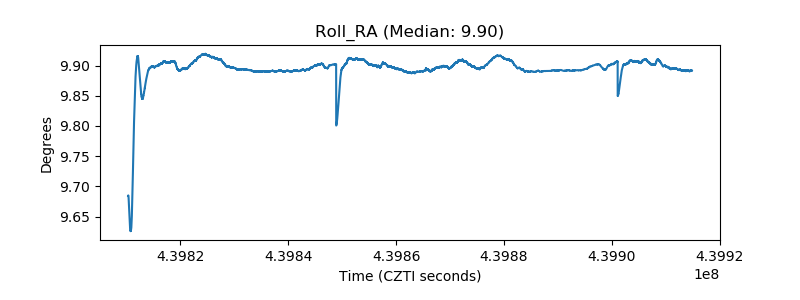 |
| Veto Counter |  |