| Param | Original file | Final file |
|---|---|---|
| Filename | modeM0/AS1A13_008T05_9000005996cztM0_level2.fits | modeM0/AS1A13_008T05_9000005996cztM0_level2_quad_clean.evt |
| Size (bytes) | 881,406,720 | 883,440,000 |
| Size | 840.6 MB | 842.5 MB |
| Events in quadrant A | 5,245,618 | 5,200,250 |
| Events in quadrant B | 5,120,722 | 5,361,025 |
| Events in quadrant C | 5,249,772 | 5,129,713 |
| Events in quadrant D | 4,298,734 | 4,293,113 |
| Mode SS | |||
|---|---|---|---|
| Quadrant | BADHDUFLAG | Total packets | Discarded packets |
| A | 0 | 2014 | 0 |
| B | 0 | 2013 | 0 |
| C | 0 | 2014 | 0 |
| D | 0 | 2014 | 0 |
| Mode M0 | |||
|---|---|---|---|
| Quadrant | BADHDUFLAG | Total packets | Discarded packets |
| A | 0 | 318051 | 0 |
| B | 0 | 221273 | 0 |
| C | 0 | 221601 | 0 |
| D | 0 | 344056 | 0 |
| Mode M9 | |||
|---|---|---|---|
| Quadrant | BADHDUFLAG | Total packets | Discarded packets |
| A | 0 | 129 | 0 |
| B | 0 | 129 | 0 |
| C | 0 | 129 | 0 |
| D | 0 | 129 | 0 |
| Quadrant | Total seconds | Saturated seconds | Saturation percentage |
|---|---|---|---|
| A | 98753 | 4684 | 4.743147% |
| B | 98754 | 2431 | 2.461672% |
| C | 98753 | 2046 | 2.071836% |
| D | 98749 | 11537 | 11.683156% |
Noise dominated data is calculated using 1-second bins in cleaned event files. If a bin has >2000 counts, and if more than 50% of those come from <1% of pixels, then it is considered to be noise-dominated and hence unusable.
| Quadrant | # 1 sec bins | Bins with >0 counts | Bins with >2000 counts | High rate bins dominated by noise | Noise dominated (total time) | Noise dominated (detector-on time) | Marked lightcurve |
|---|---|---|---|---|---|---|---|
| A | 128342 | 98652 | 0 | 0 | 0.00% | 0.00% | 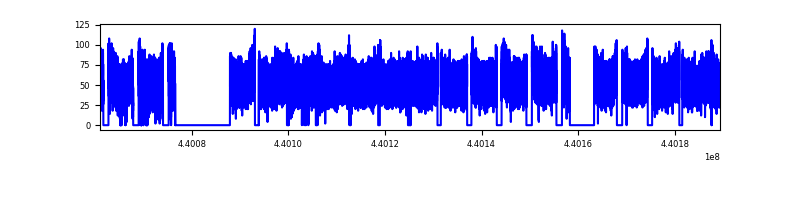 |
| B | 128342 | 98708 | 0 | 0 | 0.00% | 0.00% |  |
| C | 128342 | 98760 | 0 | 0 | 0.00% | 0.00% | 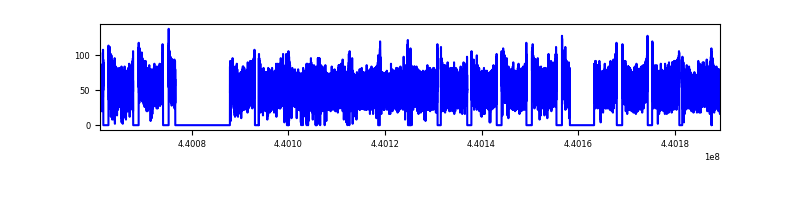 |
| D | 128342 | 98660 | 0 | 0 | 0.00% | 0.00% | 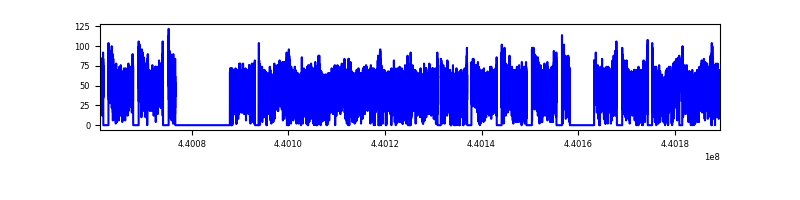 |
Top three noisy pixels from each quadrant. If the there are fewer than three noisy pixels in the level2.evt file, extra rows are filled as -1
| Pixel properties | Quadrant properties | ||||||
|---|---|---|---|---|---|---|---|
| Quadrant | DetID | PixID | Counts | Sigma | Mean | Median | Sigma |
| A | 7 | 110 | 4370 | 8.93 | 1367 | 1274 | 346.7 |
| A | 15 | 236 | 4159 | 8.32 | 1367 | 1274 | 346.7 |
| A | 0 | 29 | 4056 | 8.02 | 1367 | 1274 | 346.7 |
| B | 2 | 9 | 4637 | 12.62 | 1358 | 1292 | 265.0 |
| B | 2 | 8 | 3785 | 9.41 | 1358 | 1292 | 265.0 |
| B | 3 | 17 | 3626 | 8.81 | 1358 | 1292 | 265.0 |
| C | 3 | 202 | 3991 | 7.53 | 1389 | 1290 | 358.6 |
| C | 1 | 81 | 3963 | 7.45 | 1389 | 1290 | 358.6 |
| C | 1 | 80 | 3951 | 7.42 | 1389 | 1290 | 358.6 |
| D | 3 | 14 | 3178 | 5.95 | 1238 | 1120 | 345.7 |
| D | 10 | 189 | 3144 | 5.85 | 1238 | 1120 | 345.7 |
| D | 10 | 113 | 3140 | 5.84 | 1238 | 1120 | 345.7 |
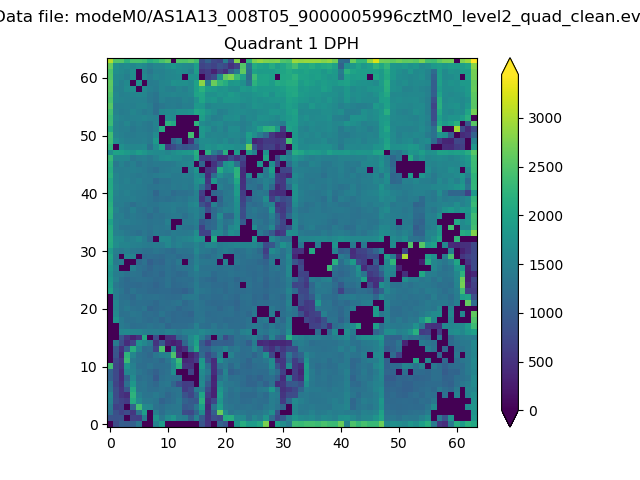
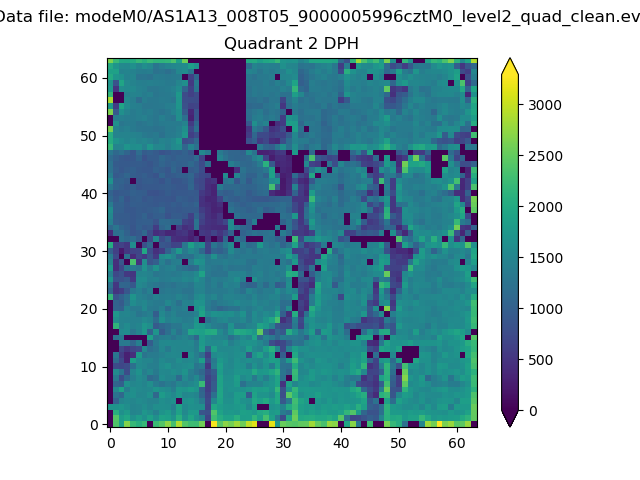
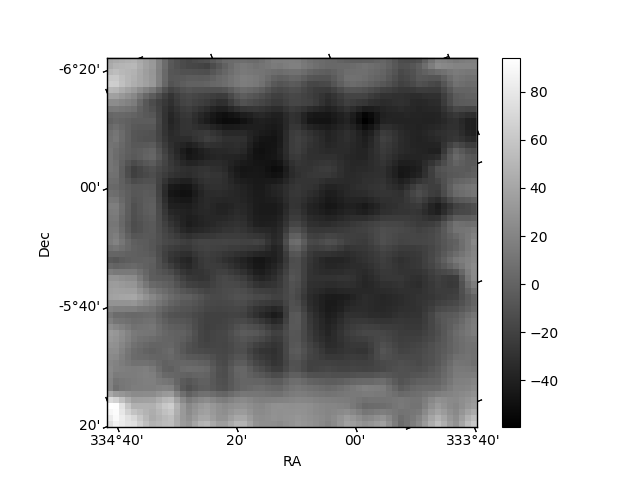
Histogram calculated using DETX and DETY for each event in the final _common_clean file
| Quadrant A | 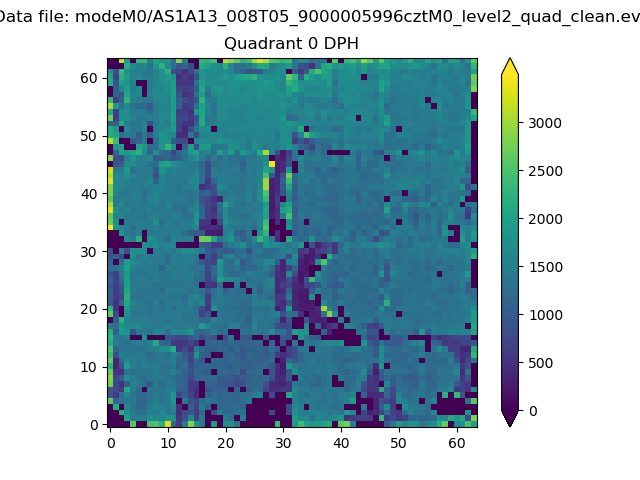 |
 |
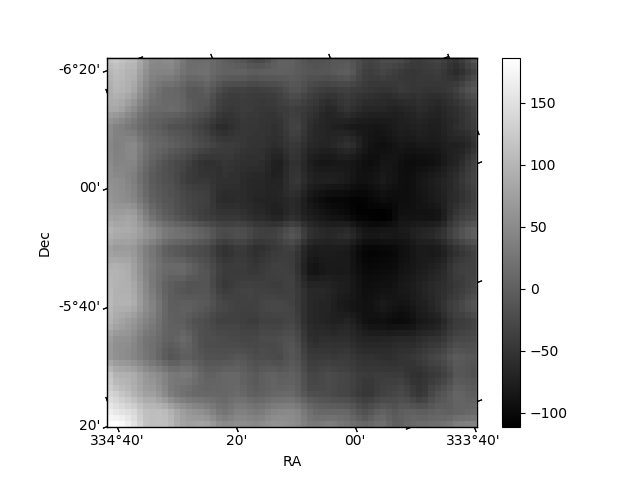
Quadrant B |
|---|---|---|---|
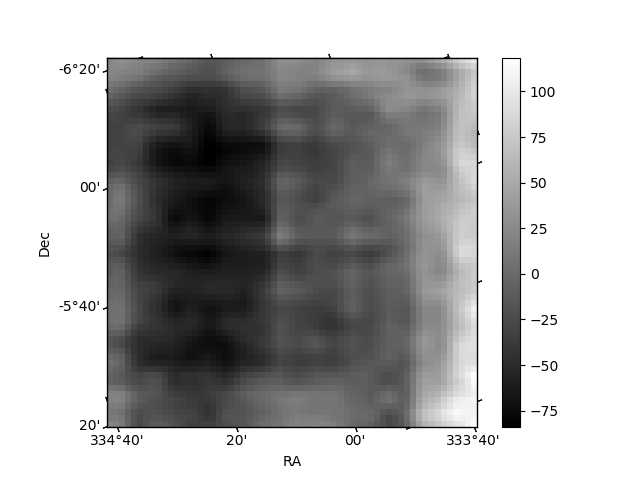
| Quadrant D | 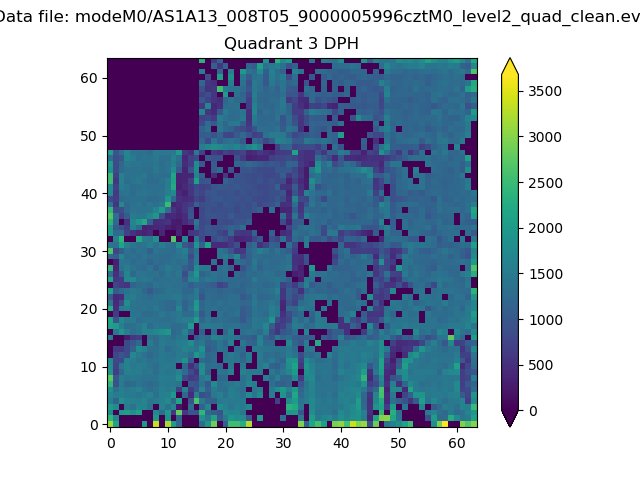 |
 |
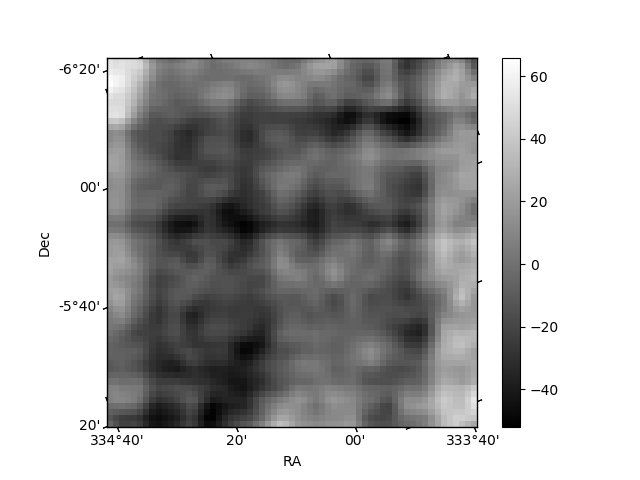
Quadrant C |
| Plot type | Count rate plots | Images |
|---|---|---|
| Comparison with Poisson distribution Blue bars denote a histogram of data divided into 1 sec bins. Red curve is a Poisson curve with rate = median count rate of data. |
 |
 |
| Quadrant-wise count rates Data is divided into 100 sec bins |
 |
|
| Module-wise count rates for Quadrant A Data is divided into 100 sec bins |
 |
 |
| Module-wise count rates for Quadrant B Data is divided into 100 sec bins |
 |
 |
| Module-wise count rates for Quadrant C Data is divided into 100 sec bins |
 |
 |
| Module-wise count rates for Quadrant D Data is divided into 100 sec bins |
 |
 |
| Parameter | Plot |
|---|---|
| CZT HV Monitor |  |
| D_VDD | 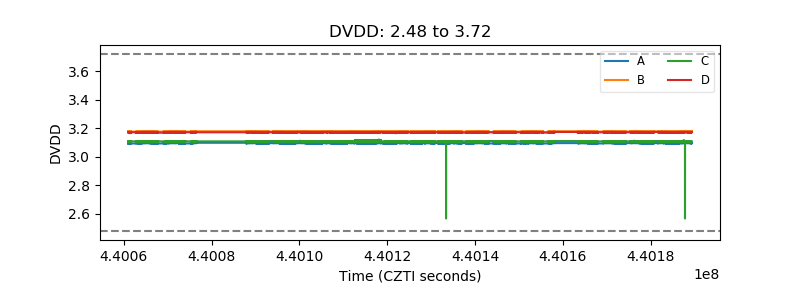 |
| Temperature 1 | 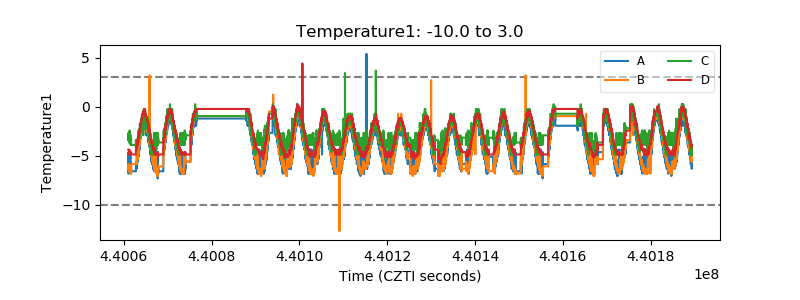 |
| Veto HV Monitor | 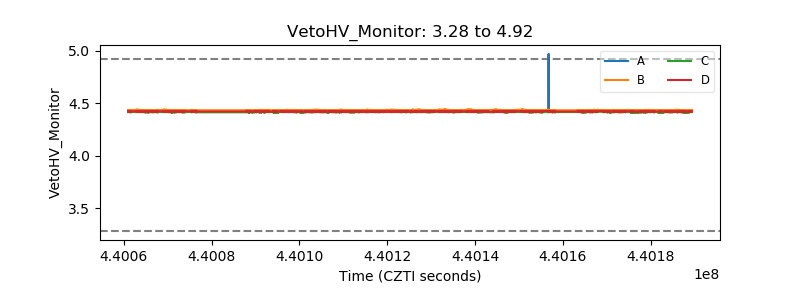 |
| Veto LLD |  |
| Alpha Counter |  |
| _CPM_Rate | 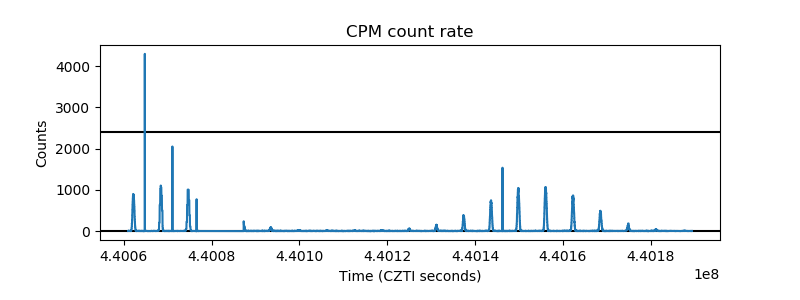 |
| CZT Counter | 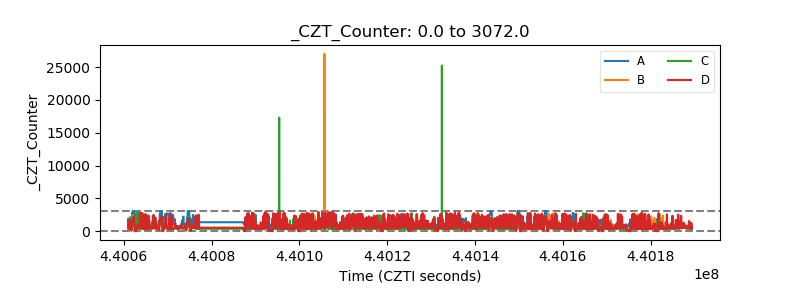 |
| +2.5 Volts monitor |  |
| +5 Volts monitor | 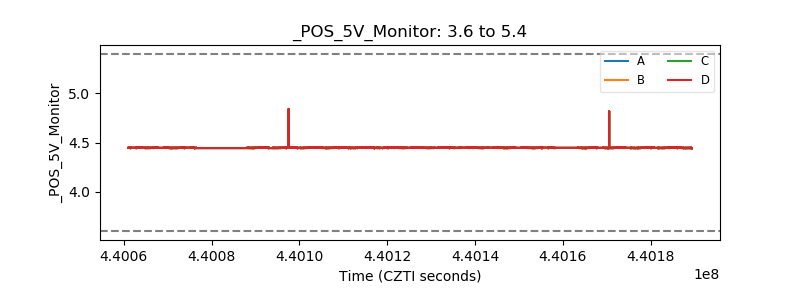 |
| _ROLL_ROT | 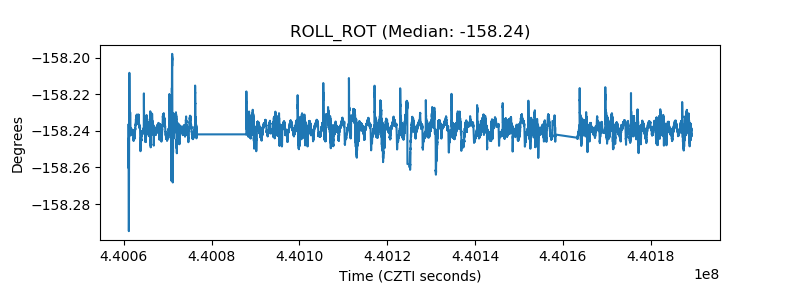 |
| _Roll_DEC | 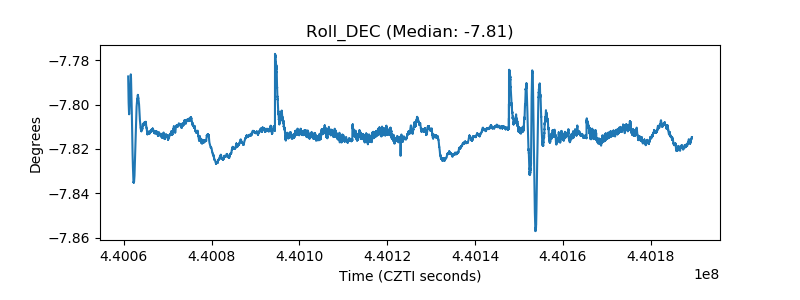 |
| _Roll_RA | 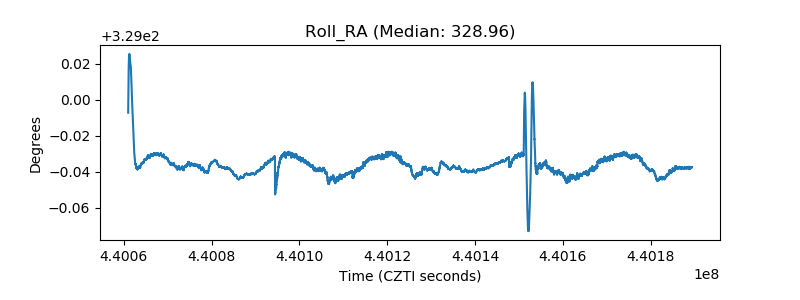 |
| Veto Counter | 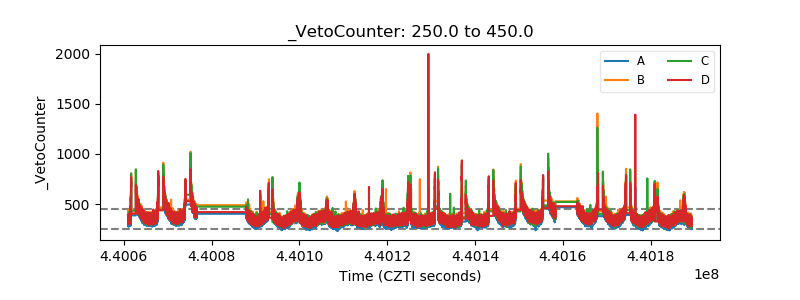 |