| Param | Original file | Final file |
|---|---|---|
| Filename | modeM0/AS1A13_008T08_9000005998cztM0_level2.fits | modeM0/AS1A13_008T08_9000005998cztM0_level2_quad_clean.evt |
| Size (bytes) | 1,191,882,240 | 1,270,549,440 |
| Size | 1.1 GB | 1.2 GB |
| Events in quadrant A | 7,244,716 | 7,867,894 |
| Events in quadrant B | 6,954,914 | 7,912,182 |
| Events in quadrant C | 7,098,064 | 7,535,290 |
| Events in quadrant D | 5,527,956 | 5,909,083 |
| Mode SS | |||
|---|---|---|---|
| Quadrant | BADHDUFLAG | Total packets | Discarded packets |
| A | 0 | 2744 | 0 |
| B | 0 | 2744 | 0 |
| C | 0 | 2744 | 0 |
| D | 0 | 2744 | 0 |
| Mode M0 | |||
|---|---|---|---|
| Quadrant | BADHDUFLAG | Total packets | Discarded packets |
| A | 0 | 406023 | 0 |
| B | 0 | 301327 | 0 |
| C | 0 | 314198 | 0 |
| D | 0 | 527896 | 0 |
| Mode M9 | |||
|---|---|---|---|
| Quadrant | BADHDUFLAG | Total packets | Discarded packets |
| A | 0 | 187 | 0 |
| B | 0 | 187 | 0 |
| C | 0 | 187 | 0 |
| D | 0 | 187 | 0 |
| Quadrant | Total seconds | Saturated seconds | Saturation percentage |
|---|---|---|---|
| A | 135088 | 3308 | 2.448774% |
| B | 135089 | 3050 | 2.257771% |
| C | 135089 | 3911 | 2.895128% |
| D | 135090 | 26302 | 19.469983% |
Noise dominated data is calculated using 1-second bins in cleaned event files. If a bin has >2000 counts, and if more than 50% of those come from <1% of pixels, then it is considered to be noise-dominated and hence unusable.
| Quadrant | # 1 sec bins | Bins with >0 counts | Bins with >2000 counts | High rate bins dominated by noise | Noise dominated (total time) | Noise dominated (detector-on time) | Marked lightcurve |
|---|---|---|---|---|---|---|---|
| A | 158204 | 135077 | 0 | 0 | 0.00% | 0.00% |  |
| B | 158205 | 135078 | 0 | 0 | 0.00% | 0.00% |  |
| C | 158205 | 135074 | 0 | 0 | 0.00% | 0.00% | 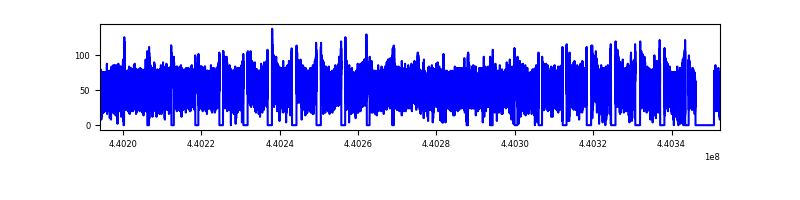 |
| D | 158205 | 134135 | 0 | 0 | 0.00% | 0.00% |  |
Top three noisy pixels from each quadrant. If the there are fewer than three noisy pixels in the level2.evt file, extra rows are filled as -1
| Pixel properties | Quadrant properties | ||||||
|---|---|---|---|---|---|---|---|
| Quadrant | DetID | PixID | Counts | Sigma | Mean | Median | Sigma |
| A | 7 | 110 | 6027 | 8.94 | 1885 | 1757 | 477.9 |
| A | 0 | 29 | 5689 | 8.23 | 1885 | 1757 | 477.9 |
| A | 15 | 236 | 5680 | 8.21 | 1885 | 1757 | 477.9 |
| B | 2 | 9 | 6501 | 13.03 | 1846 | 1753 | 364.5 |
| B | 2 | 8 | 5109 | 9.21 | 1846 | 1753 | 364.5 |
| B | 3 | 17 | 4927 | 8.71 | 1846 | 1753 | 364.5 |
| C | 3 | 202 | 5569 | 7.9 | 1879 | 1742 | 484.5 |
| C | 3 | 203 | 5317 | 7.38 | 1879 | 1742 | 484.5 |
| C | 1 | 81 | 5249 | 7.24 | 1879 | 1742 | 484.5 |
| D | 10 | 189 | 4086 | 5.91 | 1591 | 1437 | 448.3 |
| D | 3 | 14 | 4063 | 5.86 | 1591 | 1437 | 448.3 |
| D | 7 | 3 | 3966 | 5.64 | 1591 | 1437 | 448.3 |
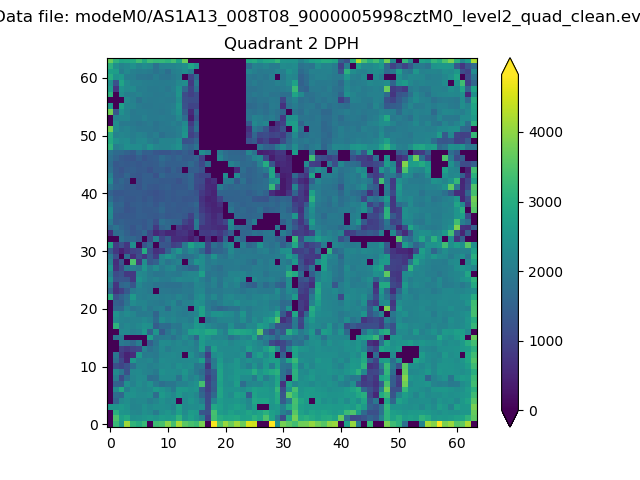
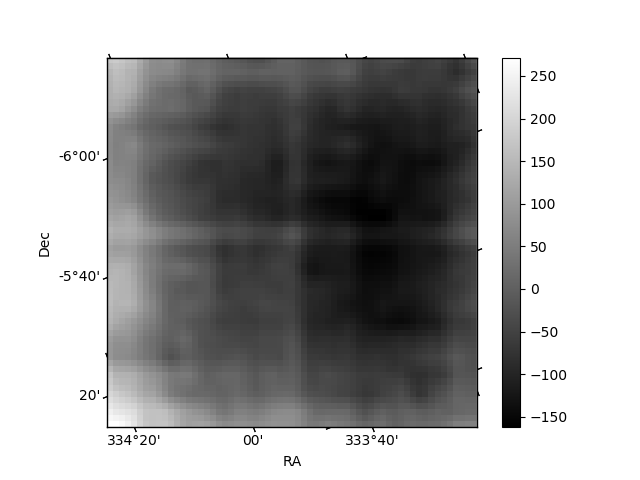
Histogram calculated using DETX and DETY for each event in the final _common_clean file
| Quadrant A |  |
 |
Quadrant B |
|---|---|---|---|
| Quadrant D | 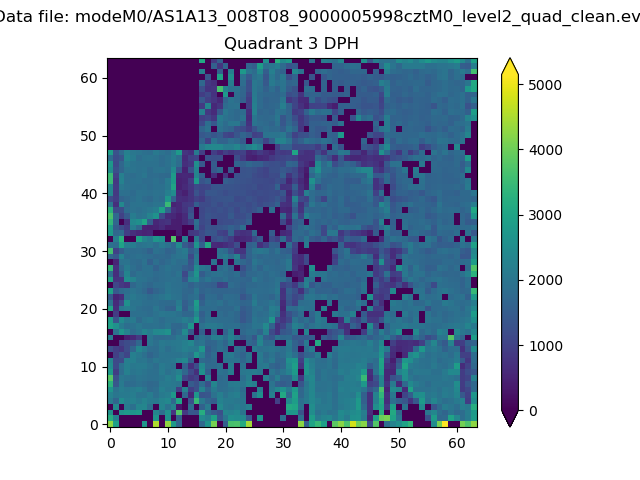 |
 |
Quadrant C |
| Plot type | Count rate plots | Images |
|---|---|---|
| Comparison with Poisson distribution Blue bars denote a histogram of data divided into 1 sec bins. Red curve is a Poisson curve with rate = median count rate of data. |
 |
 |
| Quadrant-wise count rates Data is divided into 100 sec bins |
 |
|
| Module-wise count rates for Quadrant A Data is divided into 100 sec bins |
 |
 |
| Module-wise count rates for Quadrant B Data is divided into 100 sec bins |
 |
 |
| Module-wise count rates for Quadrant C Data is divided into 100 sec bins |
 |
 |
| Module-wise count rates for Quadrant D Data is divided into 100 sec bins |
 |
 |
| Parameter | Plot |
|---|---|
| CZT HV Monitor |  |
| D_VDD |  |
| Temperature 1 |  |
| Veto HV Monitor |  |
| Veto LLD |  |
| Alpha Counter |  |
| _CPM_Rate |  |
| CZT Counter |  |
| +2.5 Volts monitor |  |
| +5 Volts monitor |  |
| _ROLL_ROT |  |
| _Roll_DEC |  |
| _Roll_RA |  |
| Veto Counter |  |