| Param | Original file | Final file |
|---|---|---|
| Filename | modeM0/AS1A13_009T03_9000006006cztM0_level2.fits | modeM0/AS1A13_009T03_9000006006cztM0_level2_quad_clean.evt |
| Size (bytes) | 1,638,083,520 | 1,518,937,920 |
| Size | 1.5 GB | 1.4 GB |
| Events in quadrant A | 9,619,796 | 8,634,321 |
| Events in quadrant B | 9,394,300 | 8,739,292 |
| Events in quadrant C | 9,843,852 | 8,628,196 |
| Events in quadrant D | 8,220,884 | 7,486,094 |
| Mode SS | |||
|---|---|---|---|
| Quadrant | BADHDUFLAG | Total packets | Discarded packets |
| A | 0 | 3710 | 0 |
| B | 0 | 3710 | 0 |
| C | 0 | 3710 | 0 |
| D | 0 | 3710 | 0 |
| Mode M9 | |||
|---|---|---|---|
| Quadrant | BADHDUFLAG | Total packets | Discarded packets |
| A | 0 | 270 | 0 |
| B | 0 | 272 | 0 |
| C | 0 | 272 | 0 |
| D | 0 | 272 | 0 |
| Mode M0 | |||
|---|---|---|---|
| Quadrant | BADHDUFLAG | Total packets | Discarded packets |
| A | 0 | 620575 | 0 |
| B | 0 | 465482 | 0 |
| C | 0 | 424744 | 0 |
| D | 0 | 543322 | 0 |
| Quadrant | Total seconds | Saturated seconds | Saturation percentage |
|---|---|---|---|
| A | 182636 | 12687 | 6.946604% |
| B | 182639 | 13340 | 7.304026% |
| C | 182636 | 4848 | 2.654460% |
| D | 182635 | 14190 | 7.769595% |
Noise dominated data is calculated using 1-second bins in cleaned event files. If a bin has >2000 counts, and if more than 50% of those come from <1% of pixels, then it is considered to be noise-dominated and hence unusable.
| Quadrant | # 1 sec bins | Bins with >0 counts | Bins with >2000 counts | High rate bins dominated by noise | Noise dominated (total time) | Noise dominated (detector-on time) | Marked lightcurve |
|---|---|---|---|---|---|---|---|
| A | 223230 | 182334 | 0 | 0 | 0.00% | 0.00% |  |
| B | 223230 | 182196 | 0 | 0 | 0.00% | 0.00% |  |
| C | 223230 | 182519 | 0 | 0 | 0.00% | 0.00% | 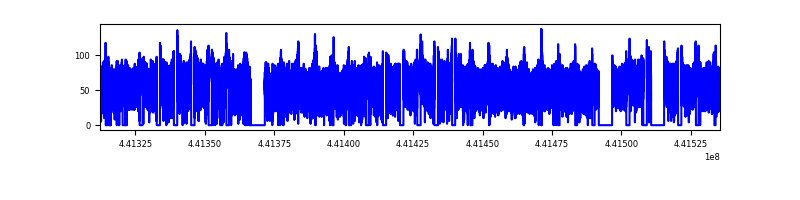 |
| D | 223229 | 182249 | 0 | 0 | 0.00% | 0.00% |  |
Top three noisy pixels from each quadrant. If the there are fewer than three noisy pixels in the level2.evt file, extra rows are filled as -1
| Pixel properties | Quadrant properties | ||||||
|---|---|---|---|---|---|---|---|
| Quadrant | DetID | PixID | Counts | Sigma | Mean | Median | Sigma |
| A | 7 | 110 | 7827 | 8.66 | 2510 | 2345 | 633.2 |
| A | 0 | 29 | 7633 | 8.35 | 2510 | 2345 | 633.2 |
| A | 15 | 236 | 7398 | 7.98 | 2510 | 2345 | 633.2 |
| B | 2 | 9 | 8577 | 12.8 | 2478 | 2354 | 486.2 |
| B | 2 | 8 | 6963 | 9.48 | 2478 | 2354 | 486.2 |
| B | 3 | 17 | 6866 | 9.28 | 2478 | 2354 | 486.2 |
| C | 1 | 81 | 7474 | 7.5 | 2606 | 2423 | 673.6 |
| C | 3 | 202 | 7402 | 7.39 | 2606 | 2423 | 673.6 |
| C | 1 | 80 | 7298 | 7.24 | 2606 | 2423 | 673.6 |
| D | 10 | 189 | 6123 | 6.1 | 2362 | 2141 | 653.1 |
| D | 7 | 3 | 5982 | 5.88 | 2362 | 2141 | 653.1 |
| D | 6 | 79 | 5946 | 5.83 | 2362 | 2141 | 653.1 |
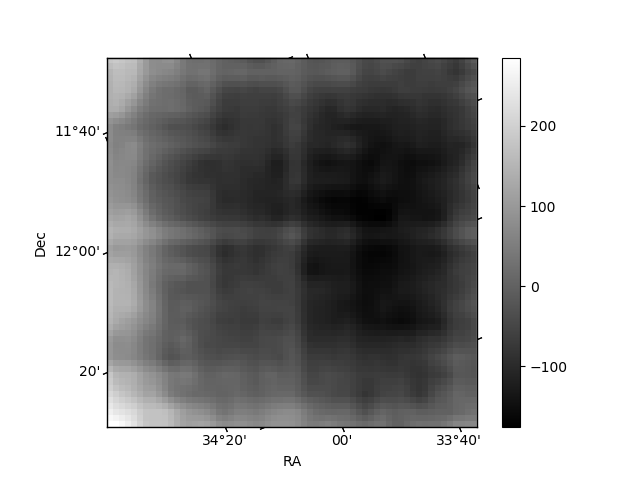
Histogram calculated using DETX and DETY for each event in the final _common_clean file
| Quadrant A | 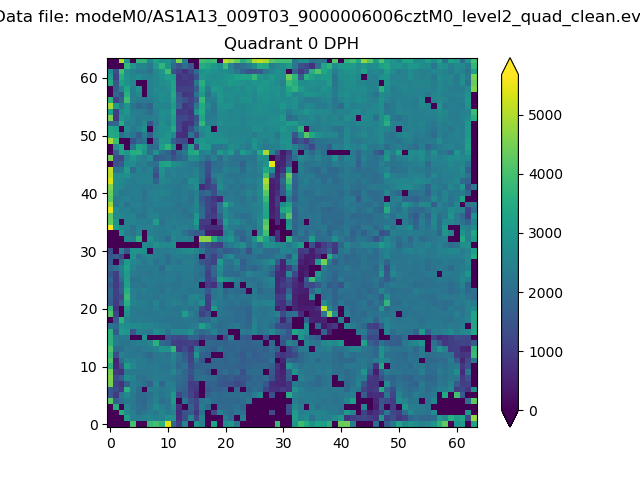 |
 |
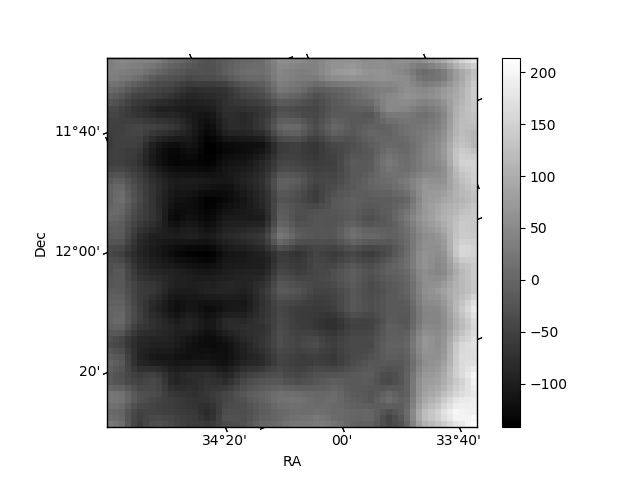
Quadrant B |
|---|---|---|---|
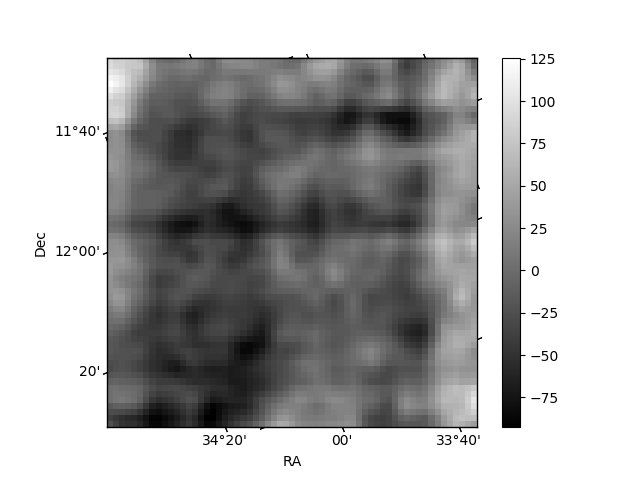
| Quadrant D |  |
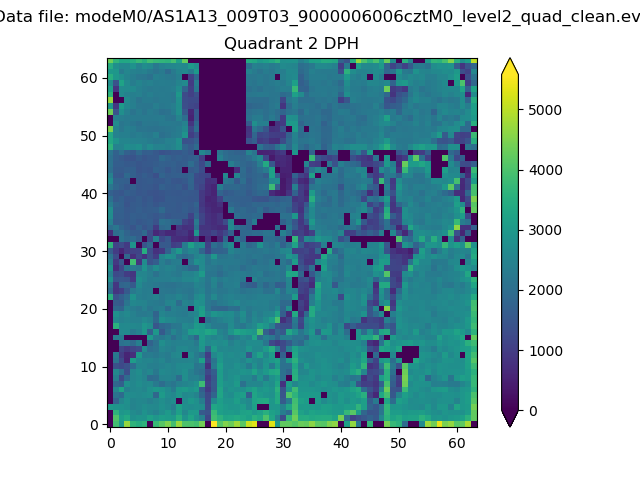 |
Quadrant C |
| Plot type | Count rate plots | Images |
|---|---|---|
| Comparison with Poisson distribution Blue bars denote a histogram of data divided into 1 sec bins. Red curve is a Poisson curve with rate = median count rate of data. |
 |
 |
| Quadrant-wise count rates Data is divided into 100 sec bins |
 |
|
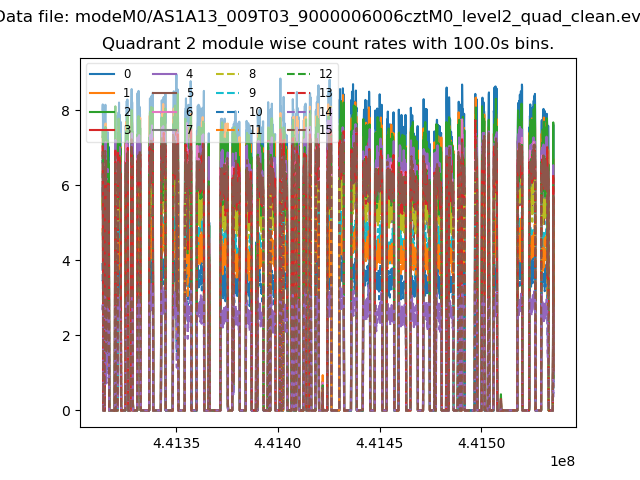
| Module-wise count rates for Quadrant A Data is divided into 100 sec bins |
 |
 |
| Module-wise count rates for Quadrant B Data is divided into 100 sec bins |
 |
 |
| Module-wise count rates for Quadrant C Data is divided into 100 sec bins |
 |
 |
| Module-wise count rates for Quadrant D Data is divided into 100 sec bins |
 |
 |
| Parameter | Plot |
|---|---|
| CZT HV Monitor | 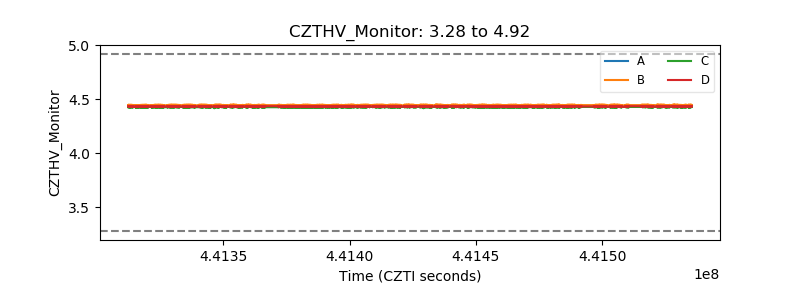 |
| D_VDD | 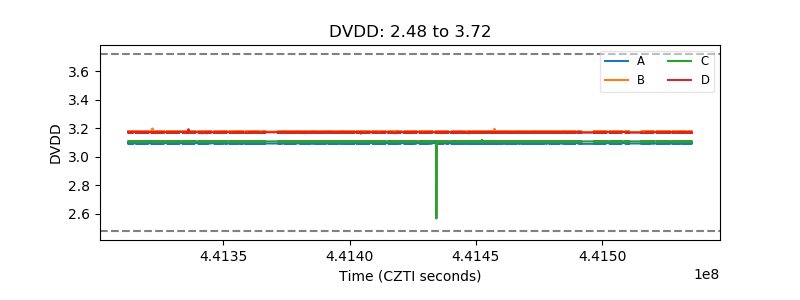 |
| Temperature 1 | 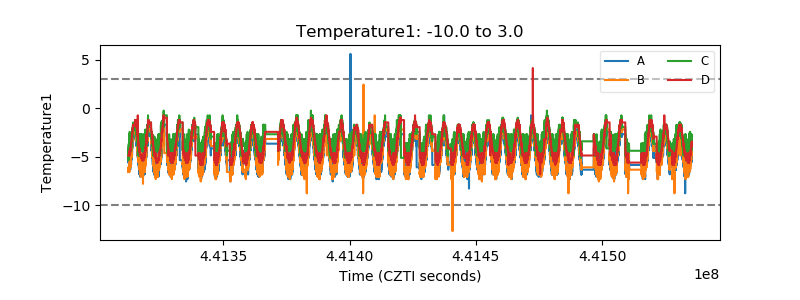 |
| Veto HV Monitor |  |
| Veto LLD |  |
| Alpha Counter |  |
| _CPM_Rate | 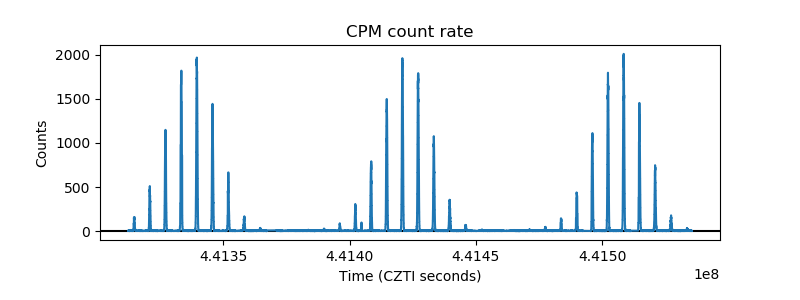 |
| CZT Counter |  |
| +2.5 Volts monitor |  |
| +5 Volts monitor |  |
| _ROLL_ROT |  |
| _Roll_DEC |  |
| _Roll_RA | 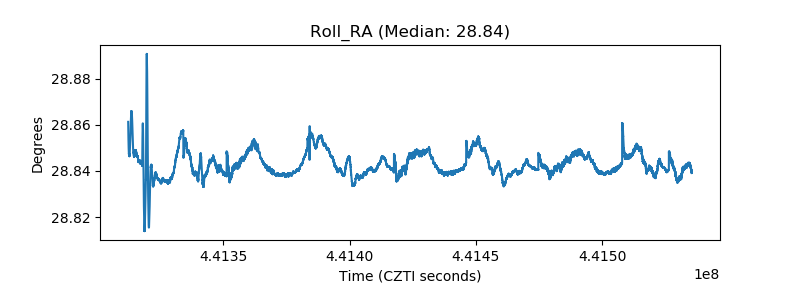 |
| Veto Counter |  |