| Param | Original file | Final file |
|---|---|---|
| Filename | modeM0/AS1A13_080T04_9000006004cztM0_level2.fits | modeM0/AS1A13_080T04_9000006004cztM0_level2_quad_clean.evt |
| Size (bytes) | 171,037,440 | 235,411,200 |
| Size | 163.1 MB | 224.5 MB |
| Events in quadrant A | 1,029,280 | 1,583,839 |
| Events in quadrant B | 969,518 | 1,523,051 |
| Events in quadrant C | 967,350 | 1,371,759 |
| Events in quadrant D | 842,904 | 1,282,288 |
| Mode M9 | |||
|---|---|---|---|
| Quadrant | BADHDUFLAG | Total packets | Discarded packets |
| A | 0 | 1 | 0 |
| B | 0 | 1 | 0 |
| C | 0 | 1 | 0 |
| D | 0 | 1 | 0 |
| Mode SS | |||
|---|---|---|---|
| Quadrant | BADHDUFLAG | Total packets | Discarded packets |
| A | 0 | 398 | 0 |
| B | 0 | 398 | 0 |
| C | 0 | 398 | 0 |
| D | 0 | 398 | 0 |
| Mode M0 | |||
|---|---|---|---|
| Quadrant | BADHDUFLAG | Total packets | Discarded packets |
| A | 0 | 59900 | 0 |
| B | 0 | 52602 | 0 |
| C | 0 | 59876 | 0 |
| D | 0 | 68748 | 0 |
| Quadrant | Total seconds | Saturated seconds | Saturation percentage |
|---|---|---|---|
| A | 19868 | 505 | 2.541776% |
| B | 19867 | 1576 | 7.932753% |
| C | 19868 | 2343 | 11.792833% |
| D | 19869 | 1864 | 9.381448% |
Noise dominated data is calculated using 1-second bins in cleaned event files. If a bin has >2000 counts, and if more than 50% of those come from <1% of pixels, then it is considered to be noise-dominated and hence unusable.
| Quadrant | # 1 sec bins | Bins with >0 counts | Bins with >2000 counts | High rate bins dominated by noise | Noise dominated (total time) | Noise dominated (detector-on time) | Marked lightcurve |
|---|---|---|---|---|---|---|---|
| A | 19883 | 19867 | 0 | 0 | 0.00% | 0.00% | 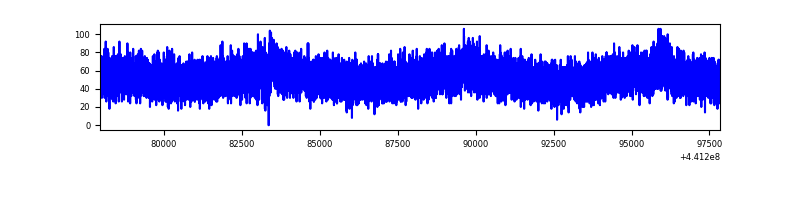 |
| B | 19884 | 19821 | 0 | 0 | 0.00% | 0.00% |  |
| C | 19884 | 19769 | 0 | 0 | 0.00% | 0.00% | 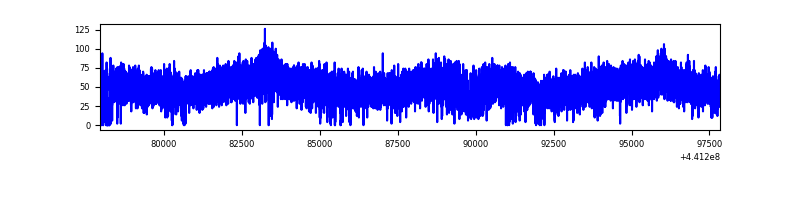 |
| D | 19884 | 19811 | 0 | 0 | 0.00% | 0.00% |  |
Top three noisy pixels from each quadrant. If the there are fewer than three noisy pixels in the level2.evt file, extra rows are filled as -1
| Pixel properties | Quadrant properties | ||||||
|---|---|---|---|---|---|---|---|
| Quadrant | DetID | PixID | Counts | Sigma | Mean | Median | Sigma |
| A | 7 | 110 | 873 | 8.73 | 268 | 252 | 71.1 |
| A | 0 | 29 | 797 | 7.67 | 268 | 252 | 71.1 |
| A | 7 | 109 | 758 | 7.12 | 268 | 252 | 71.1 |
| B | 2 | 9 | 936 | 12.9 | 256 | 244 | 53.6 |
| B | 2 | 8 | 766 | 9.73 | 256 | 244 | 53.6 |
| B | 3 | 17 | 734 | 9.14 | 256 | 244 | 53.6 |
| C | 1 | 81 | 765 | 7.77 | 256 | 238 | 67.8 |
| C | 1 | 80 | 719 | 7.09 | 256 | 238 | 67.8 |
| C | 12 | 241 | 661 | 6.24 | 256 | 238 | 67.8 |
| D | 8 | 176 | 695 | 7.01 | 241 | 220 | 67.8 |
| D | 3 | 159 | 638 | 6.17 | 241 | 220 | 67.8 |
| D | 10 | 114 | 631 | 6.06 | 241 | 220 | 67.8 |
Histogram calculated using DETX and DETY for each event in the final _common_clean file
| Quadrant A | 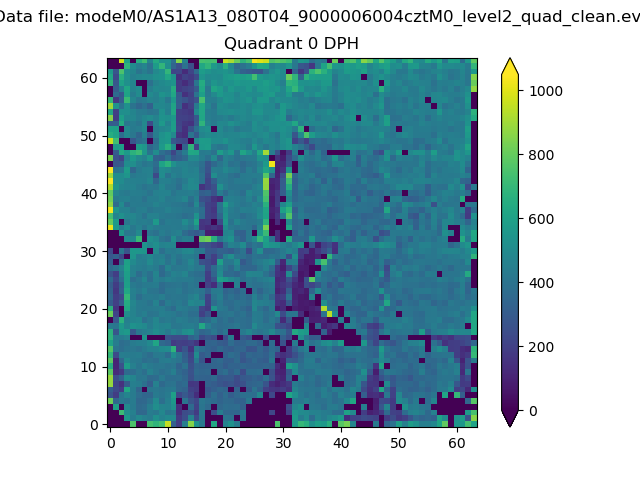 |
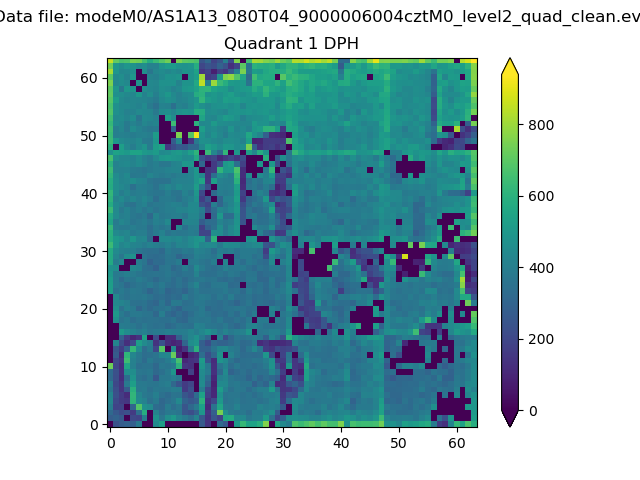 |
Quadrant B |
|---|---|---|---|
| Quadrant D | 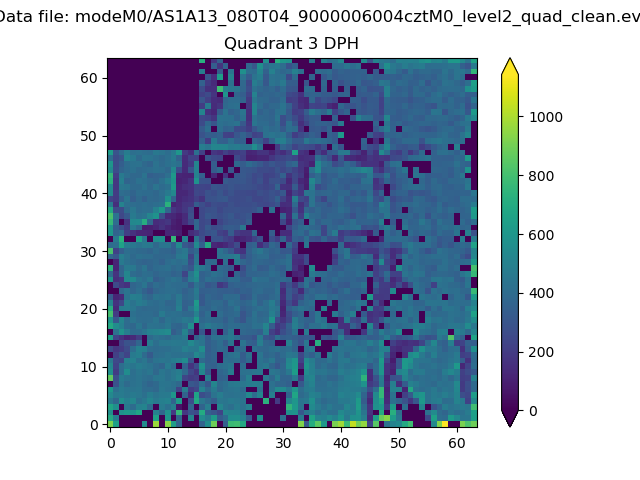 |
 |
Quadrant C |
| Plot type | Count rate plots | Images |
|---|---|---|
| Comparison with Poisson distribution Blue bars denote a histogram of data divided into 1 sec bins. Red curve is a Poisson curve with rate = median count rate of data. |
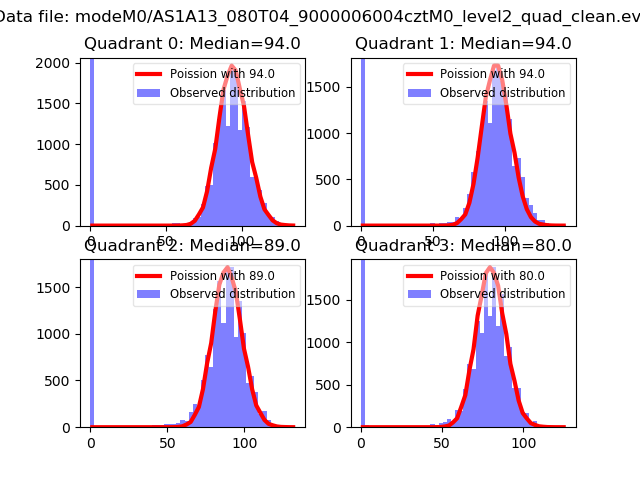 |
 |
| Quadrant-wise count rates Data is divided into 100 sec bins |
 |
|
| Module-wise count rates for Quadrant A Data is divided into 100 sec bins |
 |
 |
| Module-wise count rates for Quadrant B Data is divided into 100 sec bins |
 |
 |
| Module-wise count rates for Quadrant C Data is divided into 100 sec bins |
 |
 |
| Module-wise count rates for Quadrant D Data is divided into 100 sec bins |
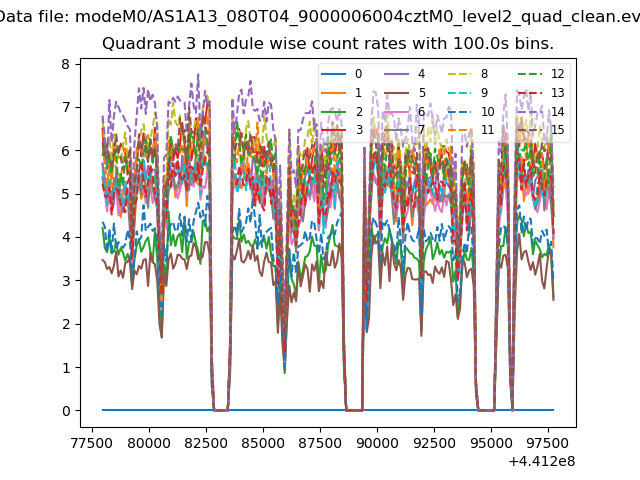 |
 |
| Parameter | Plot |
|---|---|
| CZT HV Monitor | 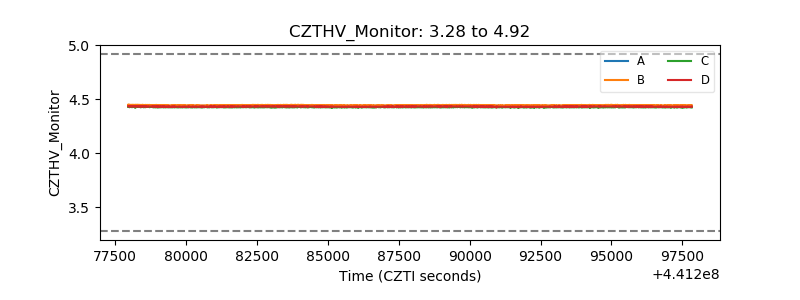 |
| D_VDD |  |
| Temperature 1 |  |
| Veto HV Monitor |  |
| Veto LLD | 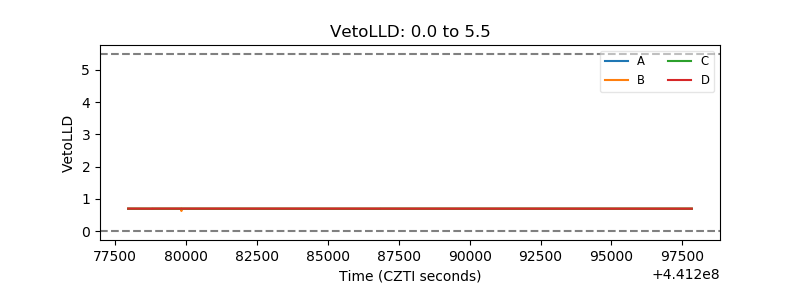 |
| Alpha Counter |  |
| _CPM_Rate |  |
| CZT Counter | 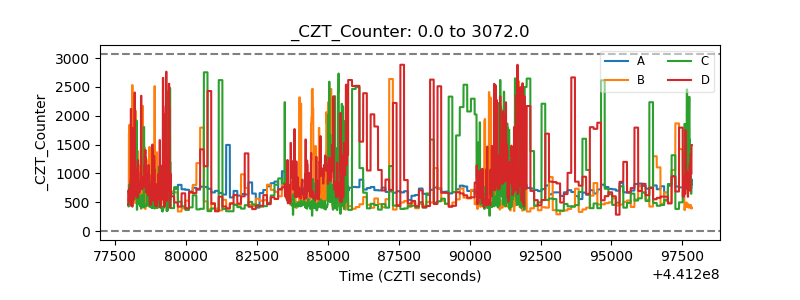 |
| +2.5 Volts monitor | 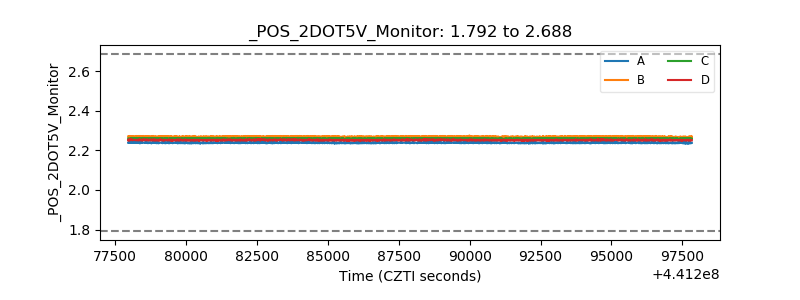 |
| +5 Volts monitor | 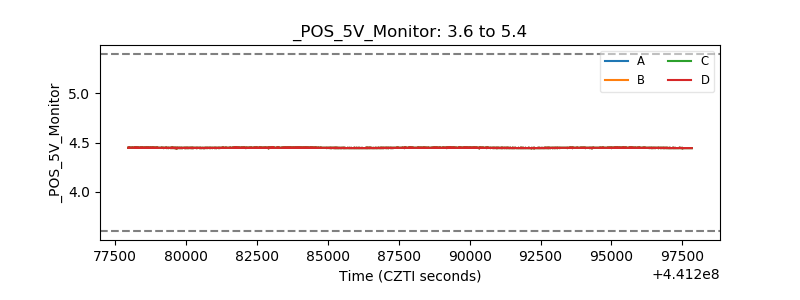 |
| _ROLL_ROT |  |
| _Roll_DEC | 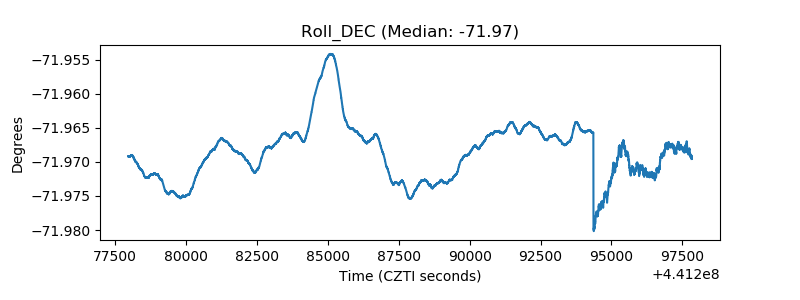 |
| _Roll_RA | 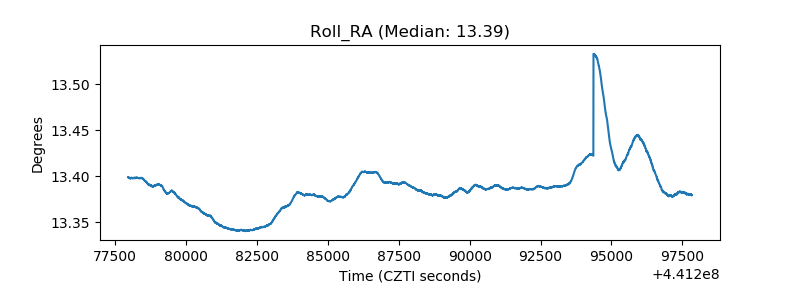 |
| Veto Counter | 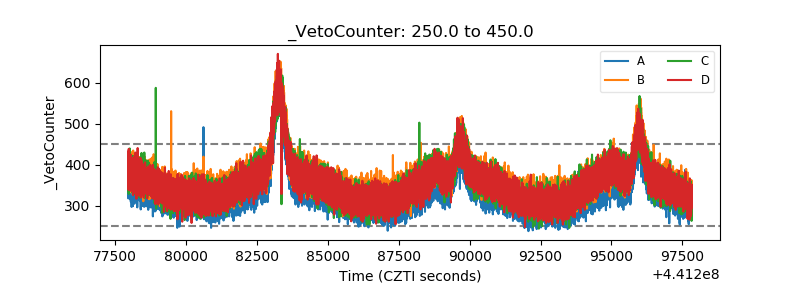 |