| Param | Original file | Final file |
|---|---|---|
| Filename | modeM0/AS1A13_073T04_9000006010cztM0_level2.fits | modeM0/AS1A13_073T04_9000006010cztM0_level2_quad_clean.evt |
| Size (bytes) | 294,917,760 | 265,498,560 |
| Size | 281.3 MB | 253.2 MB |
| Events in quadrant A | 1,752,650 | 1,560,481 |
| Events in quadrant B | 1,739,348 | 1,574,375 |
| Events in quadrant C | 1,806,954 | 1,552,169 |
| Events in quadrant D | 1,318,416 | 1,042,722 |
| Mode SS | |||
|---|---|---|---|
| Quadrant | BADHDUFLAG | Total packets | Discarded packets |
| A | 0 | 686 | 0 |
| B | 0 | 686 | 0 |
| C | 0 | 686 | 0 |
| D | 0 | 686 | 0 |
| Mode M9 | |||
|---|---|---|---|
| Quadrant | BADHDUFLAG | Total packets | Discarded packets |
| A | 0 | 58 | 0 |
| B | 0 | 58 | 0 |
| C | 0 | 58 | 0 |
| D | 0 | 58 | 0 |
| Mode M0 | |||
|---|---|---|---|
| Quadrant | BADHDUFLAG | Total packets | Discarded packets |
| A | 0 | 118264 | 0 |
| B | 0 | 77635 | 0 |
| C | 0 | 69740 | 0 |
| D | 0 | 132364 | 0 |
| Quadrant | Total seconds | Saturated seconds | Saturation percentage |
|---|---|---|---|
| A | 33617 | 2112 | 6.282536% |
| B | 33617 | 1169 | 3.477407% |
| C | 33617 | 291 | 0.865633% |
| D | 33617 | 7292 | 21.691406% |
Noise dominated data is calculated using 1-second bins in cleaned event files. If a bin has >2000 counts, and if more than 50% of those come from <1% of pixels, then it is considered to be noise-dominated and hence unusable.
| Quadrant | # 1 sec bins | Bins with >0 counts | Bins with >2000 counts | High rate bins dominated by noise | Noise dominated (total time) | Noise dominated (detector-on time) | Marked lightcurve |
|---|---|---|---|---|---|---|---|
| A | 39397 | 33617 | 0 | 0 | 0.00% | 0.00% |  |
| B | 39397 | 33605 | 0 | 0 | 0.00% | 0.00% |  |
| C | 39397 | 33618 | 0 | 0 | 0.00% | 0.00% |  |
| D | 39397 | 32382 | 0 | 0 | 0.00% | 0.00% |  |
Top three noisy pixels from each quadrant. If the there are fewer than three noisy pixels in the level2.evt file, extra rows are filled as -1
| Pixel properties | Quadrant properties | ||||||
|---|---|---|---|---|---|---|---|
| Quadrant | DetID | PixID | Counts | Sigma | Mean | Median | Sigma |
| A | 7 | 110 | 1431 | 8.48 | 457 | 429 | 118.1 |
| A | 0 | 29 | 1364 | 7.92 | 457 | 429 | 118.1 |
| A | 14 | 95 | 1363 | 7.91 | 457 | 429 | 118.1 |
| B | 2 | 9 | 1621 | 12.85 | 459 | 438 | 92.1 |
| B | 2 | 8 | 1321 | 9.59 | 459 | 438 | 92.1 |
| B | 3 | 17 | 1251 | 8.83 | 459 | 438 | 92.1 |
| C | 1 | 81 | 1412 | 7.8 | 478 | 446 | 123.7 |
| C | 1 | 80 | 1388 | 7.61 | 478 | 446 | 123.7 |
| C | 3 | 202 | 1376 | 7.51 | 478 | 446 | 123.7 |
| D | 8 | 176 | 1425 | 10.15 | 377 | 342 | 106.7 |
| D | 10 | 189 | 1001 | 6.18 | 377 | 342 | 106.7 |
| D | 15 | 47 | 999 | 6.16 | 377 | 342 | 106.7 |
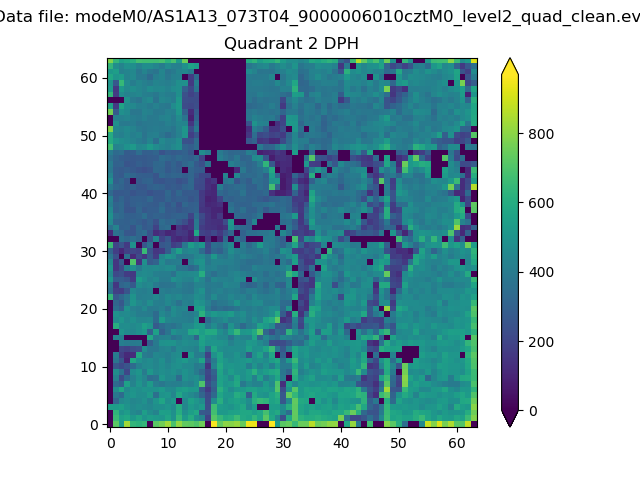
Histogram calculated using DETX and DETY for each event in the final _common_clean file
| Quadrant A | 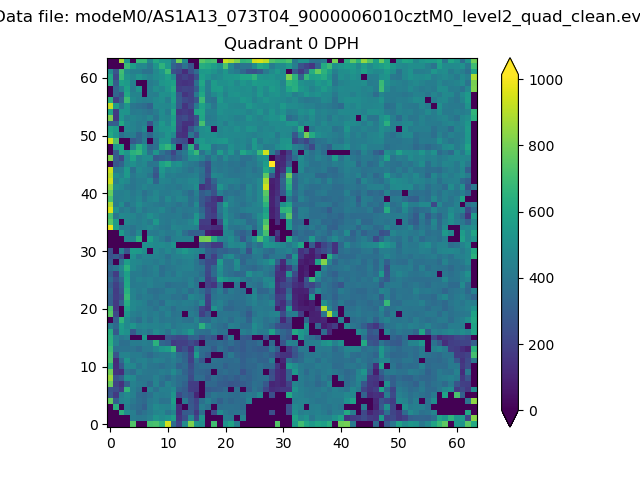 |
 |
Quadrant B |
|---|---|---|---|
| Quadrant D |  |
 |
Quadrant C |
| Plot type | Count rate plots | Images |
|---|---|---|
| Comparison with Poisson distribution Blue bars denote a histogram of data divided into 1 sec bins. Red curve is a Poisson curve with rate = median count rate of data. |
 |
 |
| Quadrant-wise count rates Data is divided into 100 sec bins |
 |
|
| Module-wise count rates for Quadrant A Data is divided into 100 sec bins |
 |
 |
| Module-wise count rates for Quadrant B Data is divided into 100 sec bins |
 |
 |
| Module-wise count rates for Quadrant C Data is divided into 100 sec bins |
 |
 |
| Module-wise count rates for Quadrant D Data is divided into 100 sec bins |
 |
 |
| Parameter | Plot |
|---|---|
| CZT HV Monitor |  |
| D_VDD | 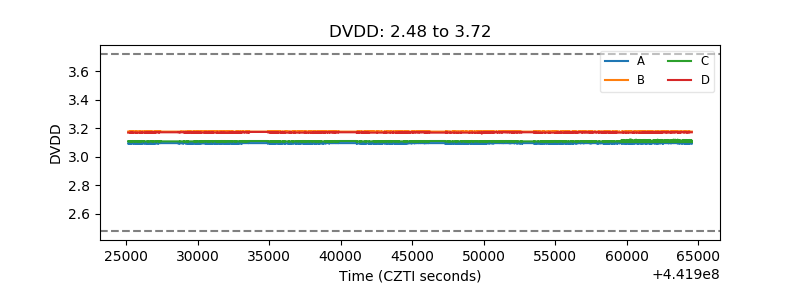 |
| Temperature 1 |  |
| Veto HV Monitor |  |
| Veto LLD |  |
| Alpha Counter |  |
| _CPM_Rate |  |
| CZT Counter |  |
| +2.5 Volts monitor |  |
| +5 Volts monitor |  |
| _ROLL_ROT |  |
| _Roll_DEC |  |
| _Roll_RA |  |
| Veto Counter |  |