| Param | Original file | Final file |
|---|---|---|
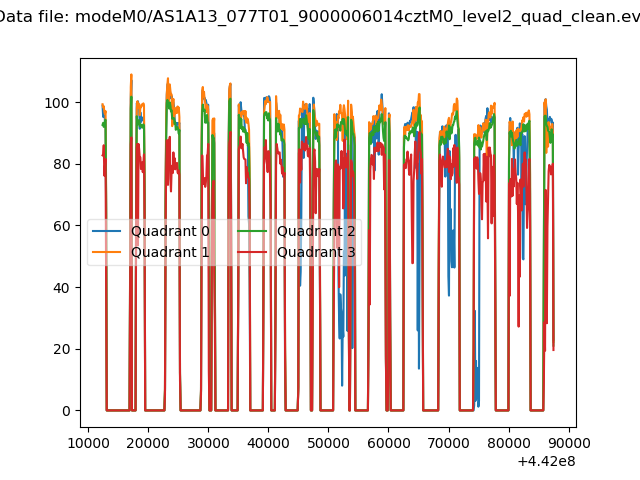
| Filename | modeM0/AS1A13_077T01_9000006014cztM0_level2.fits | modeM0/AS1A13_077T01_9000006014cztM0_level2_quad_clean.evt |
| Size (bytes) | 590,411,520 | 575,614,080 |
| Size | 563.1 MB | 548.9 MB |
| Events in quadrant A | 3,372,638 | 3,142,828 |
| Events in quadrant B | 3,440,844 | 3,486,025 |
| Events in quadrant C | 3,598,544 | 3,347,999 |
| Events in quadrant D | 2,832,158 | 2,827,619 |
| Mode M9 | |||
|---|---|---|---|
| Quadrant | BADHDUFLAG | Total packets | Discarded packets |
| A | 0 | 79 | 0 |
| B | 0 | 79 | 0 |
| C | 0 | 79 | 0 |
| D | 0 | 79 | 0 |
| Mode M0 | |||
|---|---|---|---|
| Quadrant | BADHDUFLAG | Total packets | Discarded packets |
| A | 0 | 246887 | 0 |
| B | 0 | 157975 | 0 |
| C | 0 | 139920 | 0 |
| D | 0 | 265286 | 0 |
| Mode SS | |||
|---|---|---|---|
| Quadrant | BADHDUFLAG | Total packets | Discarded packets |
| A | 0 | 1368 | 0 |
| B | 0 | 1368 | 0 |
| C | 0 | 1368 | 0 |
| D | 0 | 1368 | 0 |
| Quadrant | Total seconds | Saturated seconds | Saturation percentage |
|---|---|---|---|
| A | 67472 | 8069 | 11.959035% |
| B | 67472 | 2142 | 3.174650% |
| C | 67472 | 667 | 0.988558% |
| D | 67472 | 10776 | 15.971069% |
Noise dominated data is calculated using 1-second bins in cleaned event files. If a bin has >2000 counts, and if more than 50% of those come from <1% of pixels, then it is considered to be noise-dominated and hence unusable.
| Quadrant | # 1 sec bins | Bins with >0 counts | Bins with >2000 counts | High rate bins dominated by noise | Noise dominated (total time) | Noise dominated (detector-on time) | Marked lightcurve |
|---|---|---|---|---|---|---|---|
| A | 75268 | 66965 | 0 | 0 | 0.00% | 0.00% |  |
| B | 75268 | 67464 | 0 | 0 | 0.00% | 0.00% |  |
| C | 75268 | 67473 | 0 | 0 | 0.00% | 0.00% | 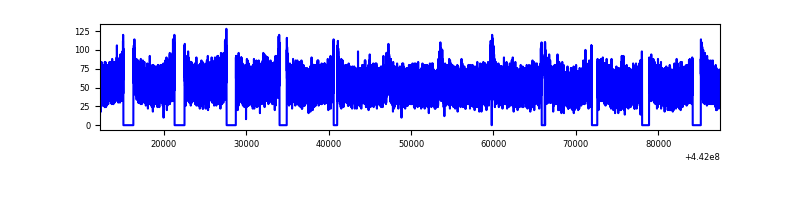 |
| D | 75268 | 67386 | 0 | 0 | 0.00% | 0.00% |  |
Top three noisy pixels from each quadrant. If the there are fewer than three noisy pixels in the level2.evt file, extra rows are filled as -1
| Pixel properties | Quadrant properties | ||||||
|---|---|---|---|---|---|---|---|
| Quadrant | DetID | PixID | Counts | Sigma | Mean | Median | Sigma |
| A | 7 | 110 | 2786 | 8.67 | 877 | 817 | 227.2 |
| A | 15 | 236 | 2716 | 8.36 | 877 | 817 | 227.2 |
| A | 0 | 29 | 2703 | 8.3 | 877 | 817 | 227.2 |
| B | 2 | 9 | 3318 | 13.6 | 910 | 864 | 180.5 |
| B | 2 | 8 | 2632 | 9.8 | 910 | 864 | 180.5 |
| B | 3 | 17 | 2524 | 9.2 | 910 | 864 | 180.5 |
| C | 3 | 202 | 2805 | 7.83 | 951 | 880 | 245.7 |
| C | 3 | 203 | 2684 | 7.34 | 951 | 880 | 245.7 |
| C | 1 | 80 | 2635 | 7.14 | 951 | 880 | 245.7 |
| D | 8 | 176 | 2770 | 8.79 | 814 | 735 | 231.4 |
| D | 7 | 3 | 2083 | 5.82 | 814 | 735 | 231.4 |
| D | 15 | 47 | 2076 | 5.79 | 814 | 735 | 231.4 |
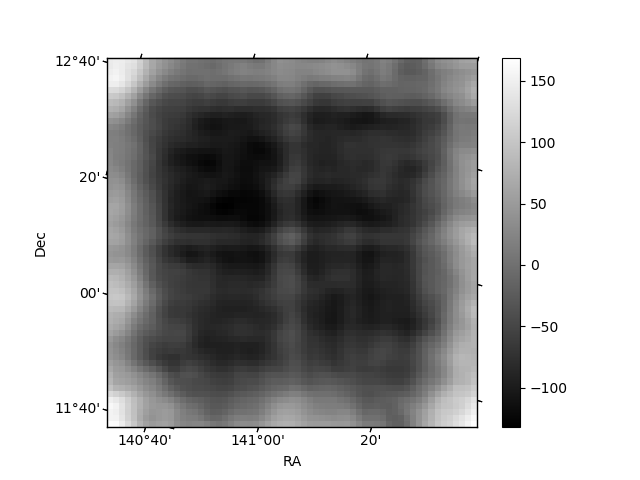
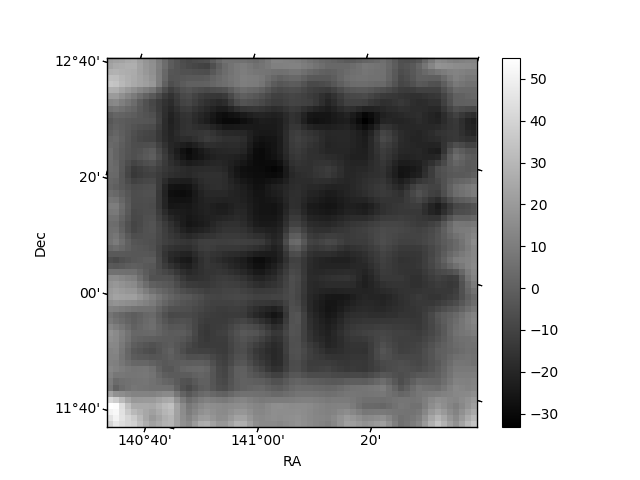
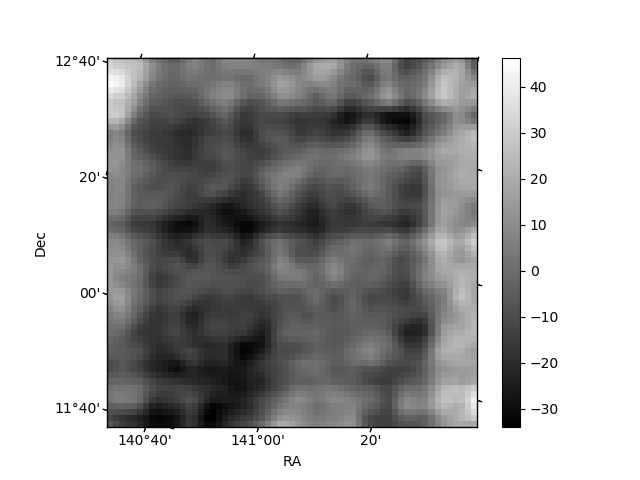
Histogram calculated using DETX and DETY for each event in the final _common_clean file
| Quadrant A | 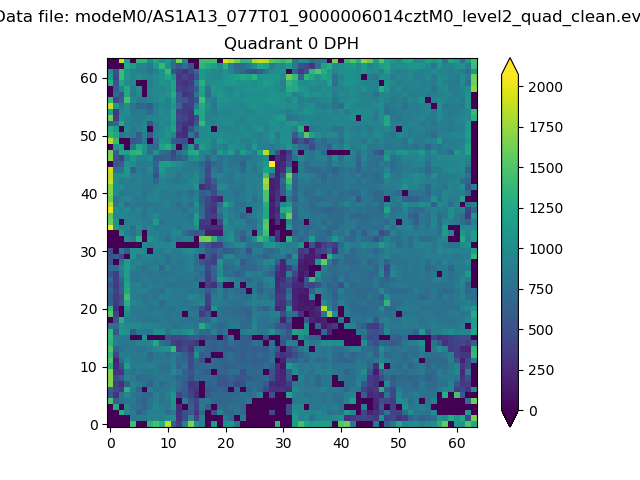 |
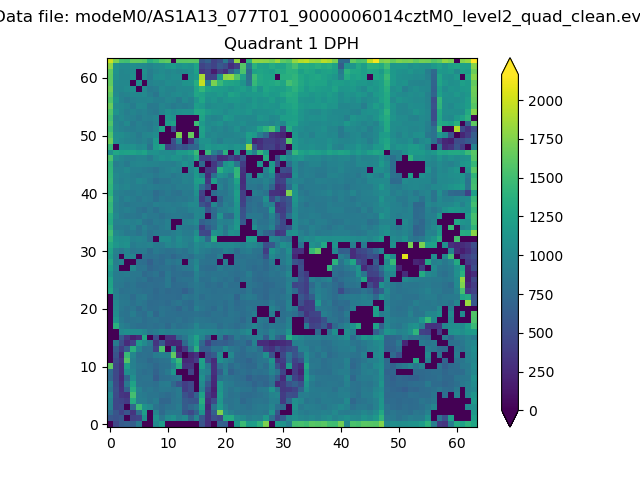 |
Quadrant B |
|---|---|---|---|
| Quadrant D |  |
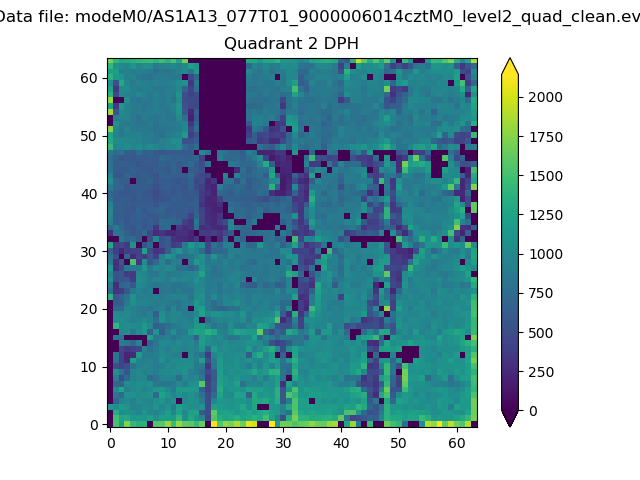 |
Quadrant C |
| Plot type | Count rate plots | Images |
|---|---|---|
| Comparison with Poisson distribution Blue bars denote a histogram of data divided into 1 sec bins. Red curve is a Poisson curve with rate = median count rate of data. |
 |
 |
| Quadrant-wise count rates Data is divided into 100 sec bins |
 |
|
| Module-wise count rates for Quadrant A Data is divided into 100 sec bins |
 |
 |
| Module-wise count rates for Quadrant B Data is divided into 100 sec bins |
 |
 |
| Module-wise count rates for Quadrant C Data is divided into 100 sec bins |
 |
 |
| Module-wise count rates for Quadrant D Data is divided into 100 sec bins |
 |
 |
| Parameter | Plot |
|---|---|
| CZT HV Monitor |  |
| D_VDD | 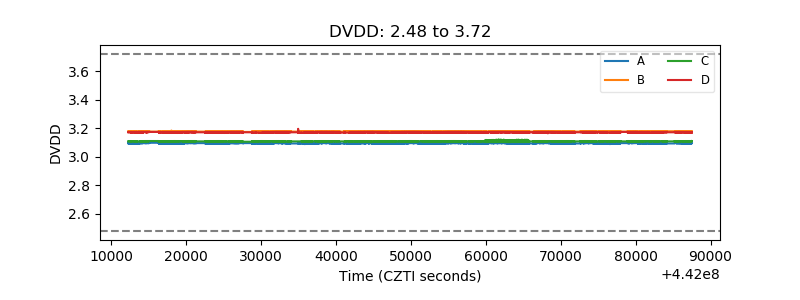 |
| Temperature 1 |  |
| Veto HV Monitor |  |
| Veto LLD | 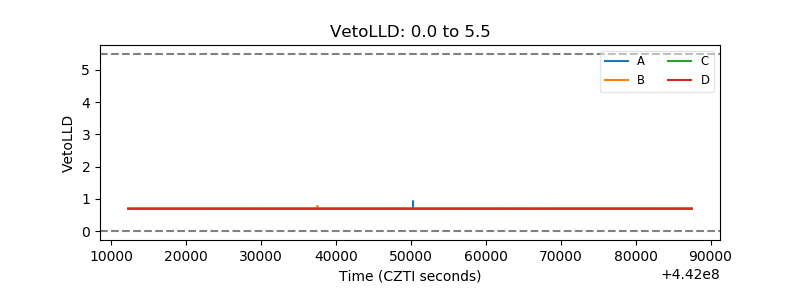 |
| Alpha Counter |  |
| _CPM_Rate | 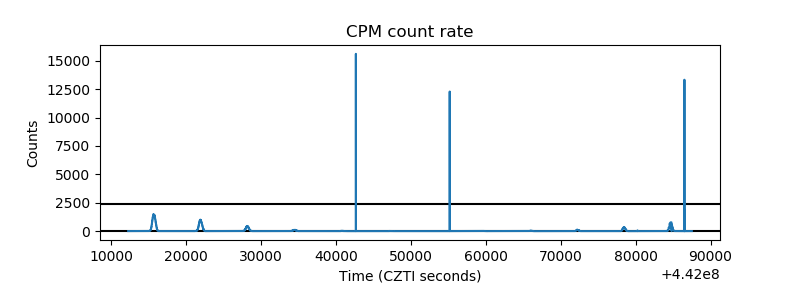 |
| CZT Counter |  |
| +2.5 Volts monitor | 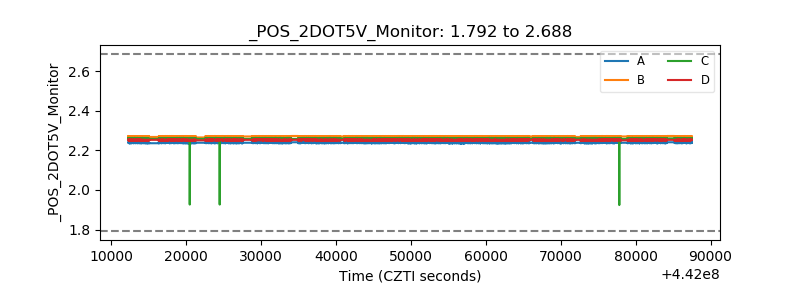 |
| +5 Volts monitor |  |
| _ROLL_ROT | 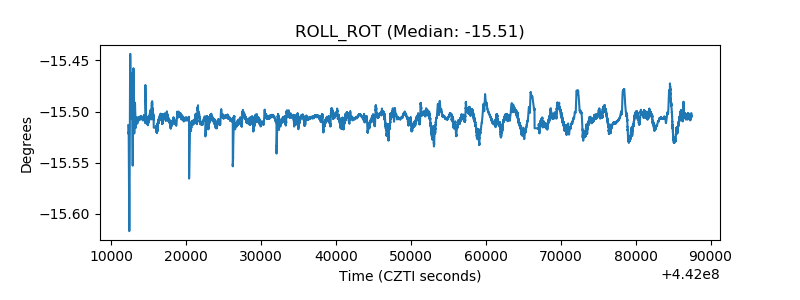 |
| _Roll_DEC | 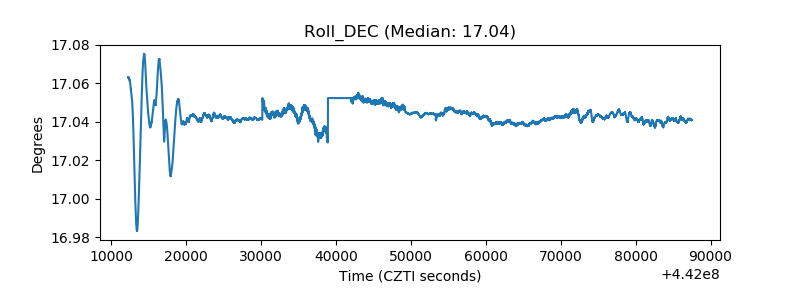 |
| _Roll_RA |  |
| Veto Counter |  |