| Param | Original file | Final file |
|---|---|---|
| Filename | modeM0/AS1A13_012T01_9000006024cztM0_level2.fits | modeM0/AS1A13_012T01_9000006024cztM0_level2_quad_clean.evt |
| Size (bytes) | 198,184,320 | 151,830,720 |
| Size | 189.0 MB | 144.8 MB |
| Events in quadrant A | 980,670 | 632,682 |
| Events in quadrant B | 1,214,848 | 873,757 |
| Events in quadrant C | 1,256,160 | 839,489 |
| Events in quadrant D | 984,764 | 690,666 |
| Mode M0 | |||
|---|---|---|---|
| Quadrant | BADHDUFLAG | Total packets | Discarded packets |
| A | 0 | 130627 | 0 |
| B | 0 | 51559 | 0 |
| C | 0 | 47677 | 0 |
| D | 0 | 90020 | 0 |
| Mode SS | |||
|---|---|---|---|
| Quadrant | BADHDUFLAG | Total packets | Discarded packets |
| A | 0 | 464 | 0 |
| B | 0 | 464 | 0 |
| C | 0 | 464 | 0 |
| D | 0 | 464 | 0 |
| Mode M9 | |||
|---|---|---|---|
| Quadrant | BADHDUFLAG | Total packets | Discarded packets |
| A | 0 | 53 | 0 |
| B | 0 | 53 | 0 |
| C | 0 | 53 | 0 |
| D | 0 | 53 | 0 |
| Quadrant | Total seconds | Saturated seconds | Saturation percentage |
|---|---|---|---|
| A | 22661 | 9336 | 41.198535% |
| B | 22661 | 492 | 2.171131% |
| C | 22661 | 161 | 0.710472% |
| D | 22661 | 3017 | 13.313623% |
Noise dominated data is calculated using 1-second bins in cleaned event files. If a bin has >2000 counts, and if more than 50% of those come from <1% of pixels, then it is considered to be noise-dominated and hence unusable.
| Quadrant | # 1 sec bins | Bins with >0 counts | Bins with >2000 counts | High rate bins dominated by noise | Noise dominated (total time) | Noise dominated (detector-on time) | Marked lightcurve |
|---|---|---|---|---|---|---|---|
| A | 27365 | 22509 | 0 | 0 | 0.00% | 0.00% |  |
| B | 27365 | 22653 | 0 | 0 | 0.00% | 0.00% |  |
| C | 27365 | 22655 | 0 | 0 | 0.00% | 0.00% |  |
| D | 27365 | 22624 | 0 | 0 | 0.00% | 0.00% |  |
Top three noisy pixels from each quadrant. If the there are fewer than three noisy pixels in the level2.evt file, extra rows are filled as -1
| Pixel properties | Quadrant properties | ||||||
|---|---|---|---|---|---|---|---|
| Quadrant | DetID | PixID | Counts | Sigma | Mean | Median | Sigma |
| A | 7 | 110 | 779 | 8.1 | 255 | 240 | 66.5 |
| A | 0 | 29 | 778 | 8.09 | 255 | 240 | 66.5 |
| A | 14 | 79 | 768 | 7.94 | 255 | 240 | 66.5 |
| B | 2 | 9 | 1108 | 12.08 | 321 | 305 | 66.5 |
| B | 3 | 17 | 960 | 9.85 | 321 | 305 | 66.5 |
| B | 2 | 8 | 876 | 8.59 | 321 | 305 | 66.5 |
| C | 1 | 81 | 952 | 7.38 | 332 | 310 | 87.0 |
| C | 3 | 202 | 945 | 7.3 | 332 | 310 | 87.0 |
| C | 1 | 80 | 945 | 7.3 | 332 | 310 | 87.0 |
| D | 8 | 176 | 992 | 9.11 | 282 | 256 | 80.8 |
| D | 10 | 189 | 743 | 6.03 | 282 | 256 | 80.8 |
| D | 4 | 12 | 743 | 6.03 | 282 | 256 | 80.8 |
Histogram calculated using DETX and DETY for each event in the final _common_clean file
| Quadrant A | 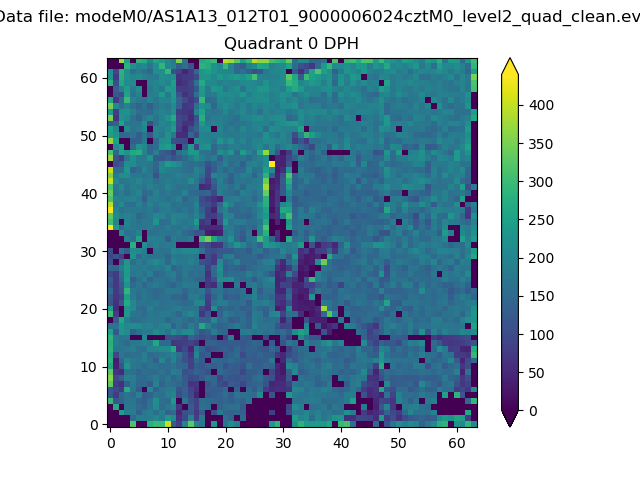 |
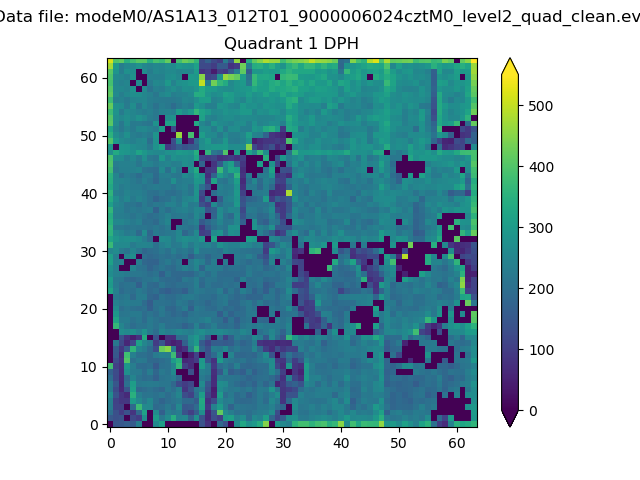 |
Quadrant B |
|---|---|---|---|
| Quadrant D |  |
 |
Quadrant C |
| Plot type | Count rate plots | Images |
|---|---|---|
| Comparison with Poisson distribution Blue bars denote a histogram of data divided into 1 sec bins. Red curve is a Poisson curve with rate = median count rate of data. |
 |
 |
| Quadrant-wise count rates Data is divided into 100 sec bins |
 |
|
| Module-wise count rates for Quadrant A Data is divided into 100 sec bins |
 |
 |
| Module-wise count rates for Quadrant B Data is divided into 100 sec bins |
 |
 |
| Module-wise count rates for Quadrant C Data is divided into 100 sec bins |
 |
 |
| Module-wise count rates for Quadrant D Data is divided into 100 sec bins |
 |
 |
| Parameter | Plot |
|---|---|
| CZT HV Monitor |  |
| D_VDD | 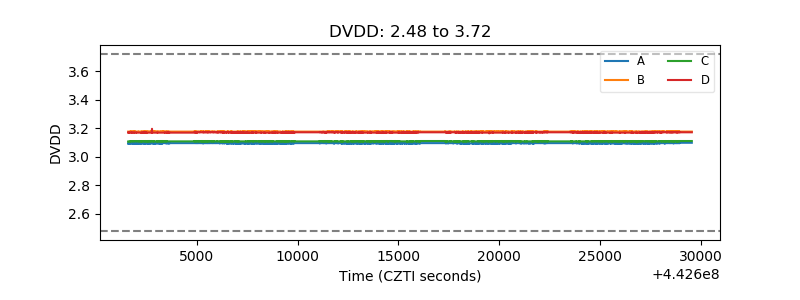 |
| Temperature 1 |  |
| Veto HV Monitor |  |
| Veto LLD |  |
| Alpha Counter |  |
| _CPM_Rate |  |
| CZT Counter |  |
| +2.5 Volts monitor |  |
| +5 Volts monitor |  |
| _ROLL_ROT |  |
| _Roll_DEC |  |
| _Roll_RA |  |
| Veto Counter |  |