| Param | Original file | Final file |
|---|---|---|
| Filename | modeM0/AS1A13_017T02_9000006032cztM0_level2.fits | modeM0/AS1A13_017T02_9000006032cztM0_level2_quad_clean.evt |
| Size (bytes) | 3,965,820,480 | 3,713,918,400 |
| Size | 3.7 GB | 3.5 GB |
| Events in quadrant A | 23,886,888 | 21,770,101 |
| Events in quadrant B | 23,084,908 | 22,077,009 |
| Events in quadrant C | 24,300,296 | 21,801,149 |
| Events in quadrant D | 18,570,500 | 16,612,220 |
| Mode SS | |||
|---|---|---|---|
| Quadrant | BADHDUFLAG | Total packets | Discarded packets |
| A | 0 | 8966 | 0 |
| B | 0 | 8966 | 0 |
| C | 0 | 8966 | 0 |
| D | 0 | 8966 | 0 |
| Mode M0 | |||
|---|---|---|---|
| Quadrant | BADHDUFLAG | Total packets | Discarded packets |
| A | 0 | 1387296 | 0 |
| B | 0 | 1047899 | 0 |
| C | 0 | 959590 | 0 |
| D | 0 | 1792205 | 0 |
| Mode M9 | |||
|---|---|---|---|
| Quadrant | BADHDUFLAG | Total packets | Discarded packets |
| A | 0 | 551 | 0 |
| B | 0 | 551 | 0 |
| C | 0 | 551 | 0 |
| D | 0 | 551 | 0 |
| Quadrant | Total seconds | Saturated seconds | Saturation percentage |
|---|---|---|---|
| A | 441209 | 12639 | 2.864629% |
| B | 441203 | 14502 | 3.286922% |
| C | 441206 | 5158 | 1.169068% |
| D | 441201 | 81636 | 18.503131% |
Noise dominated data is calculated using 1-second bins in cleaned event files. If a bin has >2000 counts, and if more than 50% of those come from <1% of pixels, then it is considered to be noise-dominated and hence unusable.
| Quadrant | # 1 sec bins | Bins with >0 counts | Bins with >2000 counts | High rate bins dominated by noise | Noise dominated (total time) | Noise dominated (detector-on time) | Marked lightcurve |
|---|---|---|---|---|---|---|---|
| A | 501362 | 441205 | 0 | 0 | 0.00% | 0.00% |  |
| B | 501362 | 441173 | 0 | 0 | 0.00% | 0.00% |  |
| C | 501362 | 441197 | 0 | 0 | 0.00% | 0.00% |  |
| D | 501362 | 437858 | 0 | 0 | 0.00% | 0.00% |  |
Top three noisy pixels from each quadrant. If the there are fewer than three noisy pixels in the level2.evt file, extra rows are filled as -1
| Pixel properties | Quadrant properties | ||||||
|---|---|---|---|---|---|---|---|
| Quadrant | DetID | PixID | Counts | Sigma | Mean | Median | Sigma |
| A | 7 | 110 | 19202 | 8.6 | 6222 | 5790 | 1560.2 |
| A | 15 | 236 | 19185 | 8.59 | 6222 | 5790 | 1560.2 |
| A | 0 | 29 | 18403 | 8.08 | 6222 | 5790 | 1560.2 |
| B | 2 | 9 | 21837 | 13.31 | 6116 | 5794 | 1205.3 |
| B | 2 | 8 | 17255 | 9.51 | 6116 | 5794 | 1205.3 |
| B | 3 | 17 | 16763 | 9.1 | 6116 | 5794 | 1205.3 |
| C | 3 | 202 | 18974 | 7.93 | 6445 | 6003 | 1635.5 |
| C | 1 | 81 | 18434 | 7.6 | 6445 | 6003 | 1635.5 |
| C | 3 | 203 | 18084 | 7.39 | 6445 | 6003 | 1635.5 |
| D | 10 | 189 | 13891 | 6.12 | 5361 | 4876 | 1472.9 |
| D | 15 | 47 | 13449 | 5.82 | 5361 | 4876 | 1472.9 |
| D | 6 | 79 | 13296 | 5.72 | 5361 | 4876 | 1472.9 |
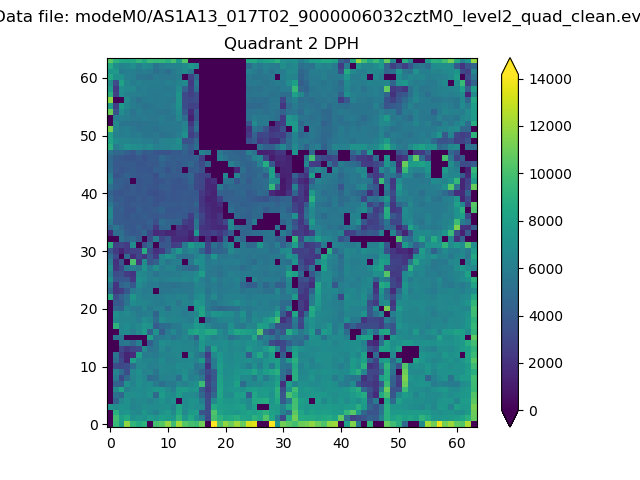
Histogram calculated using DETX and DETY for each event in the final _common_clean file
| Quadrant A | 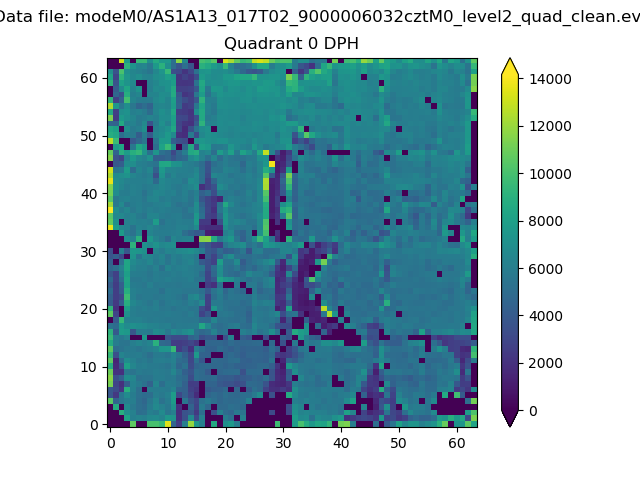 |
 |
Quadrant B |
|---|---|---|---|
| Quadrant D |  |
 |
Quadrant C |
| Plot type | Count rate plots | Images |
|---|---|---|
| Comparison with Poisson distribution Blue bars denote a histogram of data divided into 1 sec bins. Red curve is a Poisson curve with rate = median count rate of data. |
 |
 |
| Quadrant-wise count rates Data is divided into 100 sec bins |
 |
|
| Module-wise count rates for Quadrant A Data is divided into 100 sec bins |
 |
 |
| Module-wise count rates for Quadrant B Data is divided into 100 sec bins |
 |
 |
| Module-wise count rates for Quadrant C Data is divided into 100 sec bins |
 |
 |
| Module-wise count rates for Quadrant D Data is divided into 100 sec bins |
 |
 |
| Parameter | Plot |
|---|---|
| CZT HV Monitor |  |
| D_VDD |  |
| Temperature 1 |  |
| Veto HV Monitor |  |
| Veto LLD |  |
| Alpha Counter |  |
| _CPM_Rate |  |
| CZT Counter |  |
| +2.5 Volts monitor |  |
| +5 Volts monitor |  |
| _ROLL_ROT | 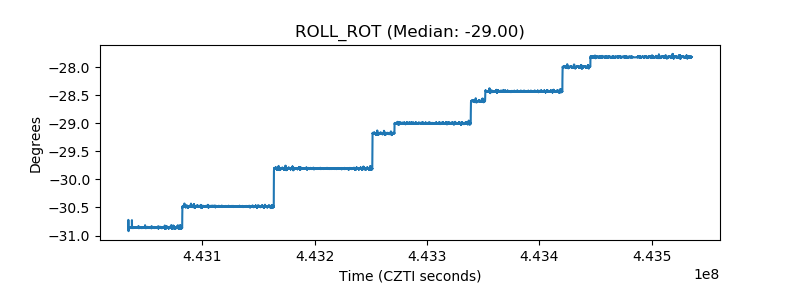 |
| _Roll_DEC |  |
| _Roll_RA |  |
| Veto Counter |  |