| Param | Original file | Final file |
|---|---|---|
| Filename | modeM0/AS1A13_042T03_9000006030cztM0_level2.fits | modeM0/AS1A13_042T03_9000006030cztM0_level2_quad_clean.evt |
| Size (bytes) | 220,688,640 | 200,240,640 |
| Size | 210.5 MB | 191.0 MB |
| Events in quadrant A | 1,323,800 | 1,164,706 |
| Events in quadrant B | 1,281,184 | 1,184,997 |
| Events in quadrant C | 1,346,540 | 1,142,873 |
| Events in quadrant D | 1,107,180 | 947,216 |
| Mode M9 | |||
|---|---|---|---|
| Quadrant | BADHDUFLAG | Total packets | Discarded packets |
| A | 0 | 43 | 0 |
| B | 0 | 43 | 0 |
| C | 0 | 43 | 0 |
| D | 0 | 43 | 0 |
| Mode SS | |||
|---|---|---|---|
| Quadrant | BADHDUFLAG | Total packets | Discarded packets |
| A | 0 | 482 | 0 |
| B | 0 | 482 | 0 |
| C | 0 | 482 | 0 |
| D | 0 | 482 | 0 |
| Mode M0 | |||
|---|---|---|---|
| Quadrant | BADHDUFLAG | Total packets | Discarded packets |
| A | 0 | 74551 | 0 |
| B | 0 | 53669 | 0 |
| C | 0 | 49714 | 0 |
| D | 0 | 77203 | 0 |
| Quadrant | Total seconds | Saturated seconds | Saturation percentage |
|---|---|---|---|
| A | 23589 | 642 | 2.721608% |
| B | 23589 | 549 | 2.327356% |
| C | 23589 | 264 | 1.119166% |
| D | 23590 | 2388 | 10.122933% |
Noise dominated data is calculated using 1-second bins in cleaned event files. If a bin has >2000 counts, and if more than 50% of those come from <1% of pixels, then it is considered to be noise-dominated and hence unusable.
| Quadrant | # 1 sec bins | Bins with >0 counts | Bins with >2000 counts | High rate bins dominated by noise | Noise dominated (total time) | Noise dominated (detector-on time) | Marked lightcurve |
|---|---|---|---|---|---|---|---|
| A | 27964 | 23588 | 0 | 0 | 0.00% | 0.00% | 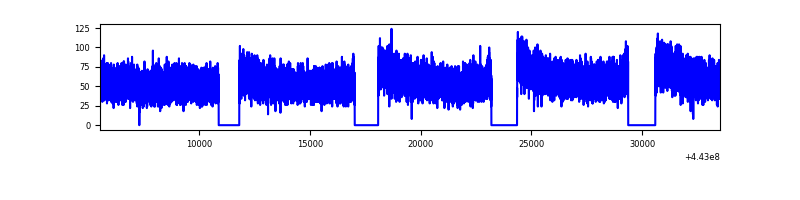 |
| B | 27964 | 23589 | 0 | 0 | 0.00% | 0.00% | 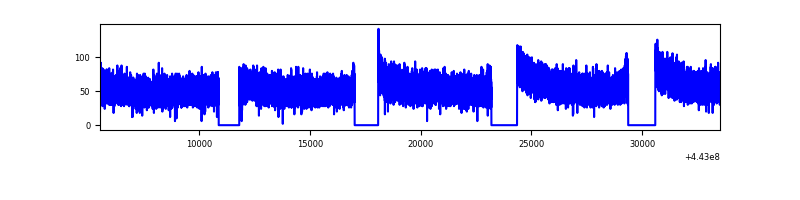 |
| C | 27964 | 23589 | 0 | 0 | 0.00% | 0.00% | 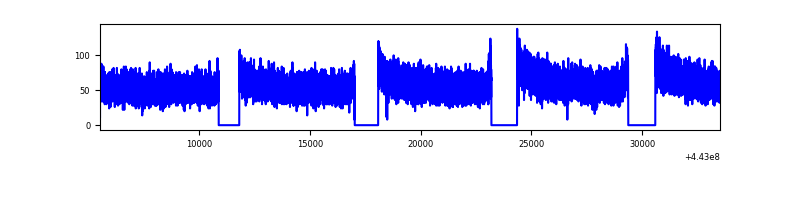 |
| D | 27965 | 23557 | 0 | 0 | 0.00% | 0.00% |  |
Top three noisy pixels from each quadrant. If the there are fewer than three noisy pixels in the level2.evt file, extra rows are filled as -1
| Pixel properties | Quadrant properties | ||||||
|---|---|---|---|---|---|---|---|
| Quadrant | DetID | PixID | Counts | Sigma | Mean | Median | Sigma |
| A | 7 | 110 | 1090 | 8.76 | 344 | 324 | 87.5 |
| A | 15 | 236 | 1032 | 8.09 | 344 | 324 | 87.5 |
| A | 14 | 95 | 1016 | 7.91 | 344 | 324 | 87.5 |
| B | 2 | 9 | 1226 | 13.24 | 339 | 324 | 68.1 |
| B | 2 | 8 | 944 | 9.1 | 339 | 324 | 68.1 |
| B | 5 | 232 | 889 | 8.29 | 339 | 324 | 68.1 |
| C | 3 | 202 | 1043 | 7.69 | 356 | 333 | 92.3 |
| C | 1 | 81 | 1041 | 7.67 | 356 | 333 | 92.3 |
| C | 3 | 203 | 1031 | 7.56 | 356 | 333 | 92.3 |
| D | 3 | 14 | 846 | 6.39 | 317 | 288 | 87.3 |
| D | 15 | 47 | 836 | 6.28 | 317 | 288 | 87.3 |
| D | 10 | 189 | 830 | 6.21 | 317 | 288 | 87.3 |
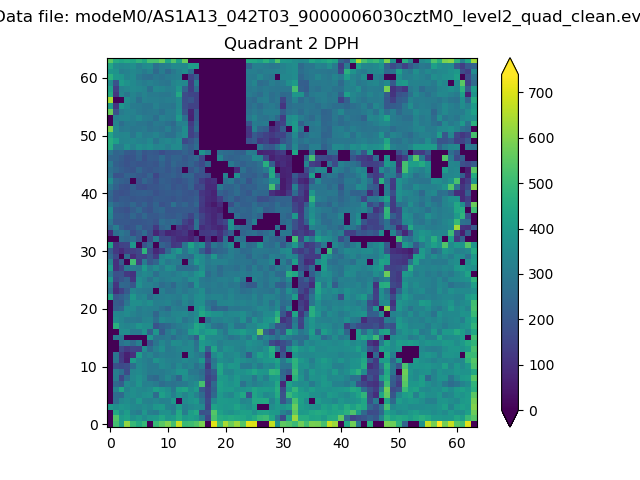
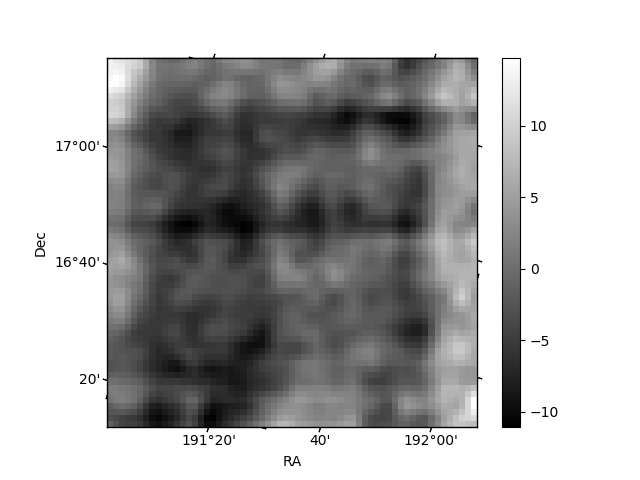
Histogram calculated using DETX and DETY for each event in the final _common_clean file
| Quadrant A | 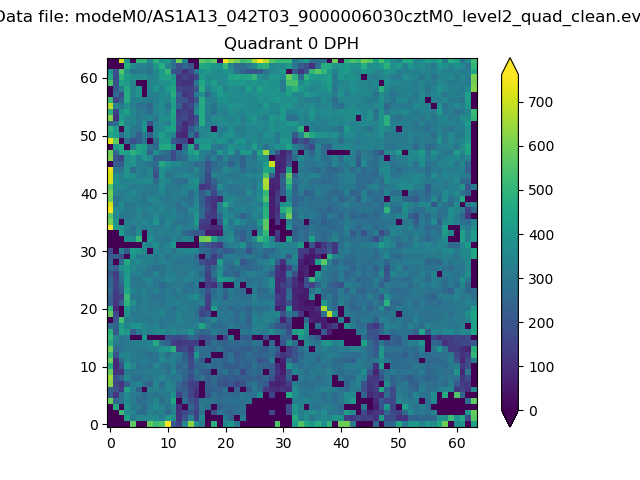 |
 |
Quadrant B |
|---|---|---|---|
| Quadrant D | 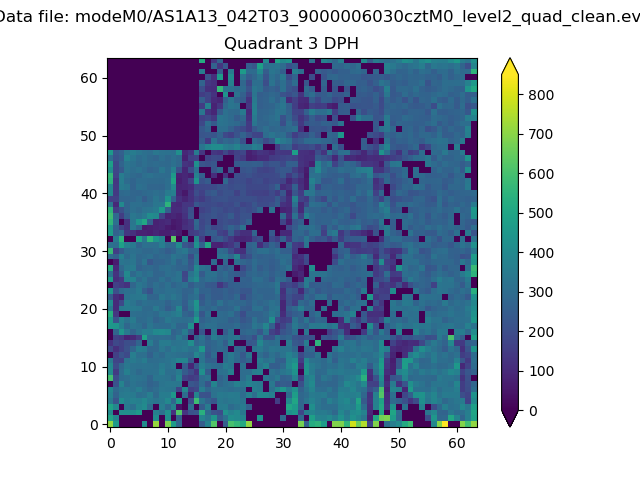 |
 |
Quadrant C |
| Plot type | Count rate plots | Images |
|---|---|---|
| Comparison with Poisson distribution Blue bars denote a histogram of data divided into 1 sec bins. Red curve is a Poisson curve with rate = median count rate of data. |
 |
 |
| Quadrant-wise count rates Data is divided into 100 sec bins |
 |
|
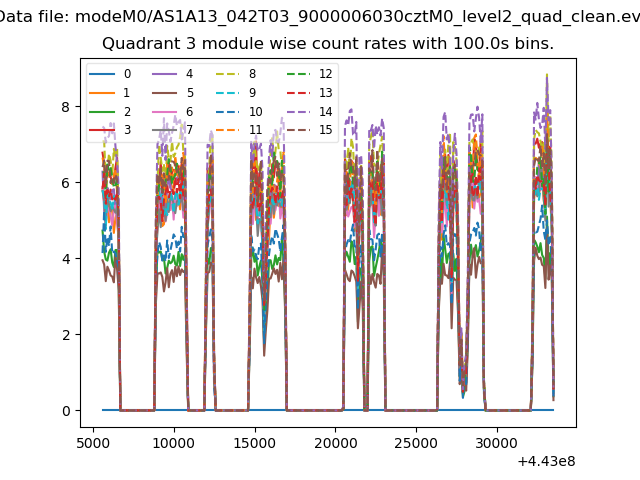
| Module-wise count rates for Quadrant A Data is divided into 100 sec bins |
 |
 |
| Module-wise count rates for Quadrant B Data is divided into 100 sec bins |
 |
 |
| Module-wise count rates for Quadrant C Data is divided into 100 sec bins |
 |
 |
| Module-wise count rates for Quadrant D Data is divided into 100 sec bins |
 |
 |
| Parameter | Plot |
|---|---|
| CZT HV Monitor |  |
| D_VDD |  |
| Temperature 1 |  |
| Veto HV Monitor |  |
| Veto LLD | 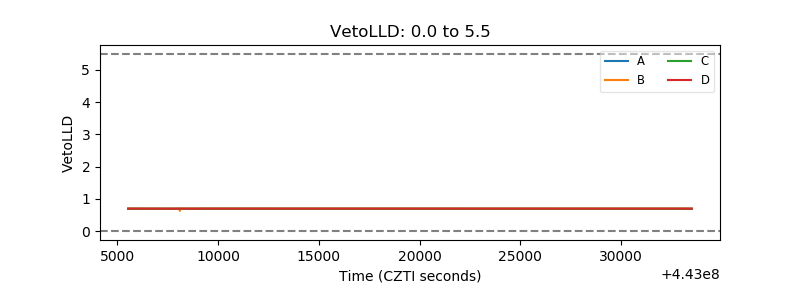 |
| Alpha Counter |  |
| _CPM_Rate | 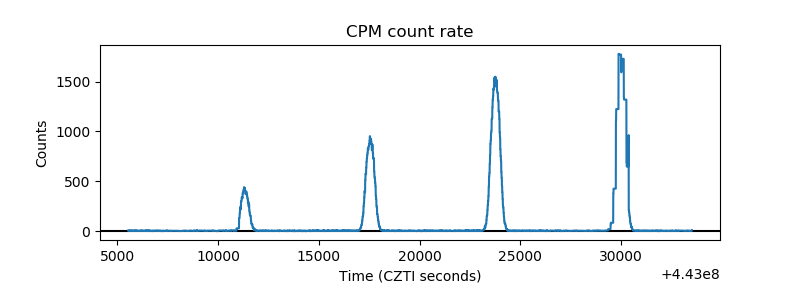 |
| CZT Counter |  |
| +2.5 Volts monitor |  |
| +5 Volts monitor |  |
| _ROLL_ROT |  |
| _Roll_DEC |  |
| _Roll_RA | 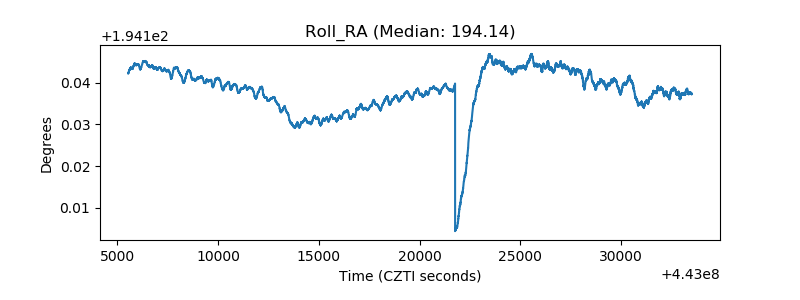 |
| Veto Counter |  |