| Param | Original file | Final file |
|---|---|---|
| Filename | modeM0/AS1A13_020T01_9000006040cztM0_level2.fits | modeM0/AS1A13_020T01_9000006040cztM0_level2_quad_clean.evt |
| Size (bytes) | 4,058,432,640 | 3,879,970,560 |
| Size | 3.8 GB | 3.6 GB |
| Events in quadrant A | 24,288,726 | 22,709,620 |
| Events in quadrant B | 23,479,556 | 23,018,936 |
| Events in quadrant C | 24,657,141 | 22,388,967 |
| Events in quadrant D | 19,086,748 | 18,042,384 |
| Mode SS | |||
|---|---|---|---|
| Quadrant | BADHDUFLAG | Total packets | Discarded packets |
| A | 0 | 9304 | 0 |
| B | 0 | 9304 | 0 |
| C | 0 | 9306 | 0 |
| D | 0 | 9300 | 0 |
| Mode M9 | |||
|---|---|---|---|
| Quadrant | BADHDUFLAG | Total packets | Discarded packets |
| A | 0 | 591 | 0 |
| B | 0 | 591 | 0 |
| C | 0 | 593 | 0 |
| D | 0 | 592 | 0 |
| Mode M0 | |||
|---|---|---|---|
| Quadrant | BADHDUFLAG | Total packets | Discarded packets |
| A | 0 | 1508081 | 0 |
| B | 0 | 1085741 | 0 |
| C | 0 | 997825 | 0 |
| D | 0 | 1908567 | 0 |
| Quadrant | Total seconds | Saturated seconds | Saturation percentage |
|---|---|---|---|
| A | 457742 | 17934 | 3.917928% |
| B | 457790 | 16952 | 3.703008% |
| C | 457794 | 8148 | 1.779840% |
| D | 457643 | 80668 | 17.626840% |
Noise dominated data is calculated using 1-second bins in cleaned event files. If a bin has >2000 counts, and if more than 50% of those come from <1% of pixels, then it is considered to be noise-dominated and hence unusable.
| Quadrant | # 1 sec bins | Bins with >0 counts | Bins with >2000 counts | High rate bins dominated by noise | Noise dominated (total time) | Noise dominated (detector-on time) | Marked lightcurve |
|---|---|---|---|---|---|---|---|
| A | 521658 | 457854 | 0 | 0 | 0.00% | 0.00% |  |
| B | 521658 | 457826 | 0 | 0 | 0.00% | 0.00% | 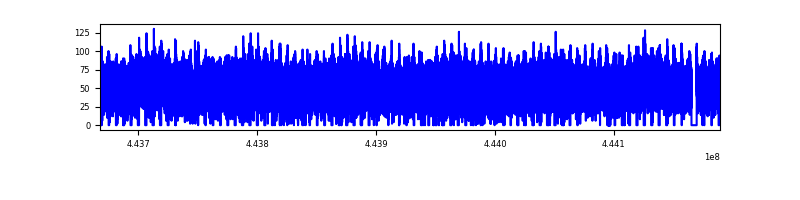 |
| C | 521658 | 457722 | 0 | 0 | 0.00% | 0.00% |  |
| D | 521658 | 456410 | 0 | 0 | 0.00% | 0.00% |  |
Top three noisy pixels from each quadrant. If the there are fewer than three noisy pixels in the level2.evt file, extra rows are filled as -1
| Pixel properties | Quadrant properties | ||||||
|---|---|---|---|---|---|---|---|
| Quadrant | DetID | PixID | Counts | Sigma | Mean | Median | Sigma |
| A | 7 | 110 | 19788 | 8.66 | 6337 | 5900 | 1604.1 |
| A | 15 | 236 | 19639 | 8.57 | 6337 | 5900 | 1604.1 |
| A | 0 | 29 | 18868 | 8.08 | 6337 | 5900 | 1604.1 |
| B | 2 | 9 | 22015 | 13.35 | 6219 | 5906 | 1206.8 |
| B | 2 | 8 | 17723 | 9.79 | 6219 | 5906 | 1206.8 |
| B | 3 | 17 | 17199 | 9.36 | 6219 | 5906 | 1206.8 |
| C | 3 | 202 | 19035 | 7.83 | 6520 | 6068 | 1655.4 |
| C | 1 | 81 | 18748 | 7.66 | 6520 | 6068 | 1655.4 |
| C | 1 | 80 | 18253 | 7.36 | 6520 | 6068 | 1655.4 |
| D | 10 | 189 | 14082 | 6.03 | 5515 | 5007 | 1504.8 |
| D | 15 | 47 | 13904 | 5.91 | 5515 | 5007 | 1504.8 |
| D | 4 | 16 | 13733 | 5.8 | 5515 | 5007 | 1504.8 |
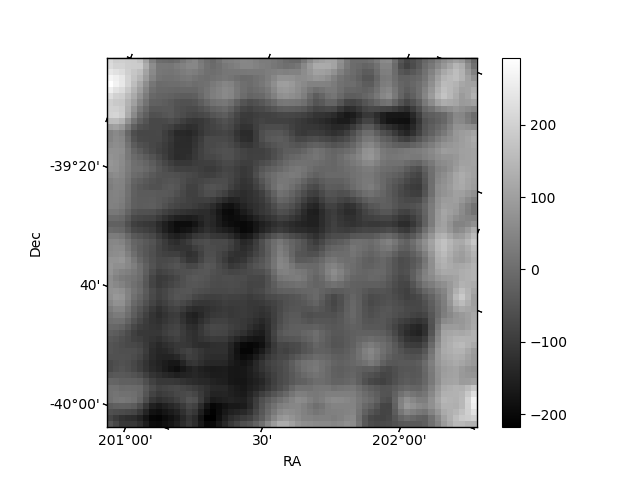
Histogram calculated using DETX and DETY for each event in the final _common_clean file
| Quadrant A |  |
 |
Quadrant B |
|---|---|---|---|
| Quadrant D | 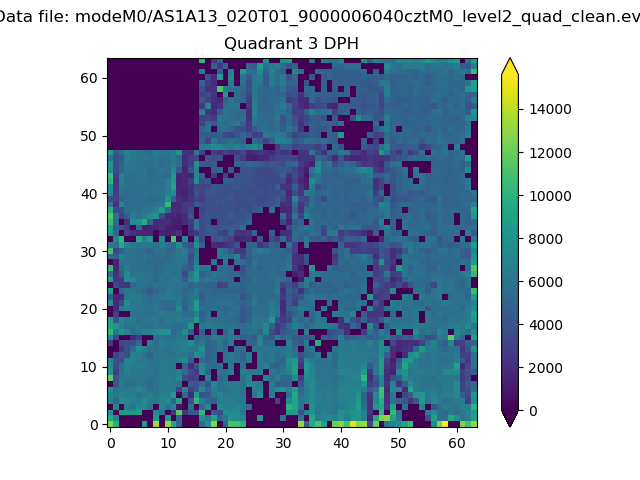 |
 |
Quadrant C |
| Plot type | Count rate plots | Images |
|---|---|---|
| Comparison with Poisson distribution Blue bars denote a histogram of data divided into 1 sec bins. Red curve is a Poisson curve with rate = median count rate of data. |
 |
 |
| Quadrant-wise count rates Data is divided into 100 sec bins |
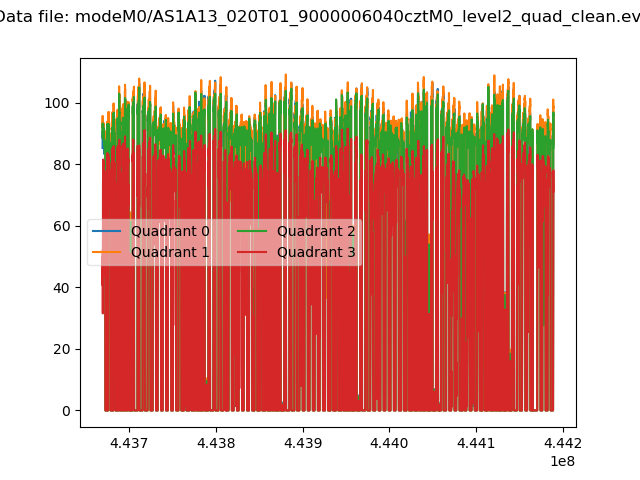 |
|
| Module-wise count rates for Quadrant A Data is divided into 100 sec bins |
 |
 |
| Module-wise count rates for Quadrant B Data is divided into 100 sec bins |
 |
 |
| Module-wise count rates for Quadrant C Data is divided into 100 sec bins |
 |
 |
| Module-wise count rates for Quadrant D Data is divided into 100 sec bins |
 |
 |
| Parameter | Plot |
|---|---|
| CZT HV Monitor |  |
| D_VDD | 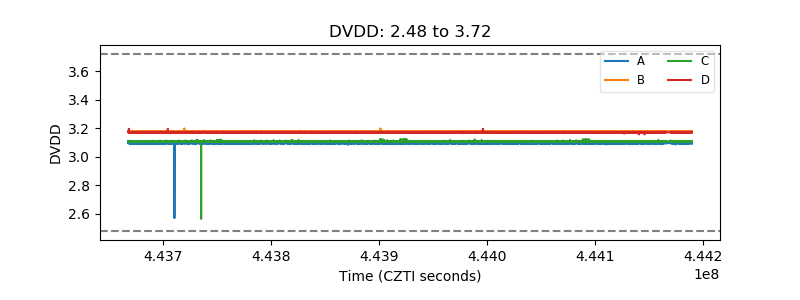 |
| Temperature 1 |  |
| Veto HV Monitor |  |
| Veto LLD |  |
| Alpha Counter | 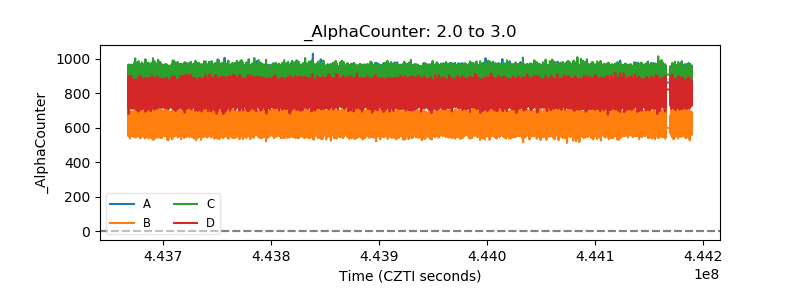 |
| _CPM_Rate | 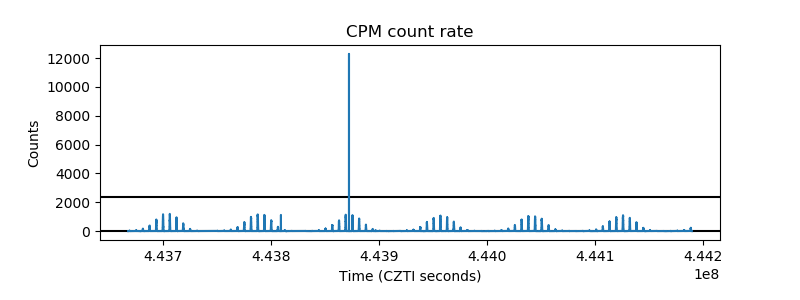 |
| CZT Counter |  |
| +2.5 Volts monitor |  |
| +5 Volts monitor |  |
| _ROLL_ROT |  |
| _Roll_DEC |  |
| _Roll_RA | 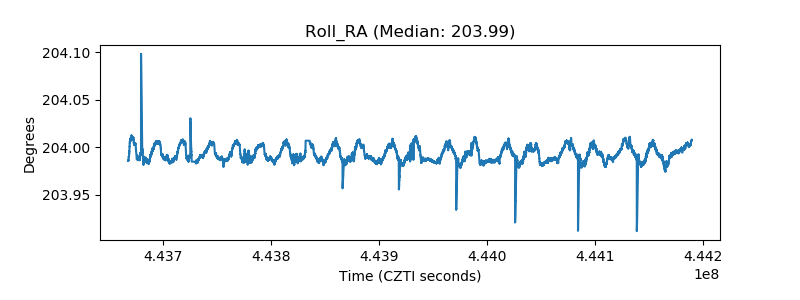 |
| Veto Counter |  |