| Param | Original file | Final file |
|---|---|---|
| Filename | modeM0/AS1A13_017T02_9000006046cztM0_level2.fits | modeM0/AS1A13_017T02_9000006046cztM0_level2_quad_clean.evt |
| Size (bytes) | 994,299,840 | 935,458,560 |
| Size | 948.2 MB | 892.1 MB |
| Events in quadrant A | 5,140,964 | 4,454,304 |
| Events in quadrant B | 5,979,656 | 5,768,030 |
| Events in quadrant C | 6,120,410 | 5,527,685 |
| Events in quadrant D | 5,069,852 | 4,799,267 |
| Mode M0 | |||
|---|---|---|---|
| Quadrant | BADHDUFLAG | Total packets | Discarded packets |
| A | 0 | 541519 | 0 |
| B | 0 | 250872 | 0 |
| C | 0 | 257891 | 0 |
| D | 0 | 357750 | 0 |
| Mode M9 | |||
|---|---|---|---|
| Quadrant | BADHDUFLAG | Total packets | Discarded packets |
| A | 0 | 157 | 0 |
| B | 0 | 157 | 0 |
| C | 0 | 157 | 0 |
| D | 0 | 157 | 0 |
| Mode SS | |||
|---|---|---|---|
| Quadrant | BADHDUFLAG | Total packets | Discarded packets |
| A | 0 | 2302 | 0 |
| B | 0 | 2302 | 0 |
| C | 0 | 2302 | 0 |
| D | 0 | 2302 | 0 |
| Quadrant | Total seconds | Saturated seconds | Saturation percentage |
|---|---|---|---|
| A | 113519 | 32726 | 28.828654% |
| B | 113523 | 2784 | 2.452366% |
| C | 113524 | 3716 | 3.273317% |
| D | 113524 | 10395 | 9.156654% |
Noise dominated data is calculated using 1-second bins in cleaned event files. If a bin has >2000 counts, and if more than 50% of those come from <1% of pixels, then it is considered to be noise-dominated and hence unusable.
| Quadrant | # 1 sec bins | Bins with >0 counts | Bins with >2000 counts | High rate bins dominated by noise | Noise dominated (total time) | Noise dominated (detector-on time) | Marked lightcurve |
|---|---|---|---|---|---|---|---|
| A | 129169 | 111466 | 0 | 0 | 0.00% | 0.00% |  |
| B | 129175 | 113513 | 0 | 0 | 0.00% | 0.00% |  |
| C | 129176 | 113149 | 0 | 0 | 0.00% | 0.00% | 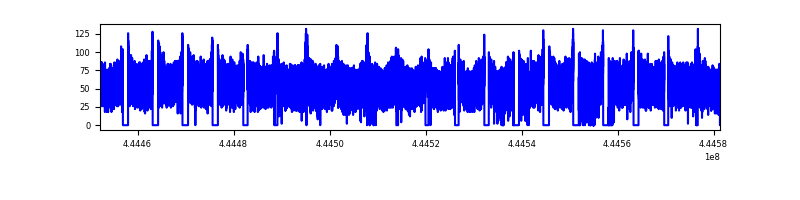 |
| D | 129175 | 113396 | 0 | 0 | 0.00% | 0.00% |  |
Top three noisy pixels from each quadrant. If the there are fewer than three noisy pixels in the level2.evt file, extra rows are filled as -1
| Pixel properties | Quadrant properties | ||||||
|---|---|---|---|---|---|---|---|
| Quadrant | DetID | PixID | Counts | Sigma | Mean | Median | Sigma |
| A | 7 | 110 | 4220 | 8.69 | 1342 | 1251 | 341.8 |
| A | 15 | 236 | 4023 | 8.11 | 1342 | 1251 | 341.8 |
| A | 0 | 29 | 3973 | 7.96 | 1342 | 1251 | 341.8 |
| B | 2 | 9 | 5622 | 13.23 | 1578 | 1497 | 311.7 |
| B | 2 | 8 | 4490 | 9.6 | 1578 | 1497 | 311.7 |
| B | 3 | 17 | 4327 | 9.08 | 1578 | 1497 | 311.7 |
| C | 3 | 202 | 4697 | 7.67 | 1618 | 1501 | 416.6 |
| C | 1 | 81 | 4692 | 7.66 | 1618 | 1501 | 416.6 |
| C | 1 | 80 | 4593 | 7.42 | 1618 | 1501 | 416.6 |
| D | 15 | 47 | 3723 | 5.96 | 1462 | 1329 | 401.7 |
| D | 10 | 189 | 3625 | 5.72 | 1462 | 1329 | 401.7 |
| D | 7 | 3 | 3615 | 5.69 | 1462 | 1329 | 401.7 |
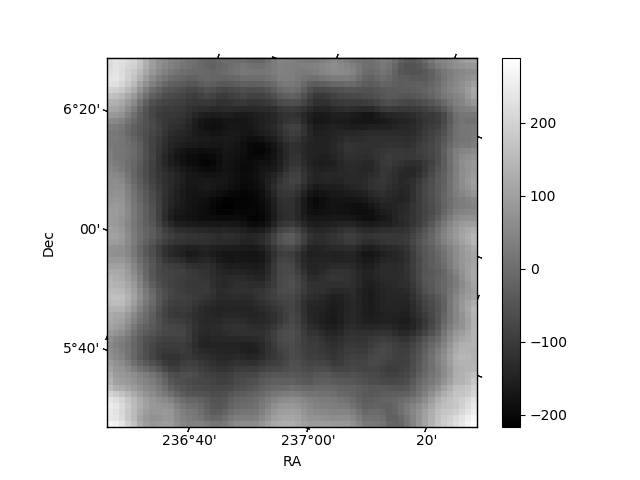
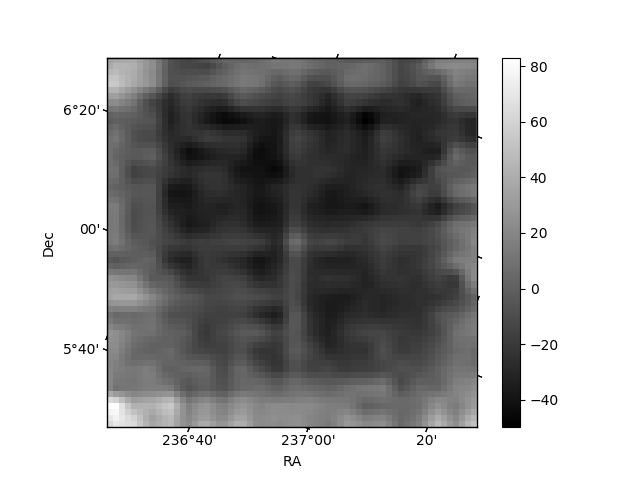
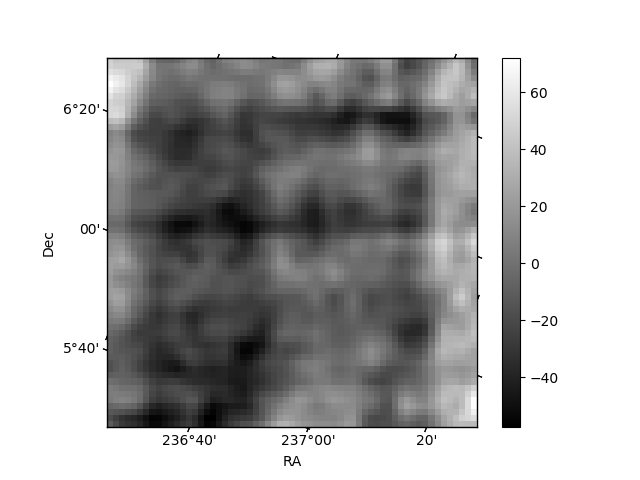
Histogram calculated using DETX and DETY for each event in the final _common_clean file
| Quadrant A | 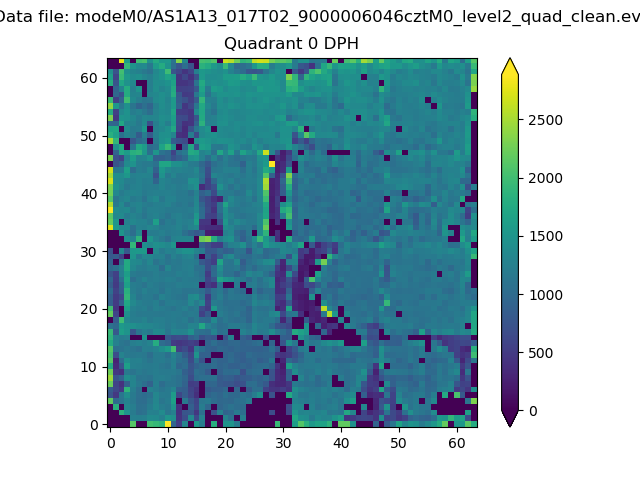 |
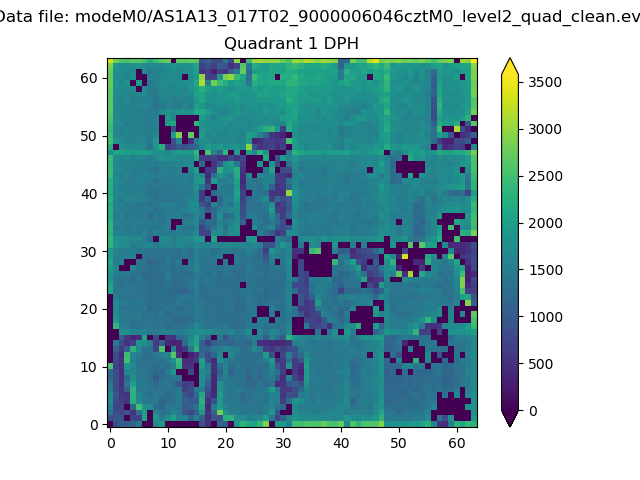 |
Quadrant B |
|---|---|---|---|
| Quadrant D | 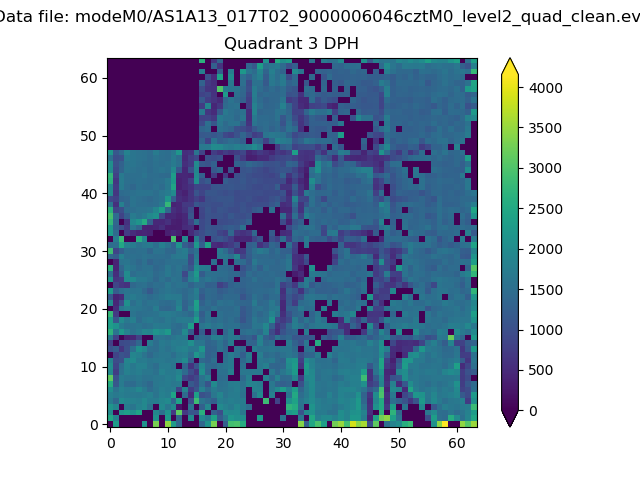 |
 |
Quadrant C |
| Plot type | Count rate plots | Images |
|---|---|---|
| Comparison with Poisson distribution Blue bars denote a histogram of data divided into 1 sec bins. Red curve is a Poisson curve with rate = median count rate of data. |
 |
 |
| Quadrant-wise count rates Data is divided into 100 sec bins |
 |
|
| Module-wise count rates for Quadrant A Data is divided into 100 sec bins |
 |
 |
| Module-wise count rates for Quadrant B Data is divided into 100 sec bins |
 |
 |
| Module-wise count rates for Quadrant C Data is divided into 100 sec bins |
 |
 |
| Module-wise count rates for Quadrant D Data is divided into 100 sec bins |
 |
 |
| Parameter | Plot |
|---|---|
| CZT HV Monitor | 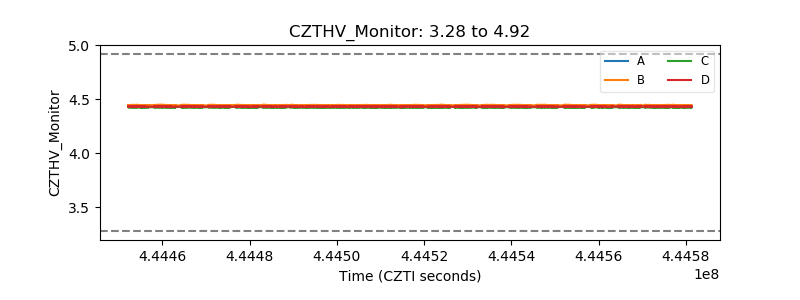 |
| D_VDD | 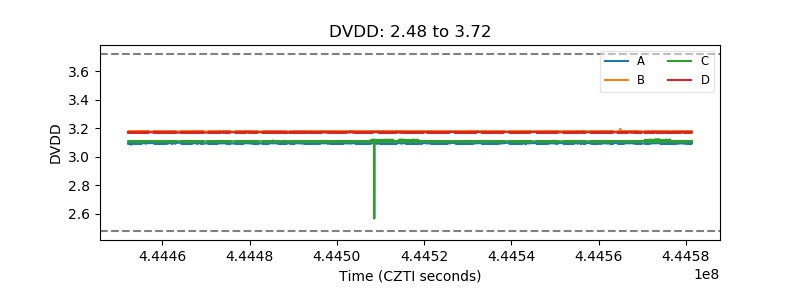 |
| Temperature 1 |  |
| Veto HV Monitor | 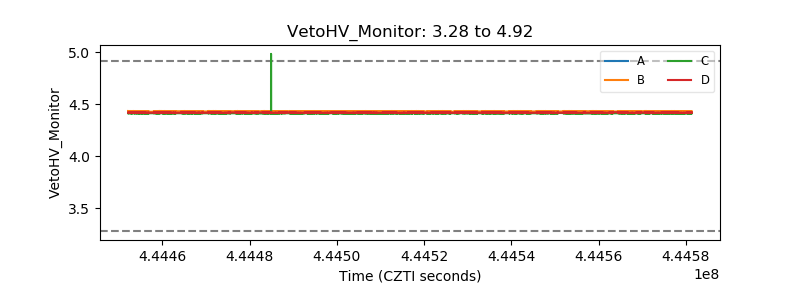 |
| Veto LLD | 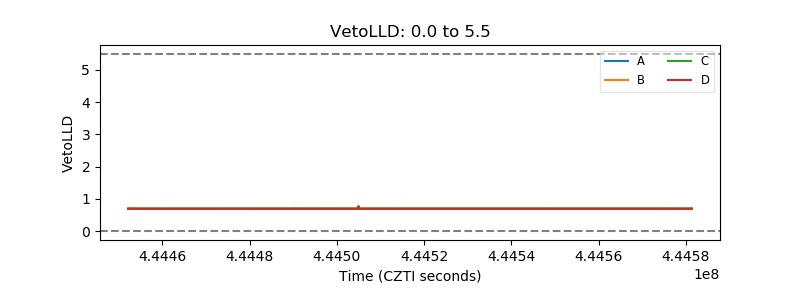 |
| Alpha Counter |  |
| _CPM_Rate |  |
| CZT Counter |  |
| +2.5 Volts monitor |  |
| +5 Volts monitor |  |
| _ROLL_ROT |  |
| _Roll_DEC | 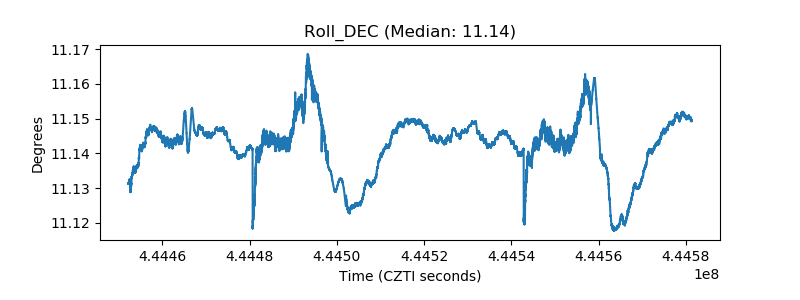 |
| _Roll_RA |  |
| Veto Counter | 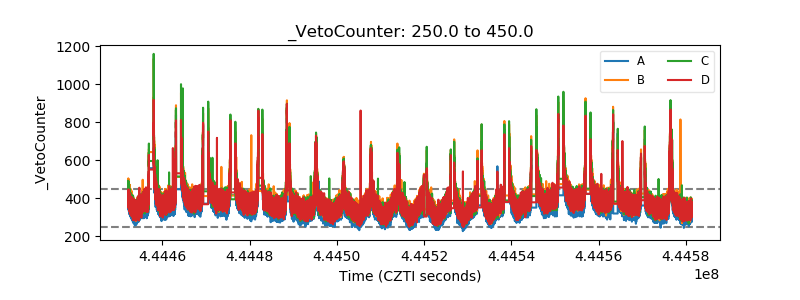 |