| Param | Original file | Final file |
|---|---|---|
| Filename | modeM0/AS1A13_042T05_9000006052cztM0_level2.fits | modeM0/AS1A13_042T05_9000006052cztM0_level2_quad_clean.evt |
| Size (bytes) | 228,288,960 | 218,580,480 |
| Size | 217.7 MB | 208.5 MB |
| Events in quadrant A | 1,421,784 | 1,371,116 |
| Events in quadrant B | 1,385,736 | 1,395,823 |
| Events in quadrant C | 1,459,640 | 1,352,937 |
| Events in quadrant D | 834,186 | 690,461 |
| Mode M9 | |||
|---|---|---|---|
| Quadrant | BADHDUFLAG | Total packets | Discarded packets |
| A | 0 | 10 | 0 |
| B | 0 | 10 | 0 |
| C | 0 | 10 | 0 |
| D | 0 | 10 | 0 |
| Mode M0 | |||
|---|---|---|---|
| Quadrant | BADHDUFLAG | Total packets | Discarded packets |
| A | 0 | 85733 | 0 |
| B | 0 | 64923 | 0 |
| C | 0 | 58692 | 0 |
| D | 0 | 90883 | 0 |
| Mode SS | |||
|---|---|---|---|
| Quadrant | BADHDUFLAG | Total packets | Discarded packets |
| A | 0 | 554 | 0 |
| B | 0 | 554 | 0 |
| C | 0 | 554 | 0 |
| D | 0 | 554 | 0 |
| Quadrant | Total seconds | Saturated seconds | Saturation percentage |
|---|---|---|---|
| A | 27422 | 1134 | 4.135366% |
| B | 27420 | 1148 | 4.186725% |
| C | 27422 | 394 | 1.436803% |
| D | 22617 | 6192 | 27.377636% |
Noise dominated data is calculated using 1-second bins in cleaned event files. If a bin has >2000 counts, and if more than 50% of those come from <1% of pixels, then it is considered to be noise-dominated and hence unusable.
| Quadrant | # 1 sec bins | Bins with >0 counts | Bins with >2000 counts | High rate bins dominated by noise | Noise dominated (total time) | Noise dominated (detector-on time) | Marked lightcurve |
|---|---|---|---|---|---|---|---|
| A | 28422 | 27421 | 0 | 0 | 0.00% | 0.00% |  |
| B | 28422 | 27412 | 0 | 0 | 0.00% | 0.00% |  |
| C | 28422 | 27422 | 0 | 0 | 0.00% | 0.00% |  |
| D | 28422 | 21454 | 0 | 0 | 0.00% | 0.00% |  |
Top three noisy pixels from each quadrant. If the there are fewer than three noisy pixels in the level2.evt file, extra rows are filled as -1
| Pixel properties | Quadrant properties | ||||||
|---|---|---|---|---|---|---|---|
| Quadrant | DetID | PixID | Counts | Sigma | Mean | Median | Sigma |
| A | 15 | 236 | 1199 | 8.81 | 370 | 344 | 97.1 |
| A | 7 | 110 | 1172 | 8.53 | 370 | 344 | 97.1 |
| A | 0 | 29 | 1081 | 7.59 | 370 | 344 | 97.1 |
| B | 2 | 9 | 1298 | 12.22 | 365 | 344 | 78.1 |
| B | 2 | 8 | 1035 | 8.85 | 365 | 344 | 78.1 |
| B | 3 | 17 | 1004 | 8.45 | 365 | 344 | 78.1 |
| C | 3 | 202 | 1168 | 7.91 | 385 | 355 | 102.8 |
| C | 1 | 81 | 1163 | 7.86 | 385 | 355 | 102.8 |
| C | 1 | 80 | 1134 | 7.58 | 385 | 355 | 102.8 |
| D | 10 | 189 | 621 | 5.9 | 239 | 215 | 68.8 |
| D | 4 | 16 | 617 | 5.84 | 239 | 215 | 68.8 |
| D | 6 | 79 | 613 | 5.78 | 239 | 215 | 68.8 |
Histogram calculated using DETX and DETY for each event in the final _common_clean file
| Quadrant A | 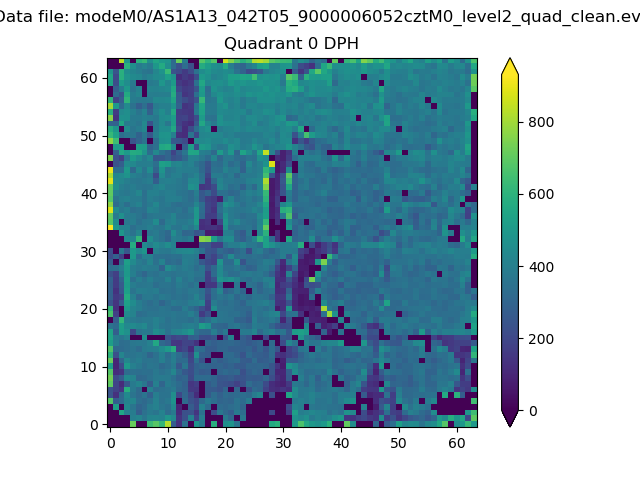 |
 |
Quadrant B |
|---|---|---|---|
| Quadrant D |  |
 |
Quadrant C |
| Plot type | Count rate plots | Images |
|---|---|---|
| Comparison with Poisson distribution Blue bars denote a histogram of data divided into 1 sec bins. Red curve is a Poisson curve with rate = median count rate of data. |
 |
 |
| Quadrant-wise count rates Data is divided into 100 sec bins |
 |
|
| Module-wise count rates for Quadrant A Data is divided into 100 sec bins |
 |
 |
| Module-wise count rates for Quadrant B Data is divided into 100 sec bins |
 |
 |
| Module-wise count rates for Quadrant C Data is divided into 100 sec bins |
 |
 |
| Module-wise count rates for Quadrant D Data is divided into 100 sec bins |
 |
 |
| Parameter | Plot |
|---|---|
| CZT HV Monitor |  |
| D_VDD |  |
| Temperature 1 |  |
| Veto HV Monitor |  |
| Veto LLD |  |
| Alpha Counter |  |
| _CPM_Rate |  |
| CZT Counter |  |
| +2.5 Volts monitor |  |
| +5 Volts monitor |  |
| _ROLL_ROT |  |
| _Roll_DEC |  |
| _Roll_RA |  |
| Veto Counter |  |