| Param | Original file | Final file |
|---|---|---|
| Filename | modeM0/AS1A13_049T06_9000006054cztM0_level2.fits | modeM0/AS1A13_049T06_9000006054cztM0_level2_quad_clean.evt |
| Size (bytes) | 1,008,420,480 | 987,071,040 |
| Size | 961.7 MB | 941.3 MB |
| Events in quadrant A | 6,012,564 | 5,852,661 |
| Events in quadrant B | 5,866,954 | 5,980,602 |
| Events in quadrant C | 6,147,044 | 5,707,945 |
| Events in quadrant D | 4,799,024 | 4,644,367 |
| Mode M0 | |||
|---|---|---|---|
| Quadrant | BADHDUFLAG | Total packets | Discarded packets |
| A | 0 | 358285 | 0 |
| B | 0 | 264638 | 0 |
| C | 0 | 249643 | 0 |
| D | 0 | 337137 | 0 |
| Mode M9 | |||
|---|---|---|---|
| Quadrant | BADHDUFLAG | Total packets | Discarded packets |
| A | 0 | 176 | 0 |
| B | 0 | 176 | 0 |
| C | 0 | 176 | 0 |
| D | 0 | 176 | 0 |
| Mode SS | |||
|---|---|---|---|
| Quadrant | BADHDUFLAG | Total packets | Discarded packets |
| A | 0 | 2316 | 0 |
| B | 0 | 2316 | 0 |
| C | 0 | 2316 | 0 |
| D | 0 | 2316 | 0 |
| Quadrant | Total seconds | Saturated seconds | Saturation percentage |
|---|---|---|---|
| A | 113588 | 3118 | 2.745008% |
| B | 113579 | 3121 | 2.747867% |
| C | 113578 | 1955 | 1.721284% |
| D | 108791 | 9825 | 9.031078% |
Noise dominated data is calculated using 1-second bins in cleaned event files. If a bin has >2000 counts, and if more than 50% of those come from <1% of pixels, then it is considered to be noise-dominated and hence unusable.
| Quadrant | # 1 sec bins | Bins with >0 counts | Bins with >2000 counts | High rate bins dominated by noise | Noise dominated (total time) | Noise dominated (detector-on time) | Marked lightcurve |
|---|---|---|---|---|---|---|---|
| A | 133655 | 113578 | 0 | 0 | 0.00% | 0.00% |  |
| B | 133655 | 113562 | 0 | 0 | 0.00% | 0.00% |  |
| C | 133655 | 113570 | 0 | 0 | 0.00% | 0.00% |  |
| D | 133655 | 108333 | 0 | 0 | 0.00% | 0.00% |  |
Top three noisy pixels from each quadrant. If the there are fewer than three noisy pixels in the level2.evt file, extra rows are filled as -1
| Pixel properties | Quadrant properties | ||||||
|---|---|---|---|---|---|---|---|
| Quadrant | DetID | PixID | Counts | Sigma | Mean | Median | Sigma |
| A | 7 | 110 | 4969 | 8.82 | 1566 | 1461 | 397.7 |
| A | 15 | 236 | 4836 | 8.49 | 1566 | 1461 | 397.7 |
| A | 0 | 29 | 4608 | 7.91 | 1566 | 1461 | 397.7 |
| B | 2 | 9 | 5455 | 13.12 | 1550 | 1471 | 303.8 |
| B | 2 | 8 | 4392 | 9.62 | 1550 | 1471 | 303.8 |
| B | 3 | 17 | 4306 | 9.33 | 1550 | 1471 | 303.8 |
| C | 1 | 81 | 4722 | 7.72 | 1625 | 1512 | 416.0 |
| C | 3 | 202 | 4696 | 7.65 | 1625 | 1512 | 416.0 |
| C | 3 | 203 | 4570 | 7.35 | 1625 | 1512 | 416.0 |
| D | 10 | 189 | 3581 | 6.17 | 1379 | 1253 | 377.4 |
| D | 12 | 6 | 3530 | 6.03 | 1379 | 1253 | 377.4 |
| D | 15 | 47 | 3522 | 6.01 | 1379 | 1253 | 377.4 |
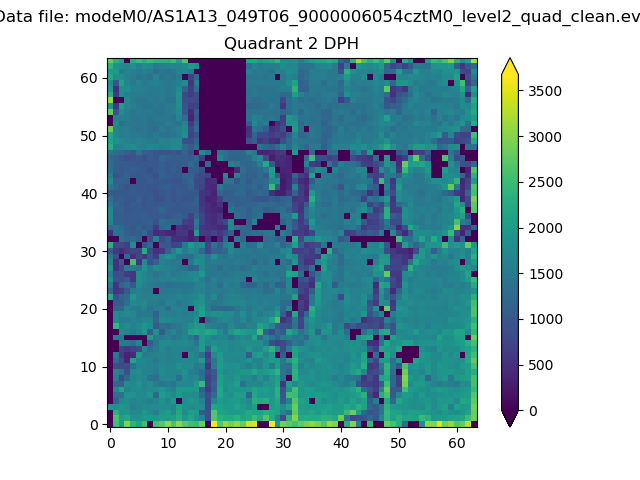
Histogram calculated using DETX and DETY for each event in the final _common_clean file
| Quadrant A | 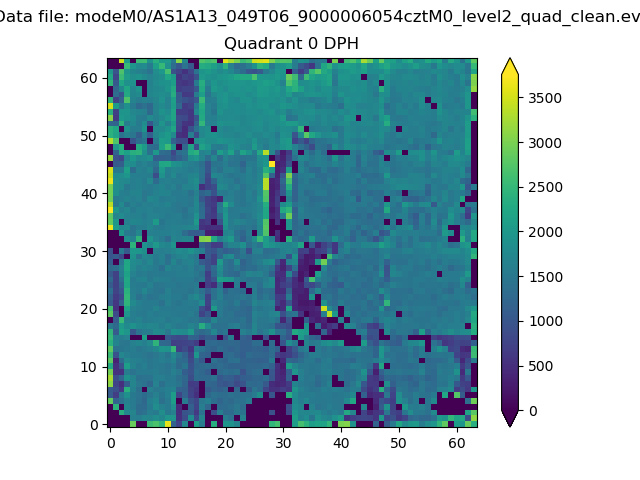 |
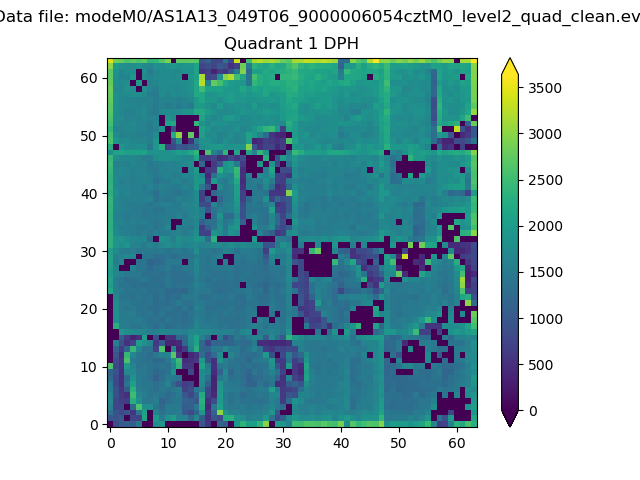 |
Quadrant B |
|---|---|---|---|
| Quadrant D | 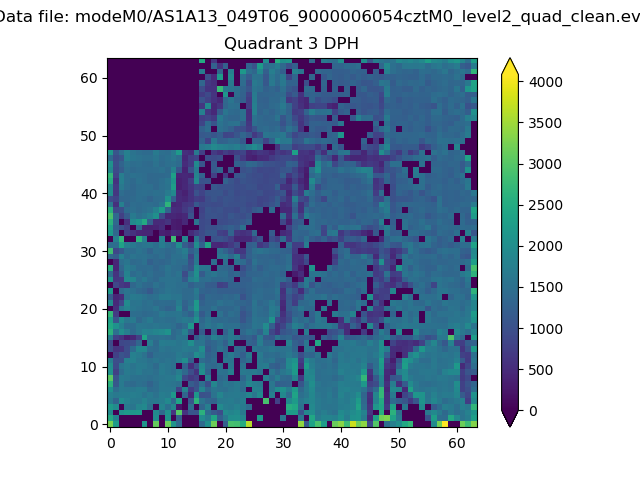 |
 |
Quadrant C |
| Plot type | Count rate plots | Images |
|---|---|---|
| Comparison with Poisson distribution Blue bars denote a histogram of data divided into 1 sec bins. Red curve is a Poisson curve with rate = median count rate of data. |
 |
 |
| Quadrant-wise count rates Data is divided into 100 sec bins |
 |
|
| Module-wise count rates for Quadrant A Data is divided into 100 sec bins |
 |
 |
| Module-wise count rates for Quadrant B Data is divided into 100 sec bins |
 |
 |
| Module-wise count rates for Quadrant C Data is divided into 100 sec bins |
 |
 |
| Module-wise count rates for Quadrant D Data is divided into 100 sec bins |
 |
 |
| Parameter | Plot |
|---|---|
| CZT HV Monitor |  |
| D_VDD | 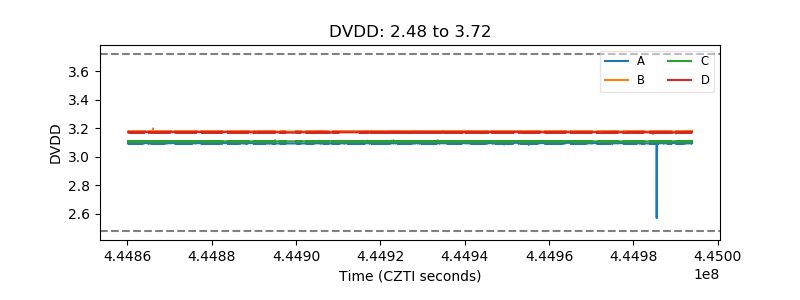 |
| Temperature 1 |  |
| Veto HV Monitor |  |
| Veto LLD |  |
| Alpha Counter |  |
| _CPM_Rate |  |
| CZT Counter |  |
| +2.5 Volts monitor |  |
| +5 Volts monitor |  |
| _ROLL_ROT |  |
| _Roll_DEC |  |
| _Roll_RA |  |
| Veto Counter |  |