| Param | Original file | Final file |
|---|---|---|
| Filename | modeM0/AS1A13_049T07_9000006056cztM0_level2.fits | modeM0/AS1A13_049T07_9000006056cztM0_level2_quad_clean.evt |
| Size (bytes) | 794,903,040 | 812,908,800 |
| Size | 758.1 MB | 775.3 MB |
| Events in quadrant A | 4,685,890 | 4,851,590 |
| Events in quadrant B | 4,582,338 | 4,930,865 |
| Events in quadrant C | 4,802,822 | 4,737,804 |
| Events in quadrant D | 3,837,124 | 3,941,149 |
| Mode M0 | |||
|---|---|---|---|
| Quadrant | BADHDUFLAG | Total packets | Discarded packets |
| A | 0 | 285462 | 0 |
| B | 0 | 205917 | 0 |
| C | 0 | 195129 | 0 |
| D | 0 | 311889 | 0 |
| Mode M9 | |||
|---|---|---|---|
| Quadrant | BADHDUFLAG | Total packets | Discarded packets |
| A | 0 | 100 | 0 |
| B | 0 | 100 | 0 |
| C | 0 | 100 | 0 |
| D | 0 | 100 | 0 |
| Mode SS | |||
|---|---|---|---|
| Quadrant | BADHDUFLAG | Total packets | Discarded packets |
| A | 0 | 1822 | 0 |
| B | 0 | 1822 | 0 |
| C | 0 | 1822 | 0 |
| D | 0 | 1822 | 0 |
| Quadrant | Total seconds | Saturated seconds | Saturation percentage |
|---|---|---|---|
| A | 89832 | 3246 | 3.613412% |
| B | 89825 | 2948 | 3.281937% |
| C | 89822 | 1532 | 1.705596% |
| D | 89800 | 11563 | 12.876392% |
Noise dominated data is calculated using 1-second bins in cleaned event files. If a bin has >2000 counts, and if more than 50% of those come from <1% of pixels, then it is considered to be noise-dominated and hence unusable.
| Quadrant | # 1 sec bins | Bins with >0 counts | Bins with >2000 counts | High rate bins dominated by noise | Noise dominated (total time) | Noise dominated (detector-on time) | Marked lightcurve |
|---|---|---|---|---|---|---|---|
| A | 99924 | 89838 | 0 | 0 | 0.00% | 0.00% | 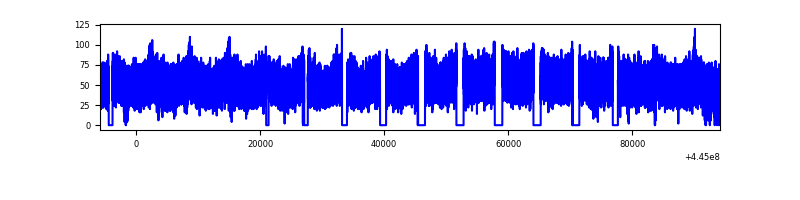 |
| B | 99924 | 89825 | 0 | 0 | 0.00% | 0.00% | 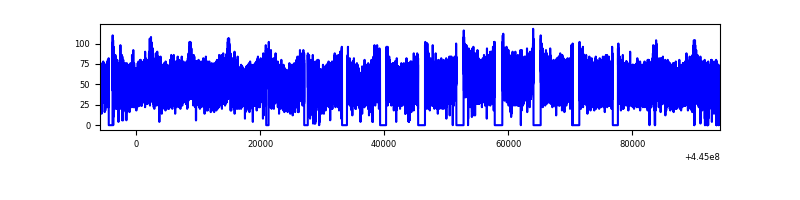 |
| C | 99924 | 89834 | 0 | 0 | 0.00% | 0.00% | 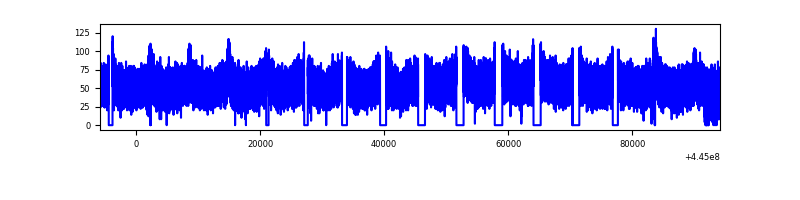 |
| D | 99924 | 89673 | 0 | 0 | 0.00% | 0.00% | 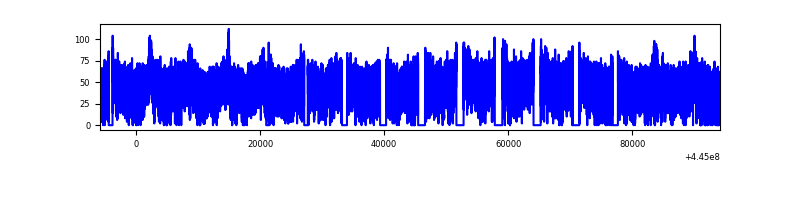 |
Top three noisy pixels from each quadrant. If the there are fewer than three noisy pixels in the level2.evt file, extra rows are filled as -1
| Pixel properties | Quadrant properties | ||||||
|---|---|---|---|---|---|---|---|
| Quadrant | DetID | PixID | Counts | Sigma | Mean | Median | Sigma |
| A | 7 | 110 | 3921 | 8.82 | 1221 | 1135 | 315.9 |
| A | 15 | 236 | 3737 | 8.24 | 1221 | 1135 | 315.9 |
| A | 0 | 29 | 3654 | 7.97 | 1221 | 1135 | 315.9 |
| B | 2 | 9 | 4249 | 13.14 | 1210 | 1151 | 235.7 |
| B | 2 | 8 | 3433 | 9.68 | 1210 | 1151 | 235.7 |
| B | 3 | 17 | 3408 | 9.58 | 1210 | 1151 | 235.7 |
| C | 3 | 202 | 3684 | 7.76 | 1269 | 1182 | 322.5 |
| C | 3 | 203 | 3578 | 7.43 | 1269 | 1182 | 322.5 |
| C | 1 | 81 | 3574 | 7.42 | 1269 | 1182 | 322.5 |
| D | 10 | 189 | 2865 | 6.14 | 1105 | 1005 | 303.0 |
| D | 15 | 47 | 2773 | 5.83 | 1105 | 1005 | 303.0 |
| D | 6 | 38 | 2739 | 5.72 | 1105 | 1005 | 303.0 |
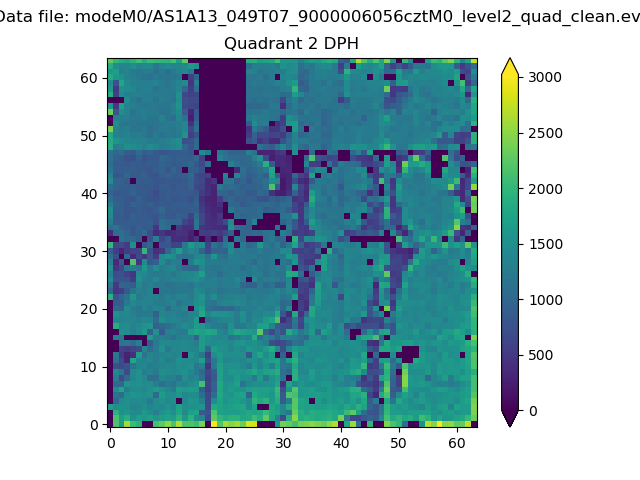
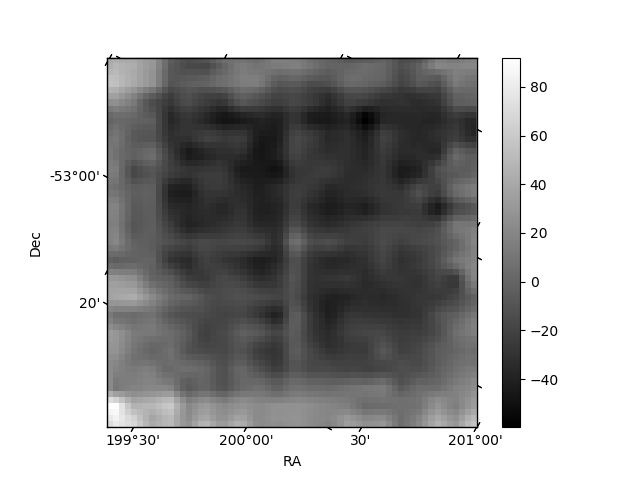
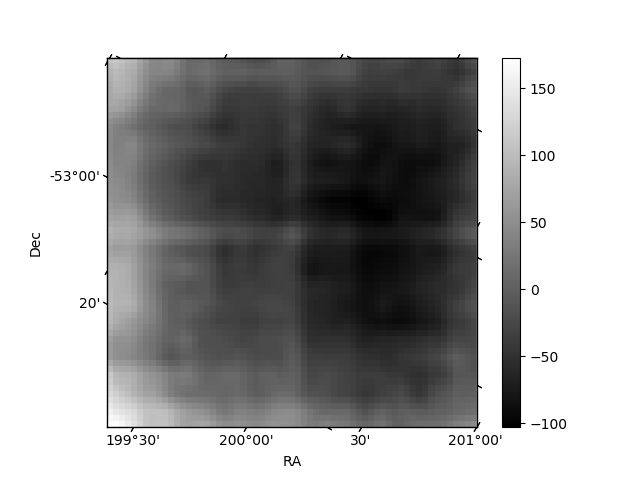
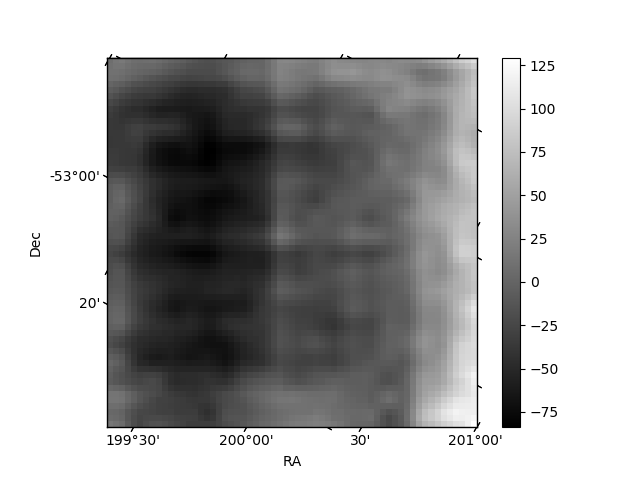
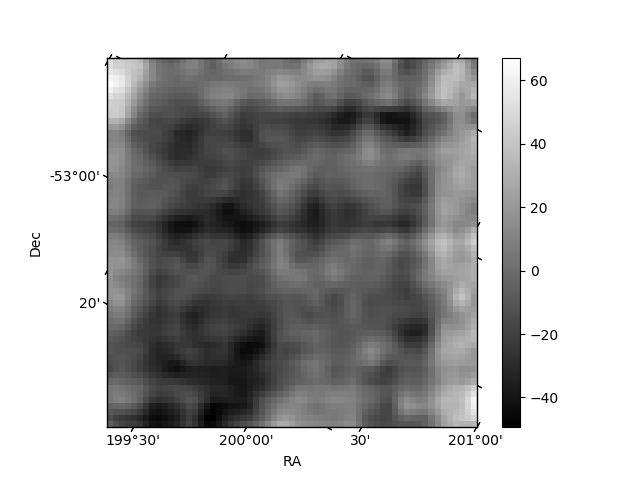
Histogram calculated using DETX and DETY for each event in the final _common_clean file
| Quadrant A | 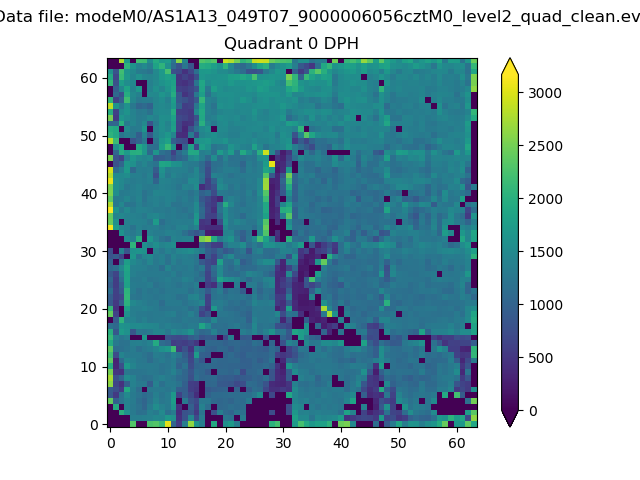 |
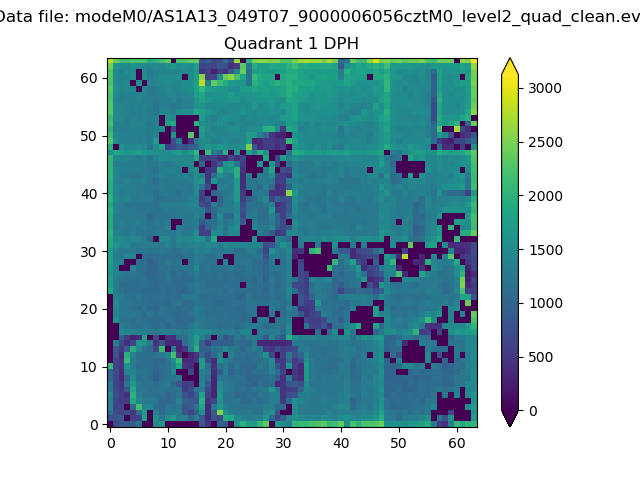 |
Quadrant B |
|---|---|---|---|
| Quadrant D | 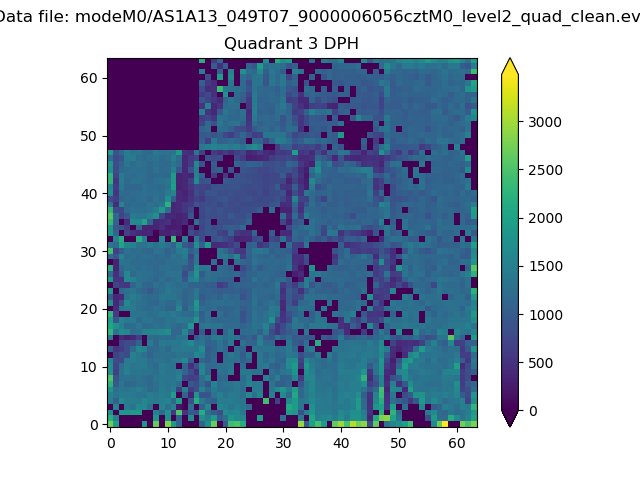 |
 |
Quadrant C |
| Plot type | Count rate plots | Images |
|---|---|---|
| Comparison with Poisson distribution Blue bars denote a histogram of data divided into 1 sec bins. Red curve is a Poisson curve with rate = median count rate of data. |
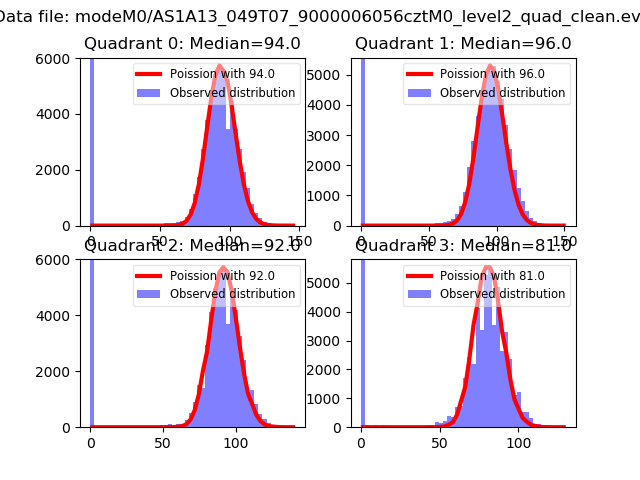 |
 |
| Quadrant-wise count rates Data is divided into 100 sec bins |
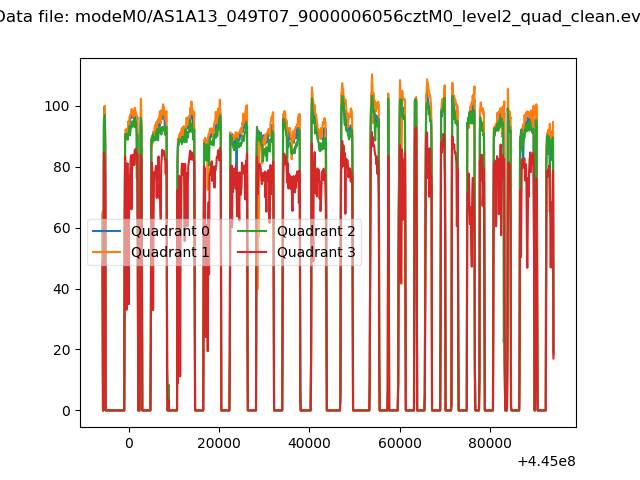 |
|
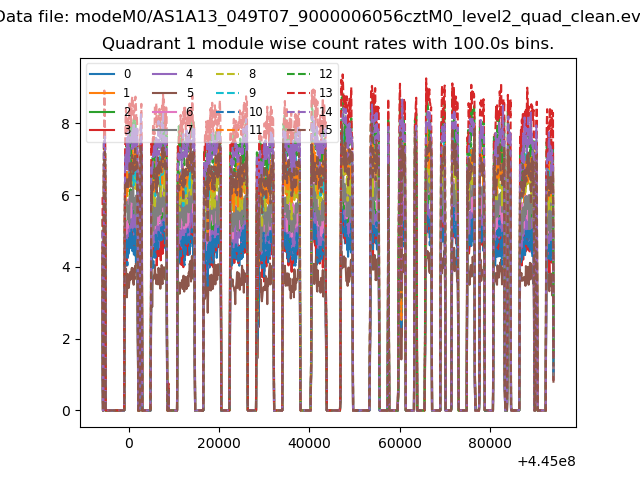
| Module-wise count rates for Quadrant A Data is divided into 100 sec bins |
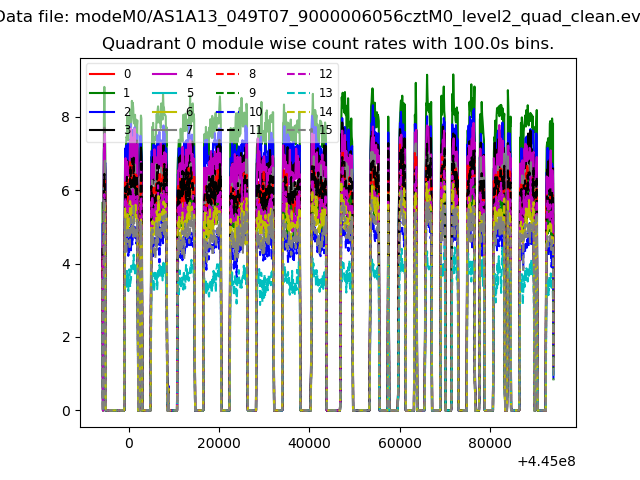 |
 |
| Module-wise count rates for Quadrant B Data is divided into 100 sec bins |
 |
 |
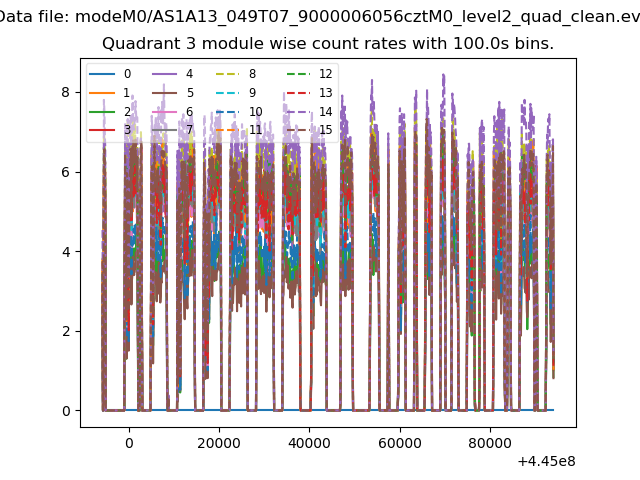
| Module-wise count rates for Quadrant C Data is divided into 100 sec bins |
 |
 |
| Module-wise count rates for Quadrant D Data is divided into 100 sec bins |
 |
 |
| Parameter | Plot |
|---|---|
| CZT HV Monitor | 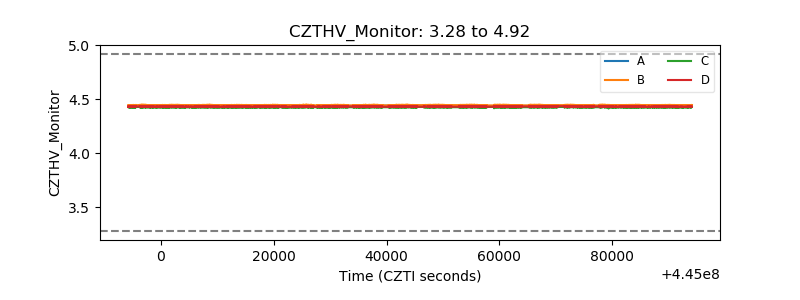 |
| D_VDD | 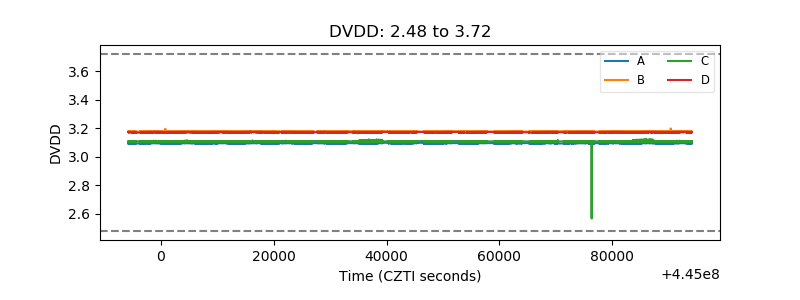 |
| Temperature 1 | 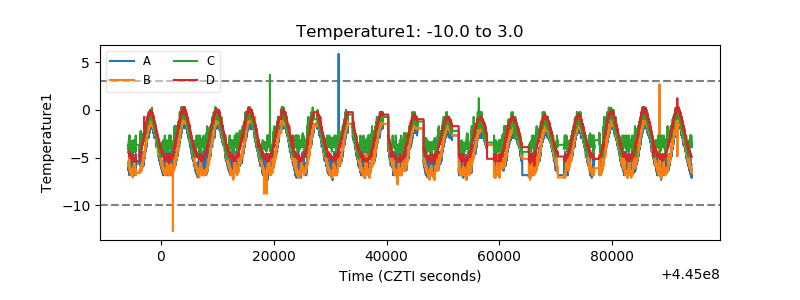 |
| Veto HV Monitor |  |
| Veto LLD | 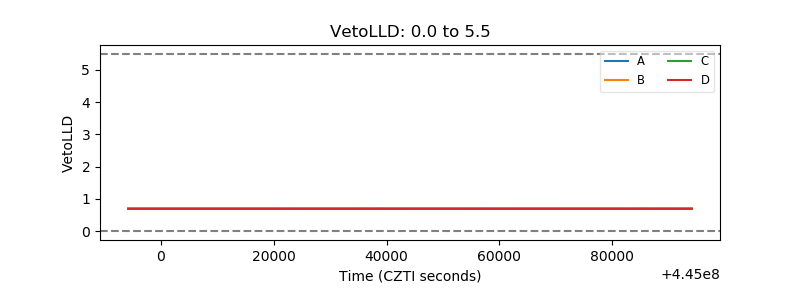 |
| Alpha Counter | 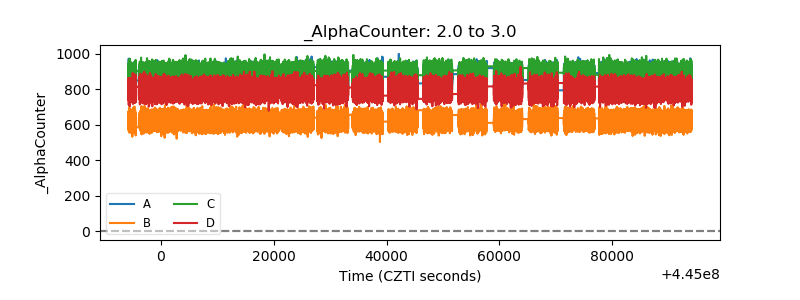 |
| _CPM_Rate |  |
| CZT Counter | 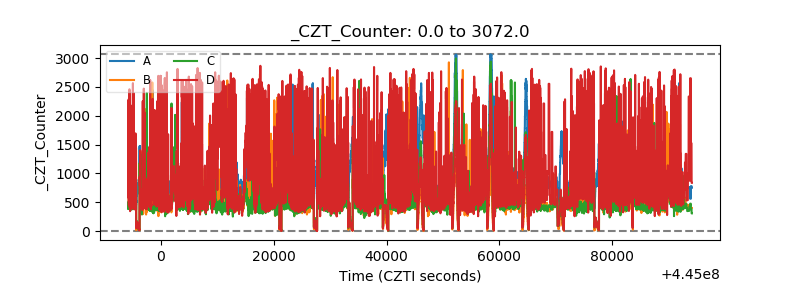 |
| +2.5 Volts monitor | 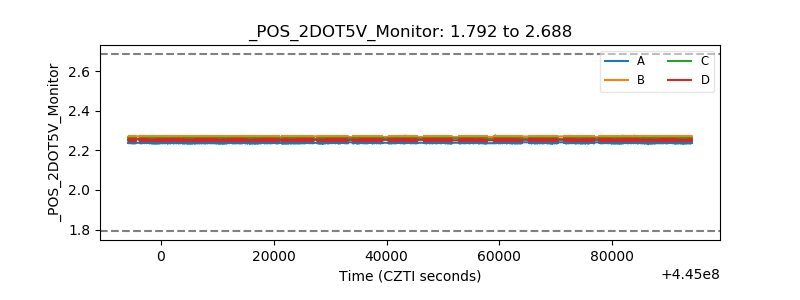 |
| +5 Volts monitor | 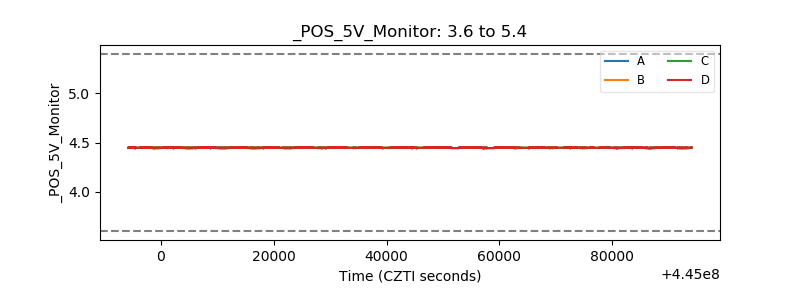 |
| _ROLL_ROT | 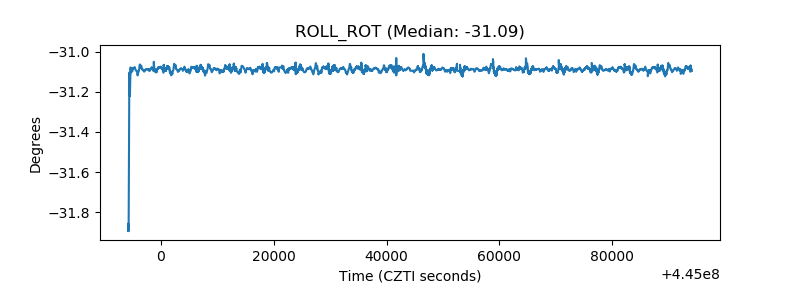 |
| _Roll_DEC |  |
| _Roll_RA |  |
| Veto Counter |  |