| Param | Original file | Final file |
|---|---|---|
| Filename | modeM0/AS1A13_073T04_9000006066cztM0_level2.fits | modeM0/AS1A13_073T04_9000006066cztM0_level2_quad_clean.evt |
| Size (bytes) | 638,069,760 | 635,857,920 |
| Size | 608.5 MB | 606.4 MB |
| Events in quadrant A | 3,735,770 | 3,648,875 |
| Events in quadrant B | 3,669,792 | 3,769,414 |
| Events in quadrant C | 3,780,048 | 3,633,216 |
| Events in quadrant D | 3,200,934 | 3,270,435 |
| Mode SS | |||
|---|---|---|---|
| Quadrant | BADHDUFLAG | Total packets | Discarded packets |
| A | 0 | 1458 | 0 |
| B | 0 | 1458 | 0 |
| C | 0 | 1458 | 0 |
| D | 0 | 1458 | 0 |
| Mode M9 | |||
|---|---|---|---|
| Quadrant | BADHDUFLAG | Total packets | Discarded packets |
| A | 0 | 75 | 0 |
| B | 0 | 75 | 0 |
| C | 0 | 75 | 0 |
| D | 0 | 75 | 0 |
| Mode M0 | |||
|---|---|---|---|
| Quadrant | BADHDUFLAG | Total packets | Discarded packets |
| A | 0 | 227993 | 0 |
| B | 0 | 155681 | 0 |
| C | 0 | 159722 | 0 |
| D | 0 | 195373 | 0 |
| Quadrant | Total seconds | Saturated seconds | Saturation percentage |
|---|---|---|---|
| A | 71964 | 1791 | 2.488744% |
| B | 71965 | 1334 | 1.853679% |
| C | 71966 | 1297 | 1.802240% |
| D | 71966 | 3078 | 4.277020% |
Noise dominated data is calculated using 1-second bins in cleaned event files. If a bin has >2000 counts, and if more than 50% of those come from <1% of pixels, then it is considered to be noise-dominated and hence unusable.
| Quadrant | # 1 sec bins | Bins with >0 counts | Bins with >2000 counts | High rate bins dominated by noise | Noise dominated (total time) | Noise dominated (detector-on time) | Marked lightcurve |
|---|---|---|---|---|---|---|---|
| A | 97188 | 71955 | 0 | 0 | 0.00% | 0.00% |  |
| B | 97187 | 71952 | 0 | 0 | 0.00% | 0.00% | 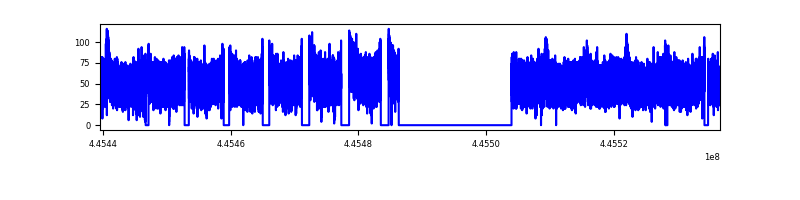 |
| C | 97187 | 71944 | 0 | 0 | 0.00% | 0.00% |  |
| D | 97187 | 71923 | 0 | 0 | 0.00% | 0.00% |  |
Top three noisy pixels from each quadrant. If the there are fewer than three noisy pixels in the level2.evt file, extra rows are filled as -1
| Pixel properties | Quadrant properties | ||||||
|---|---|---|---|---|---|---|---|
| Quadrant | DetID | PixID | Counts | Sigma | Mean | Median | Sigma |
| A | 7 | 110 | 3124 | 8.8 | 972 | 905 | 252.2 |
| A | 15 | 236 | 3037 | 8.45 | 972 | 905 | 252.2 |
| A | 7 | 109 | 2873 | 7.8 | 972 | 905 | 252.2 |
| B | 2 | 9 | 3416 | 12.89 | 967 | 919 | 193.7 |
| B | 2 | 8 | 2679 | 9.08 | 967 | 919 | 193.7 |
| B | 3 | 17 | 2656 | 8.96 | 967 | 919 | 193.7 |
| C | 3 | 202 | 2941 | 7.67 | 999 | 926 | 262.8 |
| C | 1 | 81 | 2892 | 7.48 | 999 | 926 | 262.8 |
| C | 3 | 203 | 2837 | 7.27 | 999 | 926 | 262.8 |
| D | 3 | 14 | 2376 | 5.98 | 919 | 834 | 257.7 |
| D | 10 | 189 | 2334 | 5.82 | 919 | 834 | 257.7 |
| D | 6 | 79 | 2295 | 5.67 | 919 | 834 | 257.7 |
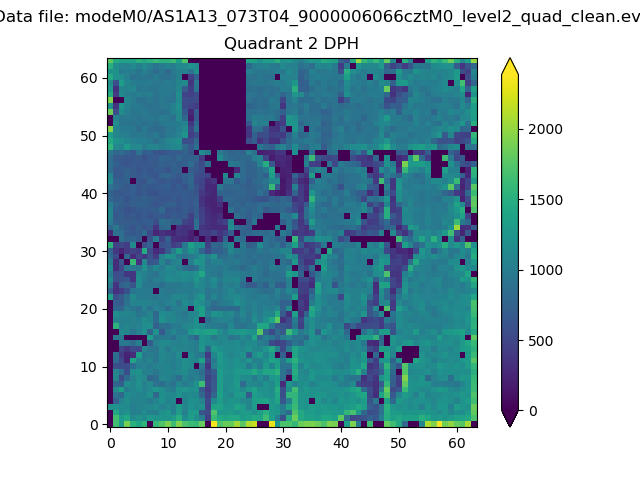
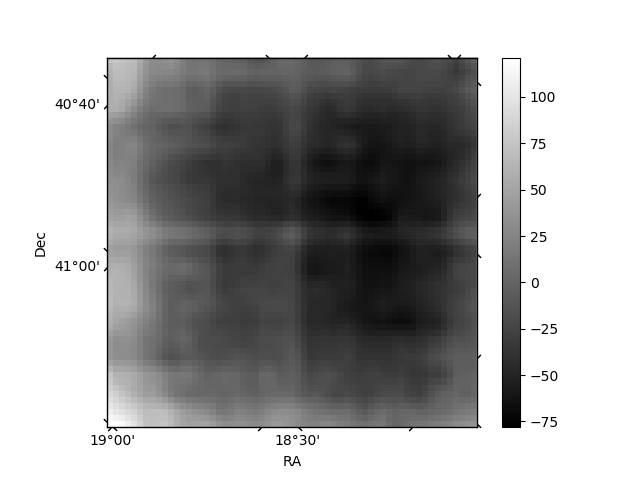
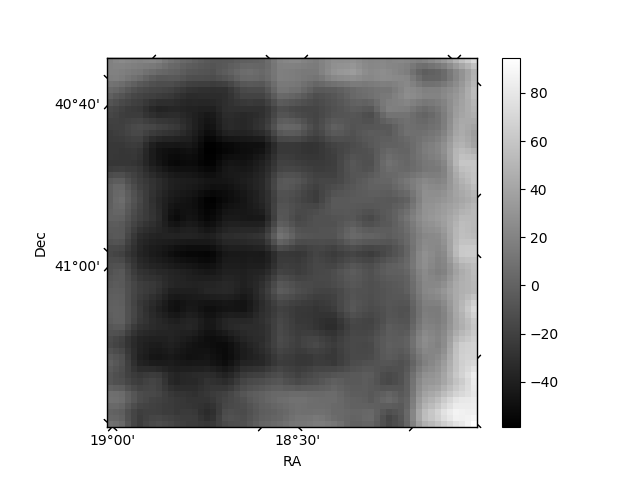
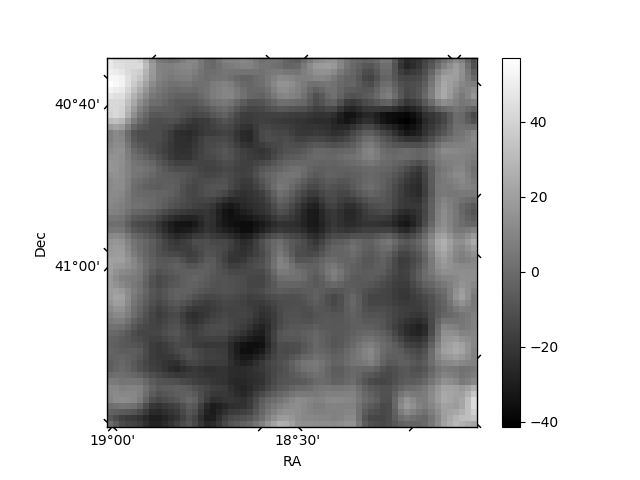
Histogram calculated using DETX and DETY for each event in the final _common_clean file
| Quadrant A | 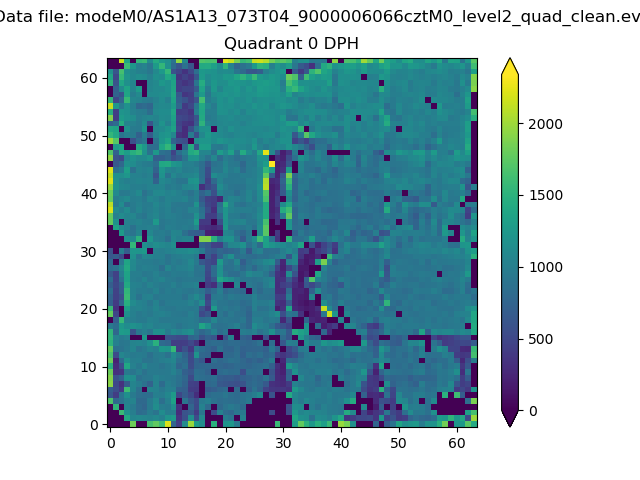 |
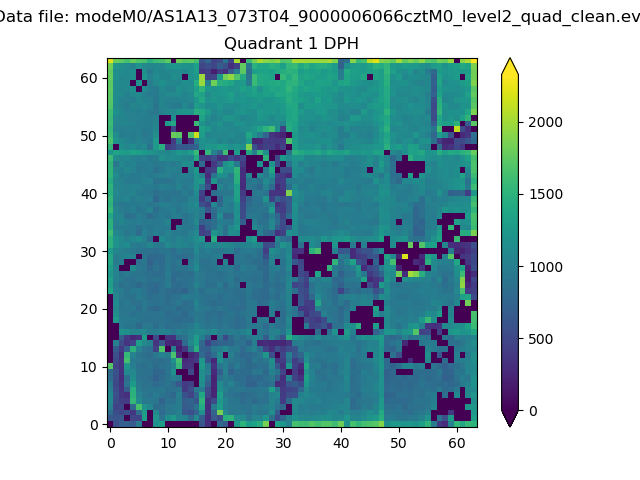 |
Quadrant B |
|---|---|---|---|
| Quadrant D | 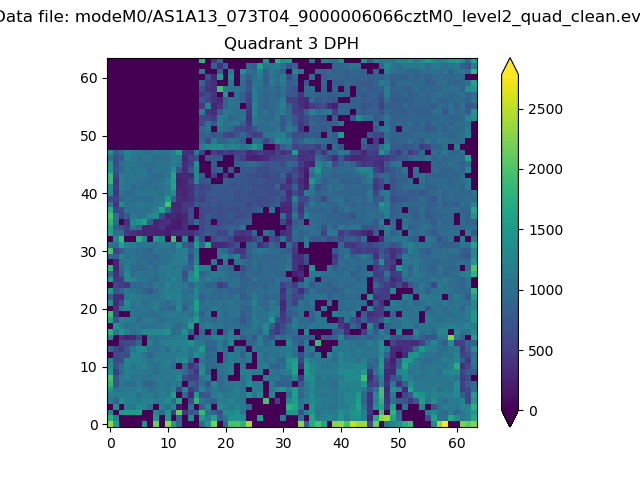 |
 |
Quadrant C |
| Plot type | Count rate plots | Images |
|---|---|---|
| Comparison with Poisson distribution Blue bars denote a histogram of data divided into 1 sec bins. Red curve is a Poisson curve with rate = median count rate of data. |
 |
 |
| Quadrant-wise count rates Data is divided into 100 sec bins |
 |
|
| Module-wise count rates for Quadrant A Data is divided into 100 sec bins |
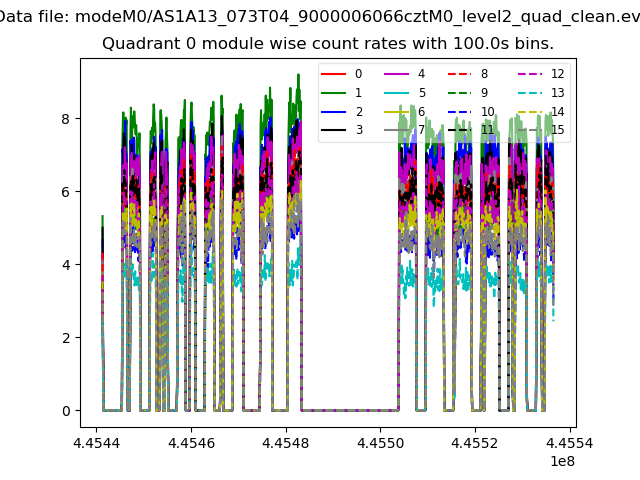 |
 |
| Module-wise count rates for Quadrant B Data is divided into 100 sec bins |
 |
 |
| Module-wise count rates for Quadrant C Data is divided into 100 sec bins |
 |
 |
| Module-wise count rates for Quadrant D Data is divided into 100 sec bins |
 |
 |
| Parameter | Plot |
|---|---|
| CZT HV Monitor | 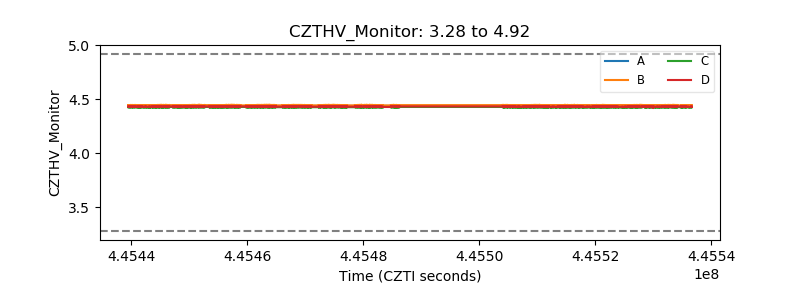 |
| D_VDD | 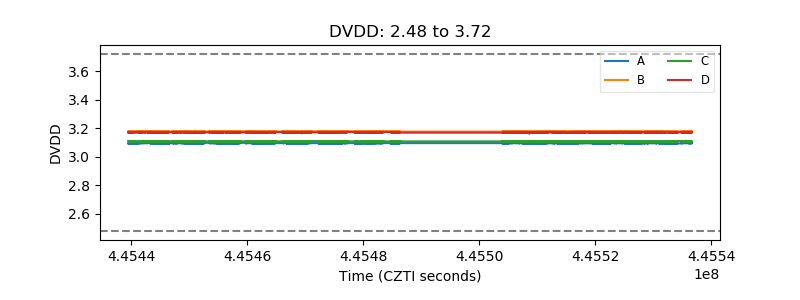 |
| Temperature 1 |  |
| Veto HV Monitor |  |
| Veto LLD | 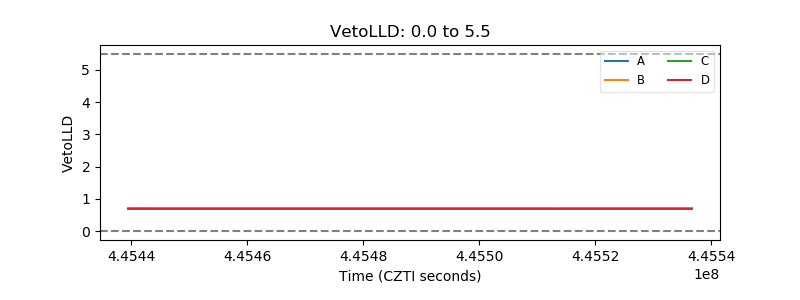 |
| Alpha Counter |  |
| _CPM_Rate | 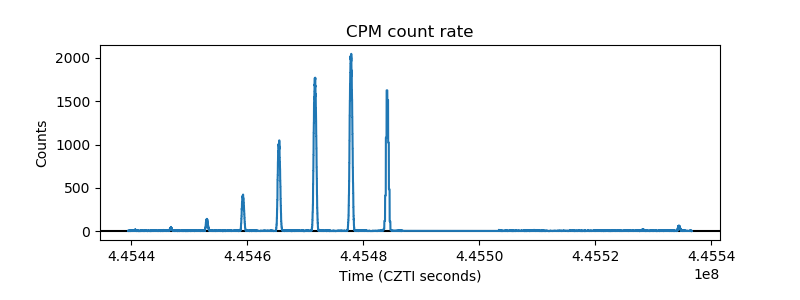 |
| CZT Counter | 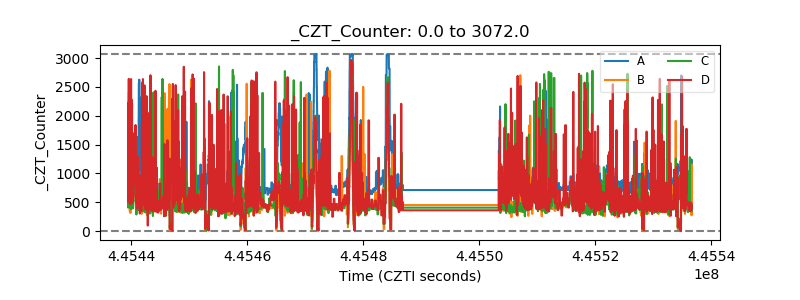 |
| +2.5 Volts monitor |  |
| +5 Volts monitor |  |
| _ROLL_ROT | 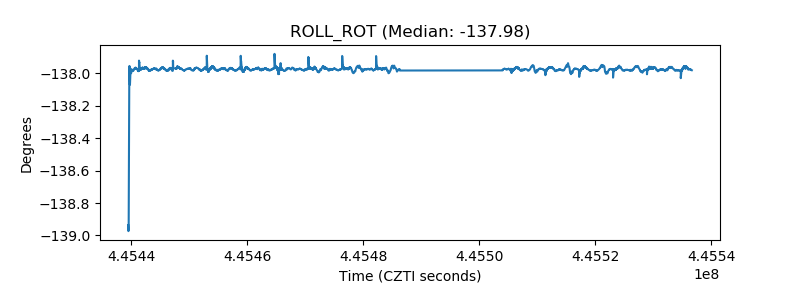 |
| _Roll_DEC |  |
| _Roll_RA | 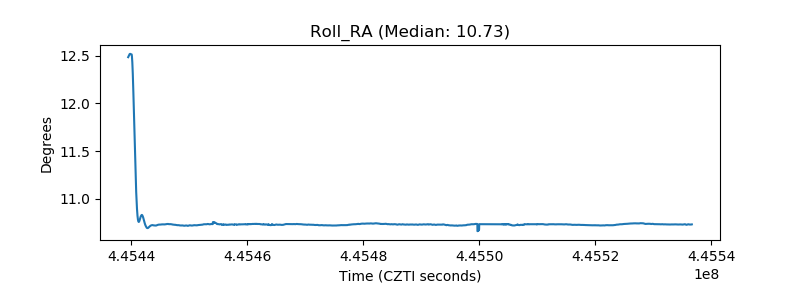 |
| Veto Counter | 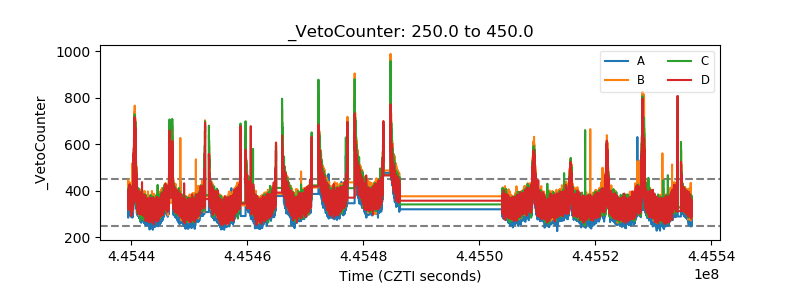 |