| Param | Original file | Final file |
|---|---|---|
| Filename | modeM0/AS1A13_047T01_9000006068cztM0_level2.fits | modeM0/AS1A13_047T01_9000006068cztM0_level2_quad_clean.evt |
| Size (bytes) | 245,113,920 | 193,271,040 |
| Size | 233.8 MB | 184.3 MB |
| Events in quadrant A | 1,452,486 | 1,033,465 |
| Events in quadrant B | 1,421,968 | 1,056,729 |
| Events in quadrant C | 1,454,142 | 1,002,624 |
| Events in quadrant D | 1,237,738 | 902,788 |
| Mode SS | |||
|---|---|---|---|
| Quadrant | BADHDUFLAG | Total packets | Discarded packets |
| A | 0 | 548 | 0 |
| B | 0 | 546 | 0 |
| C | 0 | 548 | 0 |
| D | 0 | 548 | 0 |
| Mode M0 | |||
|---|---|---|---|
| Quadrant | BADHDUFLAG | Total packets | Discarded packets |
| A | 0 | 87910 | 0 |
| B | 0 | 60256 | 0 |
| C | 0 | 66354 | 0 |
| D | 0 | 72287 | 0 |
| Mode M9 | |||
|---|---|---|---|
| Quadrant | BADHDUFLAG | Total packets | Discarded packets |
| A | 0 | 55 | 0 |
| B | 0 | 55 | 0 |
| C | 0 | 55 | 0 |
| D | 0 | 55 | 0 |
| Quadrant | Total seconds | Saturated seconds | Saturation percentage |
|---|---|---|---|
| A | 27001 | 606 | 2.244361% |
| B | 27003 | 395 | 1.462800% |
| C | 26998 | 846 | 3.133565% |
| D | 26999 | 834 | 3.089003% |
Noise dominated data is calculated using 1-second bins in cleaned event files. If a bin has >2000 counts, and if more than 50% of those come from <1% of pixels, then it is considered to be noise-dominated and hence unusable.
| Quadrant | # 1 sec bins | Bins with >0 counts | Bins with >2000 counts | High rate bins dominated by noise | Noise dominated (total time) | Noise dominated (detector-on time) | Marked lightcurve |
|---|---|---|---|---|---|---|---|
| A | 32371 | 27002 | 0 | 0 | 0.00% | 0.00% | 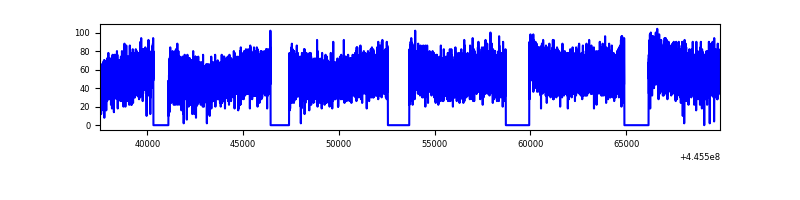 |
| B | 32371 | 26992 | 0 | 0 | 0.00% | 0.00% | 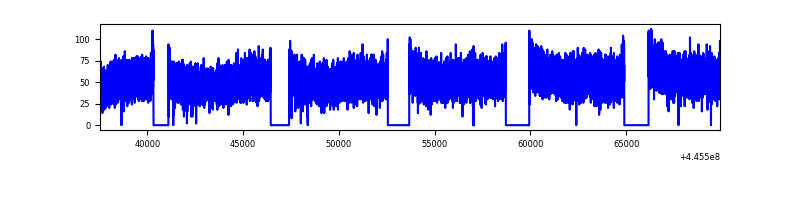 |
| C | 32370 | 26982 | 0 | 0 | 0.00% | 0.00% |  |
| D | 32370 | 26989 | 0 | 0 | 0.00% | 0.00% |  |
Top three noisy pixels from each quadrant. If the there are fewer than three noisy pixels in the level2.evt file, extra rows are filled as -1
| Pixel properties | Quadrant properties | ||||||
|---|---|---|---|---|---|---|---|
| Quadrant | DetID | PixID | Counts | Sigma | Mean | Median | Sigma |
| A | 7 | 110 | 1197 | 8.74 | 378 | 354 | 96.5 |
| A | 0 | 29 | 1162 | 8.37 | 378 | 354 | 96.5 |
| A | 0 | 30 | 1099 | 7.72 | 378 | 354 | 96.5 |
| B | 2 | 9 | 1299 | 12.27 | 377 | 360 | 76.5 |
| B | 2 | 8 | 1019 | 8.61 | 377 | 360 | 76.5 |
| B | 3 | 17 | 998 | 8.34 | 377 | 360 | 76.5 |
| C | 1 | 81 | 1159 | 8.02 | 384 | 359 | 99.8 |
| C | 3 | 202 | 1083 | 7.26 | 384 | 359 | 99.8 |
| C | 3 | 203 | 1082 | 7.25 | 384 | 359 | 99.8 |
| D | 6 | 79 | 919 | 6.03 | 356 | 323 | 98.9 |
| D | 3 | 14 | 903 | 5.87 | 356 | 323 | 98.9 |
| D | 6 | 231 | 896 | 5.79 | 356 | 323 | 98.9 |
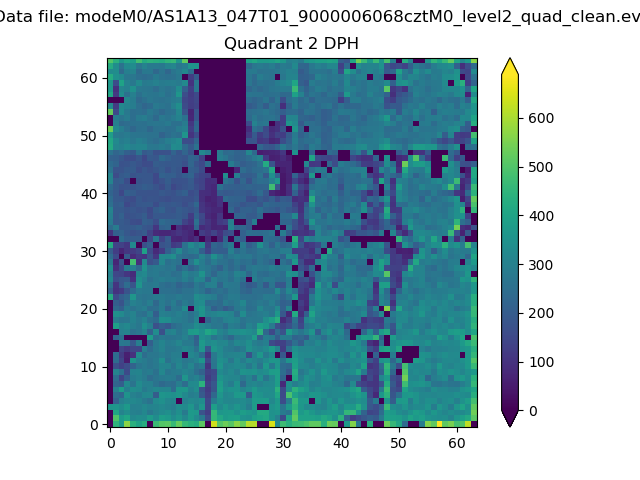
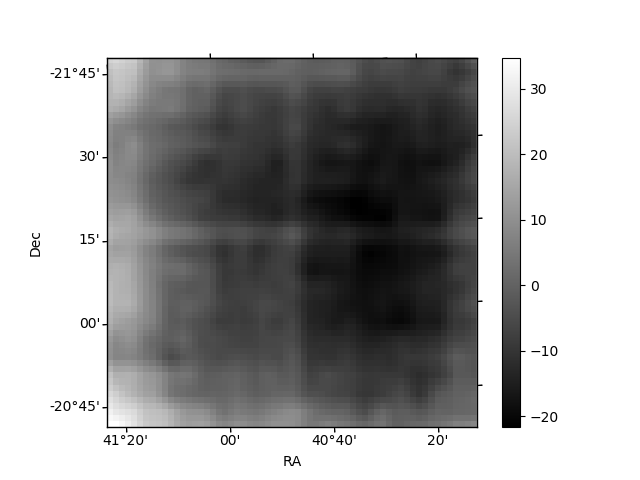
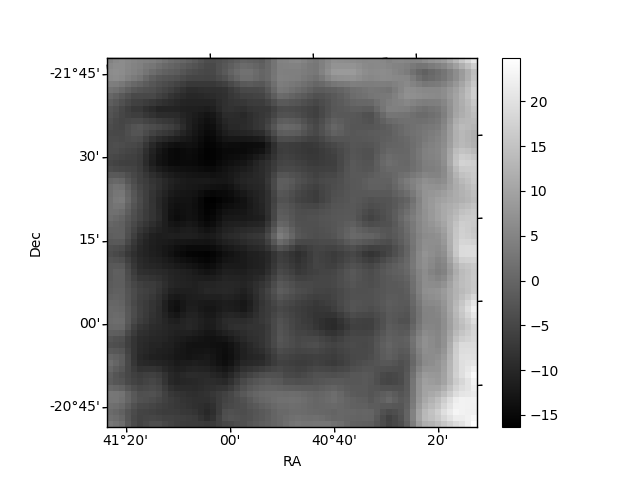
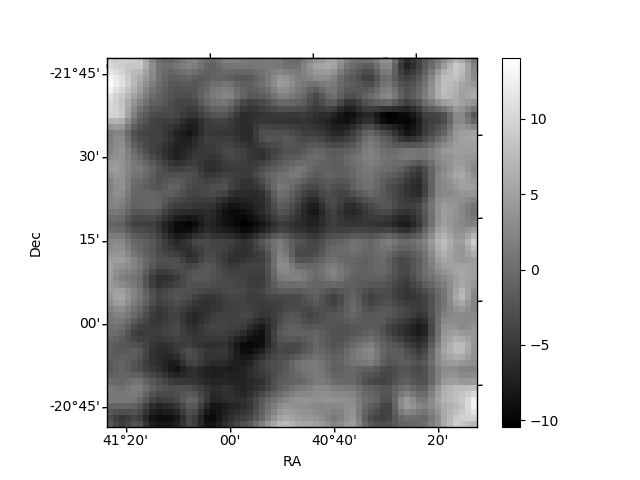
Histogram calculated using DETX and DETY for each event in the final _common_clean file
| Quadrant A | 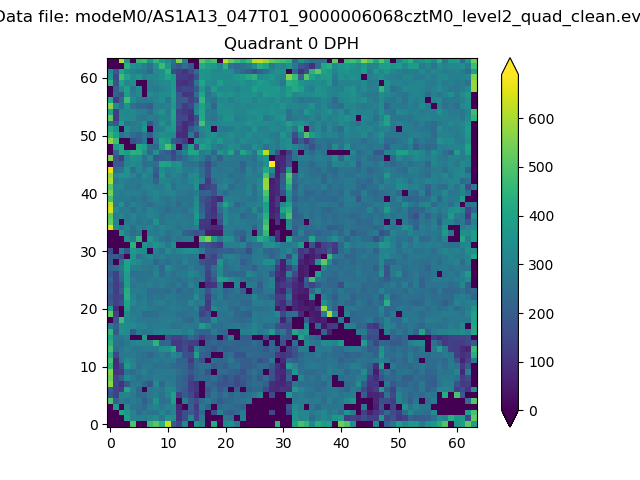 |
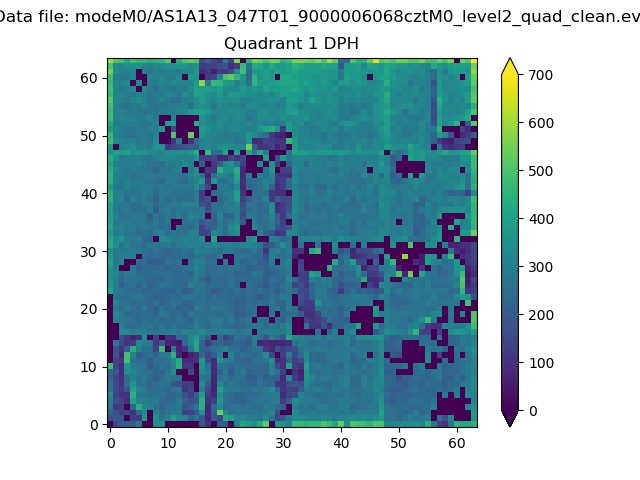 |
Quadrant B |
|---|---|---|---|
| Quadrant D | 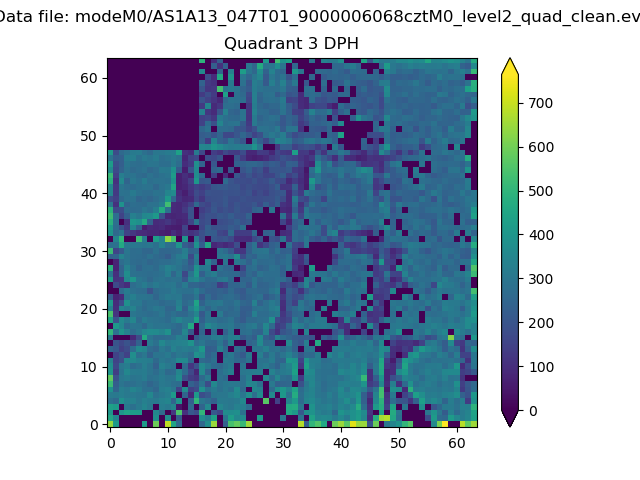 |
 |
Quadrant C |
| Plot type | Count rate plots | Images |
|---|---|---|
| Comparison with Poisson distribution Blue bars denote a histogram of data divided into 1 sec bins. Red curve is a Poisson curve with rate = median count rate of data. |
 |
 |
| Quadrant-wise count rates Data is divided into 100 sec bins |
 |
|
| Module-wise count rates for Quadrant A Data is divided into 100 sec bins |
 |
 |
| Module-wise count rates for Quadrant B Data is divided into 100 sec bins |
 |
 |
| Module-wise count rates for Quadrant C Data is divided into 100 sec bins |
 |
 |
| Module-wise count rates for Quadrant D Data is divided into 100 sec bins |
 |
 |
| Parameter | Plot |
|---|---|
| CZT HV Monitor | 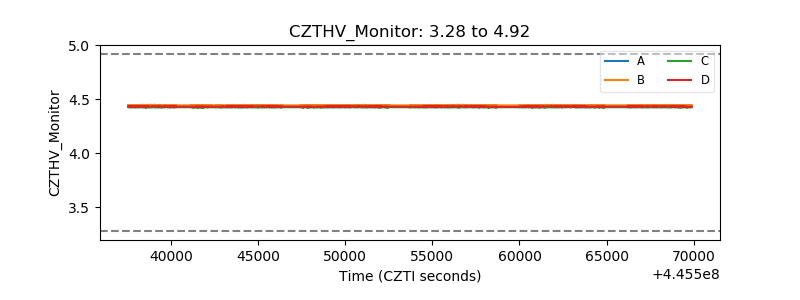 |
| D_VDD | 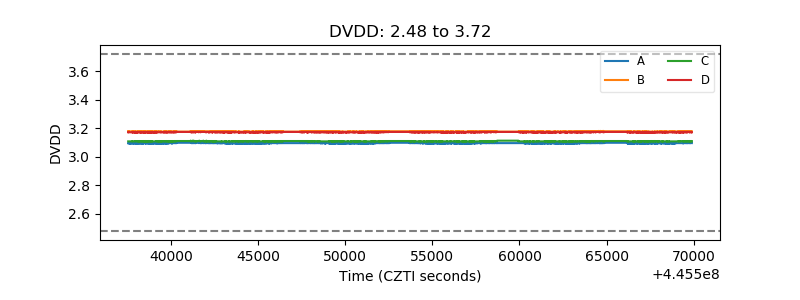 |
| Temperature 1 |  |
| Veto HV Monitor | 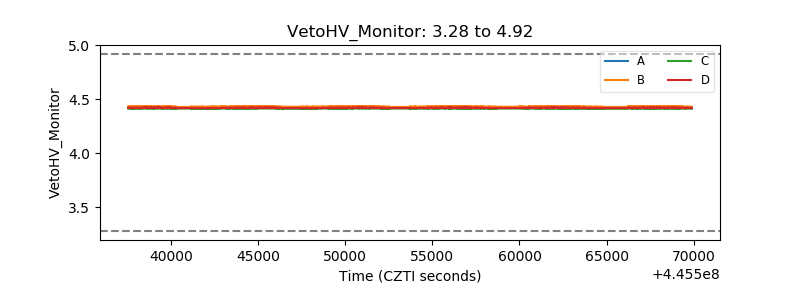 |
| Veto LLD | 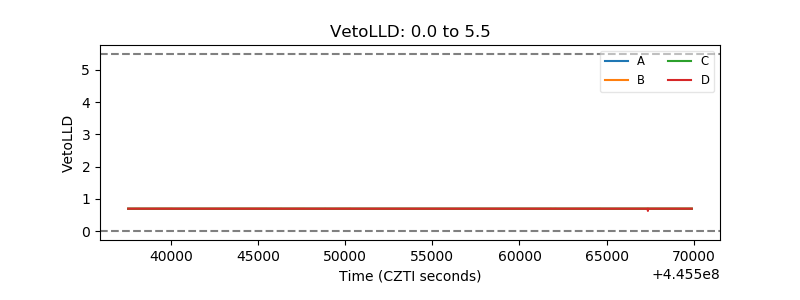 |
| Alpha Counter | 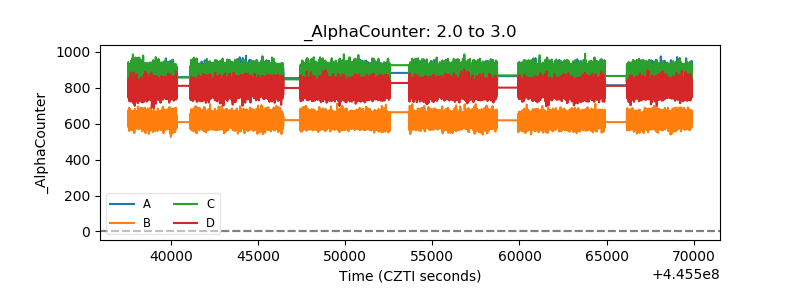 |
| _CPM_Rate | 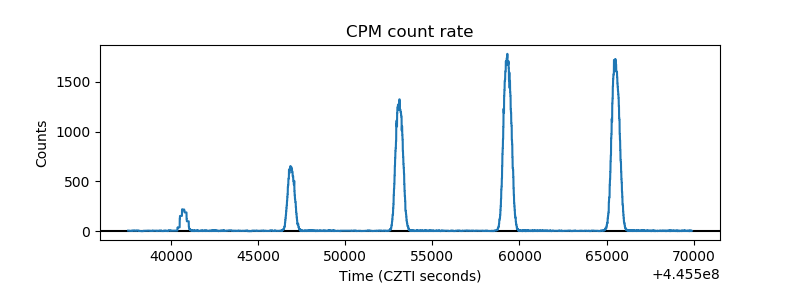 |
| CZT Counter | 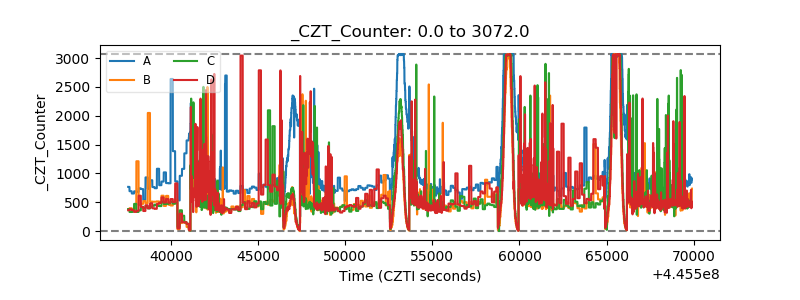 |
| +2.5 Volts monitor |  |
| +5 Volts monitor |  |
| _ROLL_ROT | 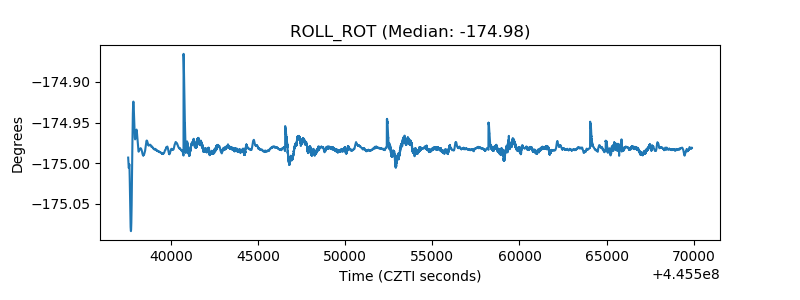 |
| _Roll_DEC | 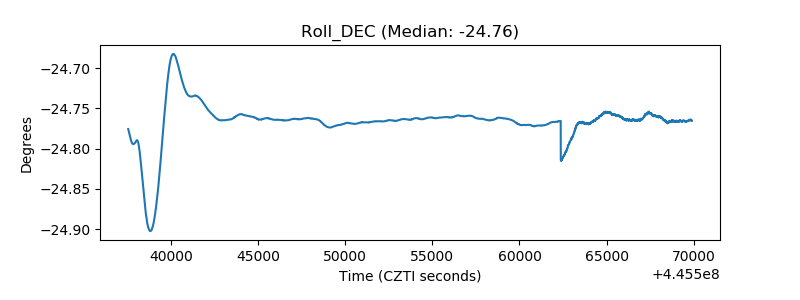 |
| _Roll_RA | 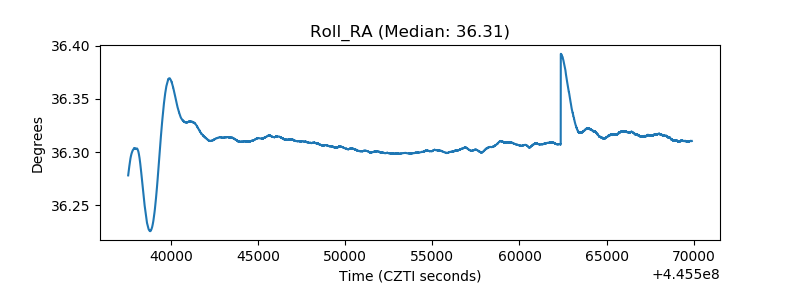 |
| Veto Counter | 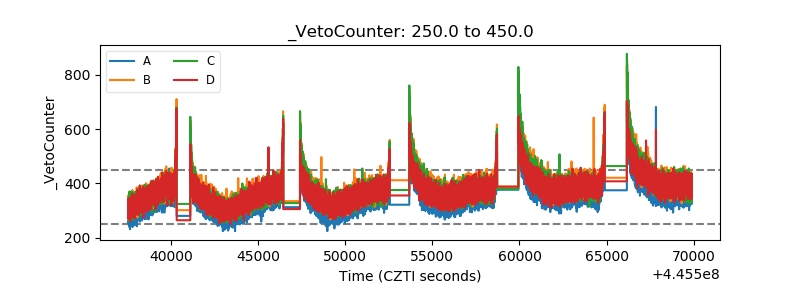 |