| Param | Original file | Final file |
|---|---|---|
| Filename | modeM0/AS1A05_166T01_9000006070cztM0_level2.fits | modeM0/AS1A05_166T01_9000006070cztM0_level2_quad_clean.evt |
| Size (bytes) | 394,297,920 | 455,653,440 |
| Size | 376.0 MB | 434.5 MB |
| Events in quadrant A | 2,312,744 | 2,822,327 |
| Events in quadrant B | 2,248,538 | 2,849,039 |
| Events in quadrant C | 2,365,464 | 2,745,578 |
| Events in quadrant D | 1,949,778 | 2,320,939 |
| Mode SS | |||
|---|---|---|---|
| Quadrant | BADHDUFLAG | Total packets | Discarded packets |
| A | 0 | 902 | 0 |
| B | 0 | 902 | 0 |
| C | 0 | 902 | 0 |
| D | 0 | 902 | 0 |
| Mode M0 | |||
|---|---|---|---|
| Quadrant | BADHDUFLAG | Total packets | Discarded packets |
| A | 0 | 142521 | 0 |
| B | 0 | 109510 | 0 |
| C | 0 | 98903 | 0 |
| D | 0 | 132716 | 0 |
| Mode M9 | |||
|---|---|---|---|
| Quadrant | BADHDUFLAG | Total packets | Discarded packets |
| A | 0 | 52 | 0 |
| B | 0 | 52 | 0 |
| C | 0 | 53 | 0 |
| D | 0 | 53 | 0 |
| Quadrant | Total seconds | Saturated seconds | Saturation percentage |
|---|---|---|---|
| A | 44606 | 1249 | 2.800072% |
| B | 44606 | 2048 | 4.591311% |
| C | 44601 | 857 | 1.921482% |
| D | 44605 | 3406 | 7.635915% |
Noise dominated data is calculated using 1-second bins in cleaned event files. If a bin has >2000 counts, and if more than 50% of those come from <1% of pixels, then it is considered to be noise-dominated and hence unusable.
| Quadrant | # 1 sec bins | Bins with >0 counts | Bins with >2000 counts | High rate bins dominated by noise | Noise dominated (total time) | Noise dominated (detector-on time) | Marked lightcurve |
|---|---|---|---|---|---|---|---|
| A | 90351 | 44599 | 0 | 0 | 0.00% | 0.00% | 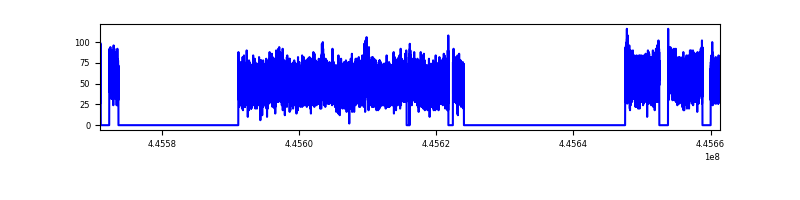 |
| B | 90351 | 44589 | 0 | 0 | 0.00% | 0.00% | 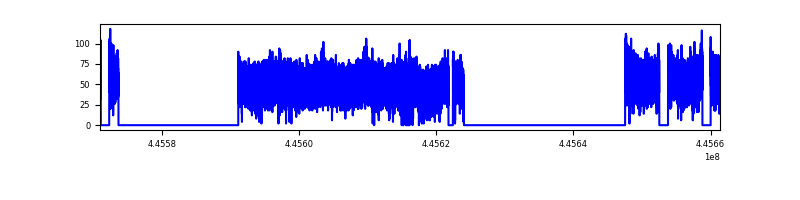 |
| C | 90352 | 44586 | 0 | 0 | 0.00% | 0.00% |  |
| D | 90351 | 44528 | 0 | 0 | 0.00% | 0.00% | 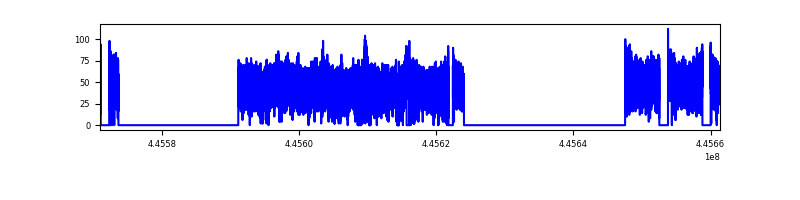 |
Top three noisy pixels from each quadrant. If the there are fewer than three noisy pixels in the level2.evt file, extra rows are filled as -1
| Pixel properties | Quadrant properties | ||||||
|---|---|---|---|---|---|---|---|
| Quadrant | DetID | PixID | Counts | Sigma | Mean | Median | Sigma |
| A | 7 | 110 | 1921 | 8.87 | 602 | 564 | 153.0 |
| A | 15 | 236 | 1855 | 8.44 | 602 | 564 | 153.0 |
| A | 14 | 95 | 1827 | 8.26 | 602 | 564 | 153.0 |
| B | 2 | 9 | 2086 | 12.87 | 595 | 567 | 118.0 |
| B | 2 | 8 | 1709 | 9.68 | 595 | 567 | 118.0 |
| B | 3 | 17 | 1652 | 9.19 | 595 | 567 | 118.0 |
| C | 3 | 202 | 1846 | 7.79 | 626 | 583 | 162.2 |
| C | 1 | 81 | 1826 | 7.67 | 626 | 583 | 162.2 |
| C | 1 | 80 | 1801 | 7.51 | 626 | 583 | 162.2 |
| D | 10 | 189 | 1470 | 6.21 | 559 | 508 | 154.8 |
| D | 3 | 14 | 1452 | 6.1 | 559 | 508 | 154.8 |
| D | 15 | 47 | 1425 | 5.92 | 559 | 508 | 154.8 |
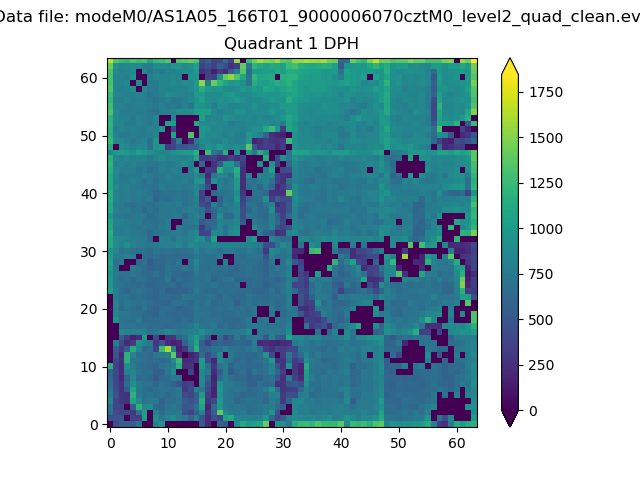
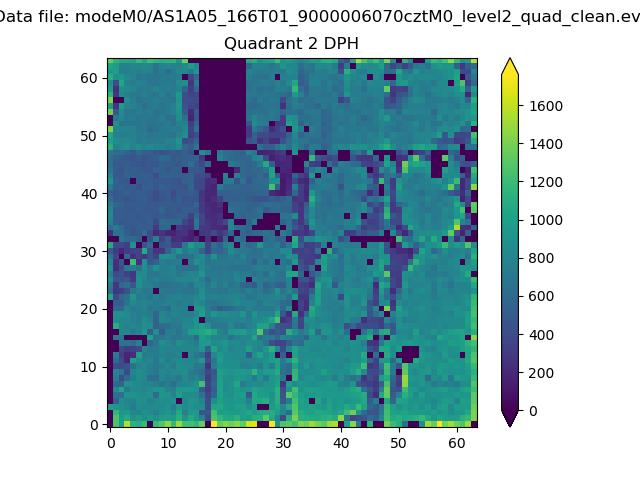
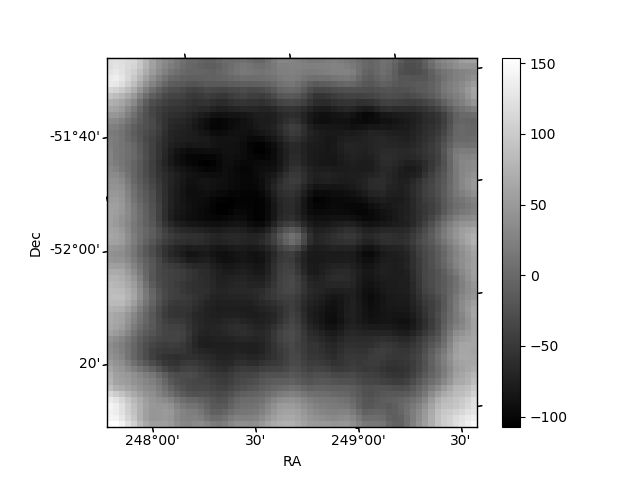
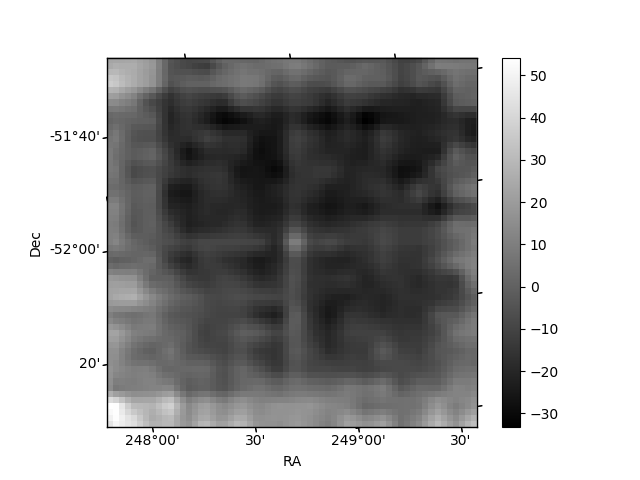
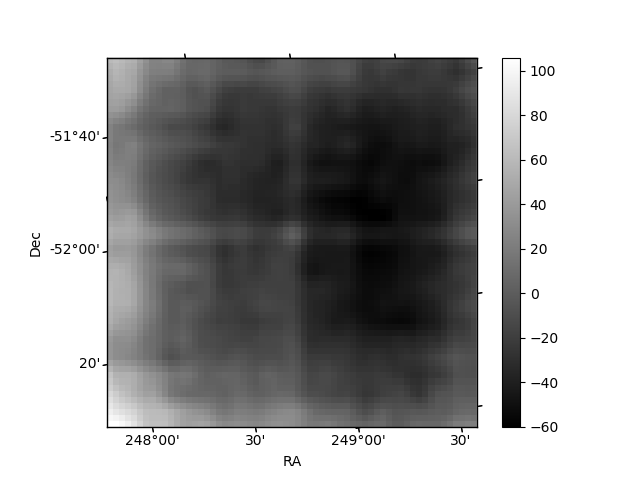
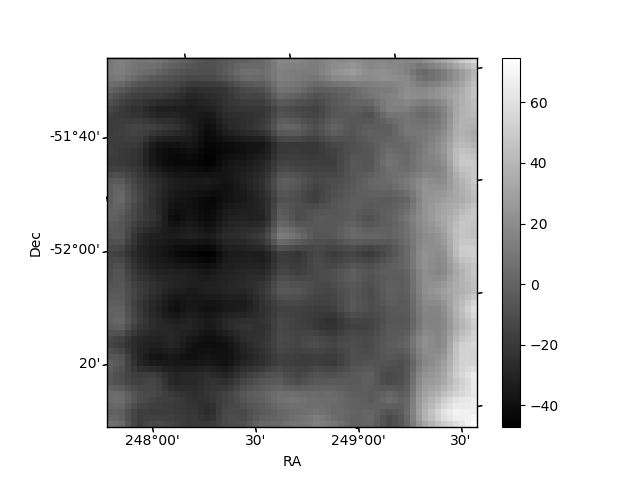
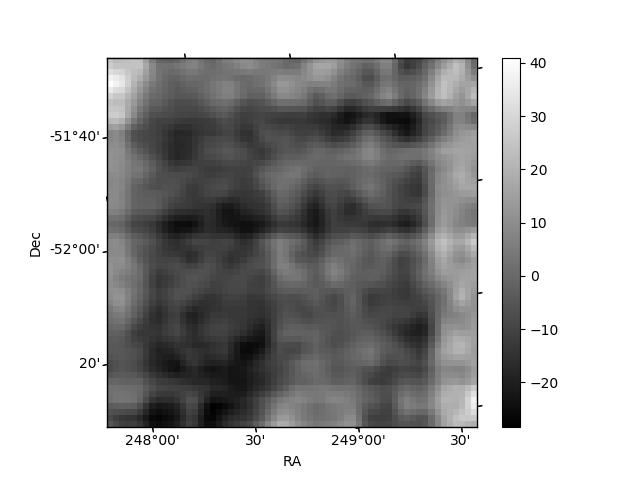
Histogram calculated using DETX and DETY for each event in the final _common_clean file
| Quadrant A | 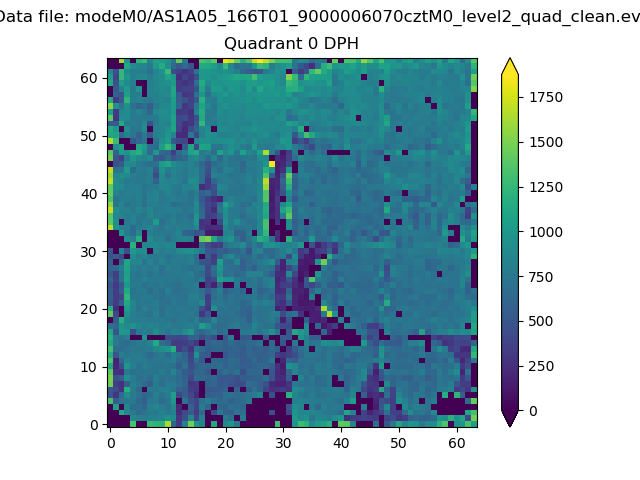 |
 |
Quadrant B |
|---|---|---|---|
| Quadrant D | 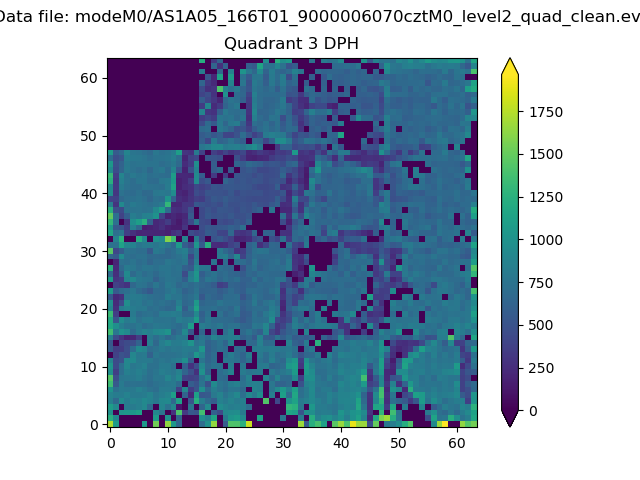 |
 |
Quadrant C |
| Plot type | Count rate plots | Images |
|---|---|---|
| Comparison with Poisson distribution Blue bars denote a histogram of data divided into 1 sec bins. Red curve is a Poisson curve with rate = median count rate of data. |
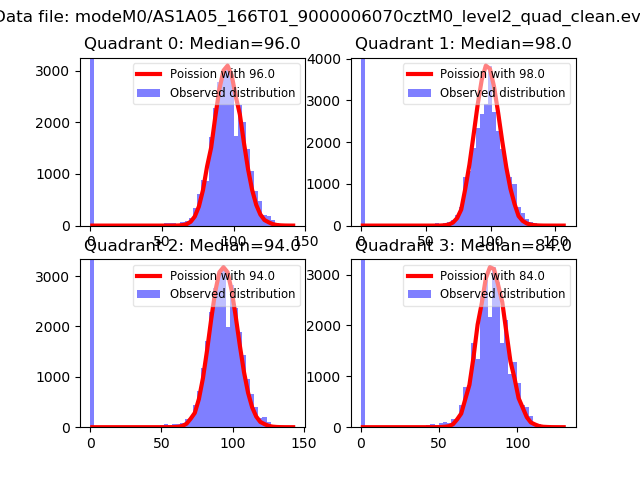 |
 |
| Quadrant-wise count rates Data is divided into 100 sec bins |
 |
|
| Module-wise count rates for Quadrant A Data is divided into 100 sec bins |
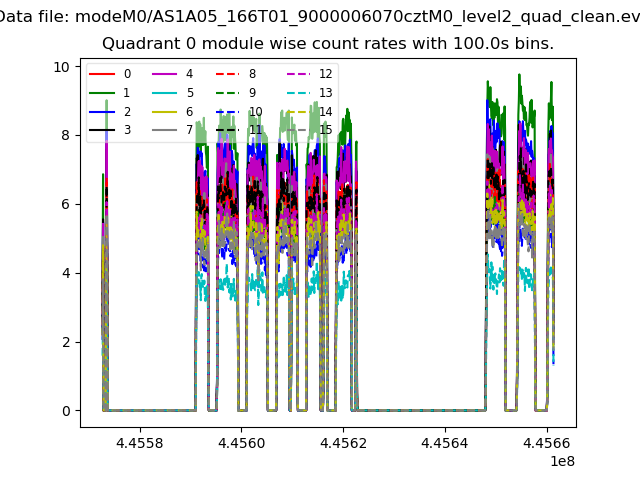 |
 |
| Module-wise count rates for Quadrant B Data is divided into 100 sec bins |
 |
 |
| Module-wise count rates for Quadrant C Data is divided into 100 sec bins |
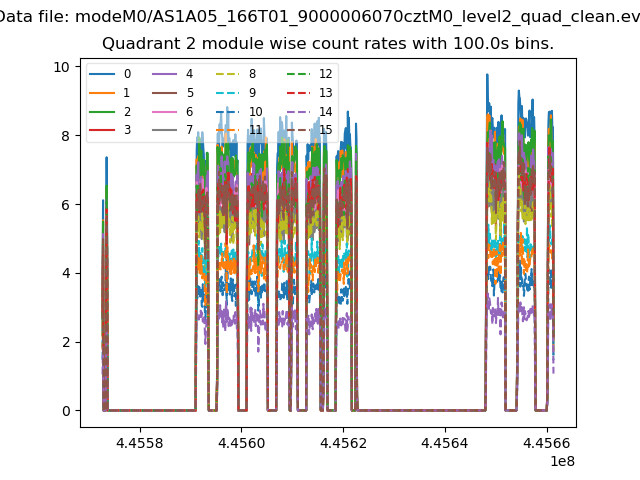 |
 |
| Module-wise count rates for Quadrant D Data is divided into 100 sec bins |
 |
 |
| Parameter | Plot |
|---|---|
| CZT HV Monitor | 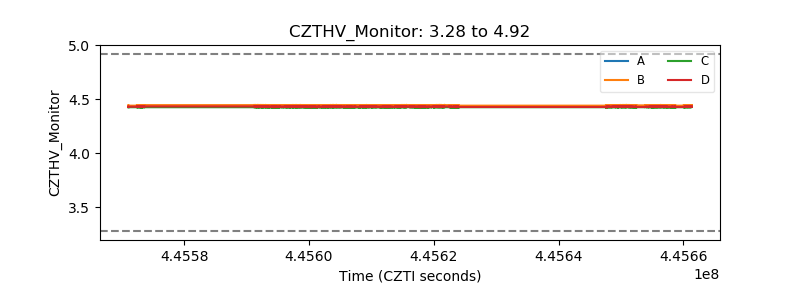 |
| D_VDD | 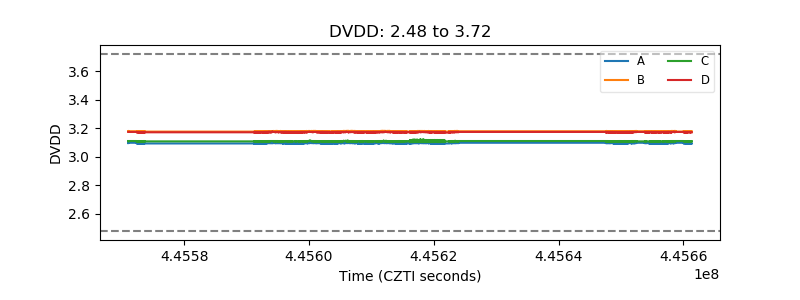 |
| Temperature 1 |  |
| Veto HV Monitor |  |
| Veto LLD |  |
| Alpha Counter | 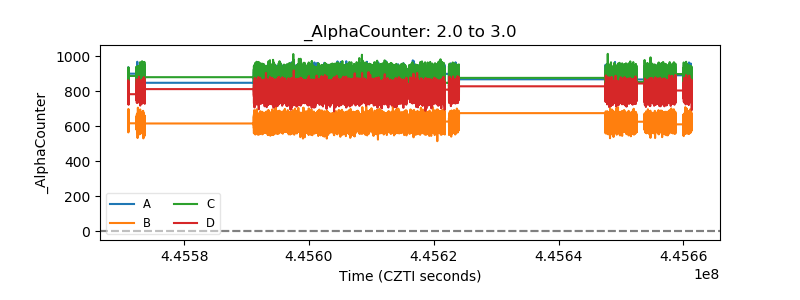 |
| _CPM_Rate | 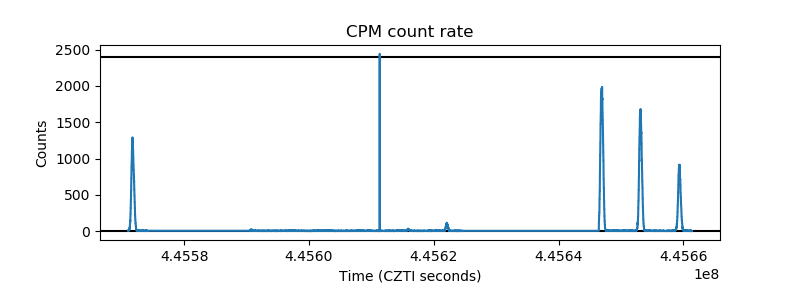 |
| CZT Counter | 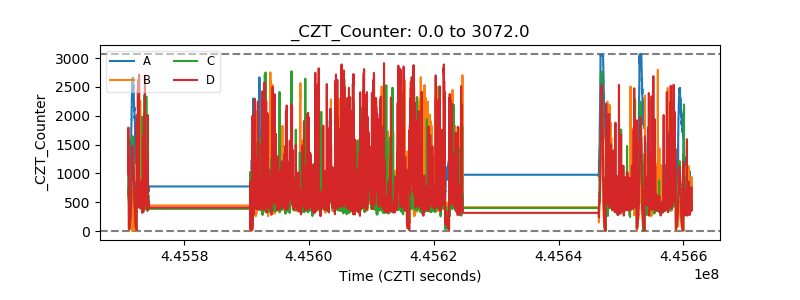 |
| +2.5 Volts monitor | 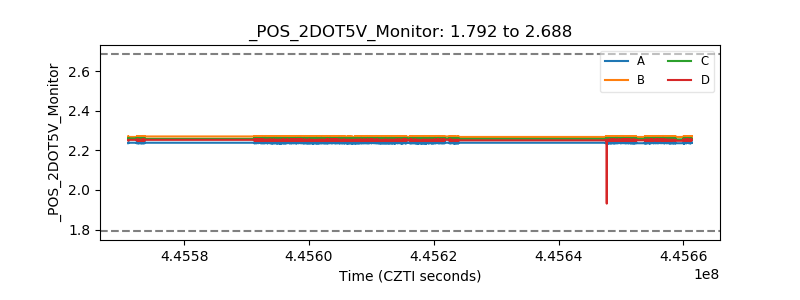 |
| +5 Volts monitor |  |
| _ROLL_ROT |  |
| _Roll_DEC | 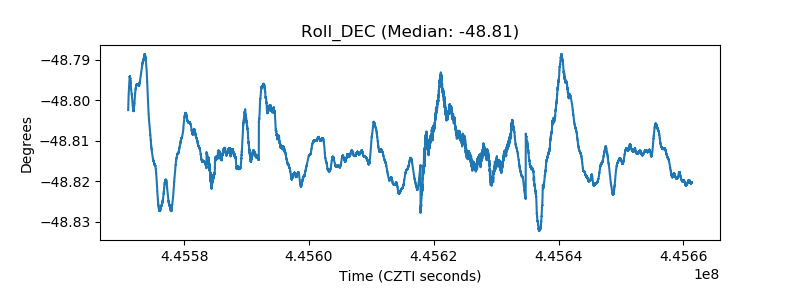 |
| _Roll_RA | 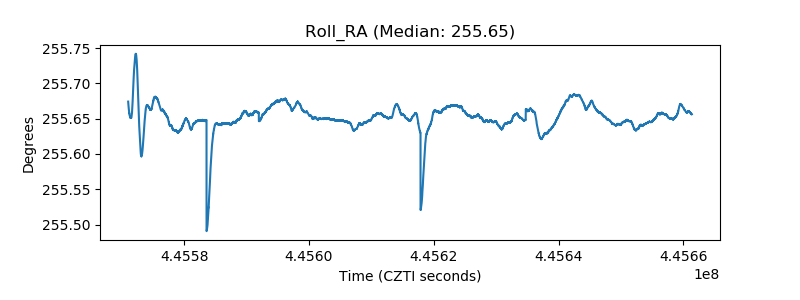 |
| Veto Counter |  |