| Param | Original file | Final file |
|---|---|---|
| Filename | modeM0/AS1A13_041T08_9000006084cztM0_level2.fits | modeM0/AS1A13_041T08_9000006084cztM0_level2_quad_clean.evt |
| Size (bytes) | 54,743,040 | 53,363,520 |
| Size | 52.2 MB | 50.9 MB |
| Events in quadrant A | 320,756 | 311,154 |
| Events in quadrant B | 323,106 | 323,394 |
| Events in quadrant C | 326,410 | 299,333 |
| Events in quadrant D | 274,166 | 267,987 |
| Mode M9 | |||
|---|---|---|---|
| Quadrant | BADHDUFLAG | Total packets | Discarded packets |
| A | 0 | 12 | 0 |
| B | 0 | 13 | 0 |
| C | 0 | 13 | 0 |
| D | 0 | 13 | 0 |
| Mode SS | |||
|---|---|---|---|
| Quadrant | BADHDUFLAG | Total packets | Discarded packets |
| A | 0 | 122 | 0 |
| B | 0 | 122 | 0 |
| C | 0 | 122 | 0 |
| D | 0 | 122 | 0 |
| Mode M0 | |||
|---|---|---|---|
| Quadrant | BADHDUFLAG | Total packets | Discarded packets |
| A | 0 | 20656 | 0 |
| B | 0 | 12652 | 0 |
| C | 0 | 13482 | 0 |
| D | 0 | 15856 | 0 |
| Quadrant | Total seconds | Saturated seconds | Saturation percentage |
|---|---|---|---|
| A | 5910 | 321 | 5.431472% |
| B | 5910 | 78 | 1.319797% |
| C | 5910 | 103 | 1.742809% |
| D | 5910 | 200 | 3.384095% |
Noise dominated data is calculated using 1-second bins in cleaned event files. If a bin has >2000 counts, and if more than 50% of those come from <1% of pixels, then it is considered to be noise-dominated and hence unusable.
| Quadrant | # 1 sec bins | Bins with >0 counts | Bins with >2000 counts | High rate bins dominated by noise | Noise dominated (total time) | Noise dominated (detector-on time) | Marked lightcurve |
|---|---|---|---|---|---|---|---|
| A | 7109 | 5909 | 0 | 0 | 0.00% | 0.00% |  |
| B | 7109 | 5909 | 0 | 0 | 0.00% | 0.00% |  |
| C | 7109 | 5909 | 0 | 0 | 0.00% | 0.00% | 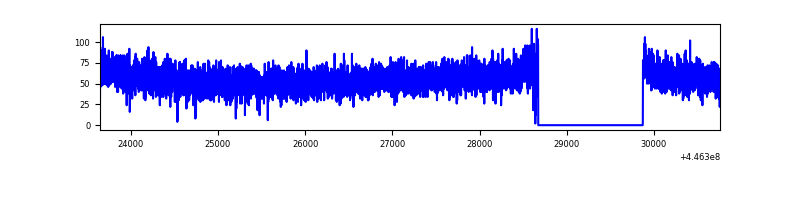 |
| D | 7109 | 5908 | 0 | 0 | 0.00% | 0.00% | 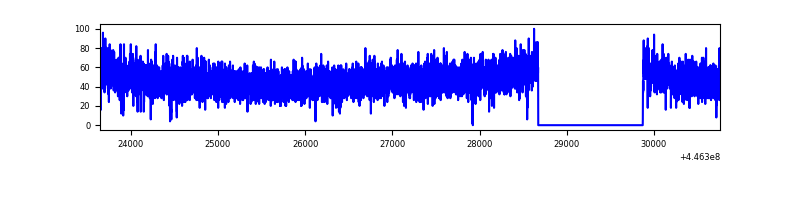 |
Top three noisy pixels from each quadrant. If the there are fewer than three noisy pixels in the level2.evt file, extra rows are filled as -1
| Pixel properties | Quadrant properties | ||||||
|---|---|---|---|---|---|---|---|
| Quadrant | DetID | PixID | Counts | Sigma | Mean | Median | Sigma |
| A | 15 | 236 | 268 | 8.2 | 83 | 79 | 23.1 |
| A | 0 | 29 | 258 | 7.76 | 83 | 79 | 23.1 |
| A | 0 | 30 | 238 | 6.9 | 83 | 79 | 23.1 |
| B | 2 | 9 | 301 | 11.29 | 86 | 82 | 19.4 |
| B | 5 | 128 | 238 | 8.04 | 86 | 82 | 19.4 |
| B | 3 | 17 | 220 | 7.11 | 86 | 82 | 19.4 |
| C | 1 | 81 | 254 | 7.18 | 86 | 81 | 24.1 |
| C | 3 | 202 | 251 | 7.05 | 86 | 81 | 24.1 |
| C | 1 | 80 | 242 | 6.68 | 86 | 81 | 24.1 |
| D | 3 | 31 | 222 | 6.39 | 78 | 70 | 23.8 |
| D | 6 | 83 | 203 | 5.59 | 78 | 70 | 23.8 |
| D | 6 | 79 | 203 | 5.59 | 78 | 70 | 23.8 |
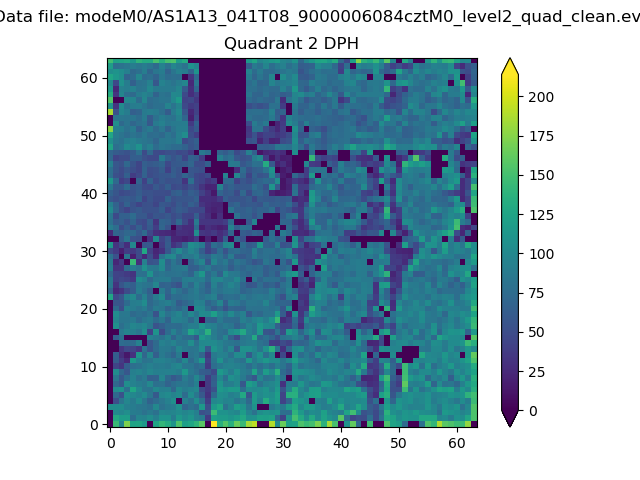
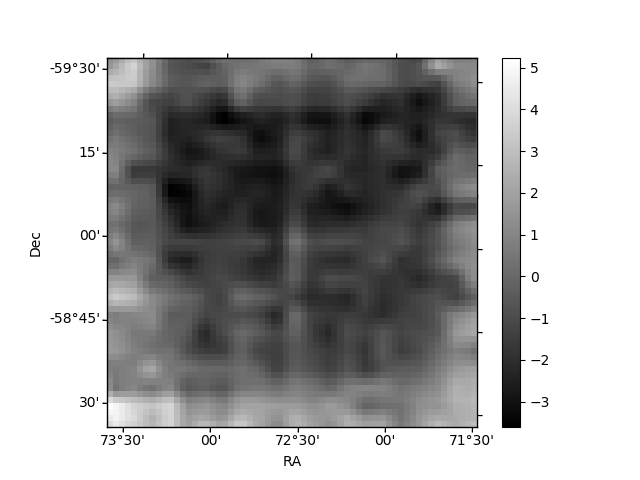
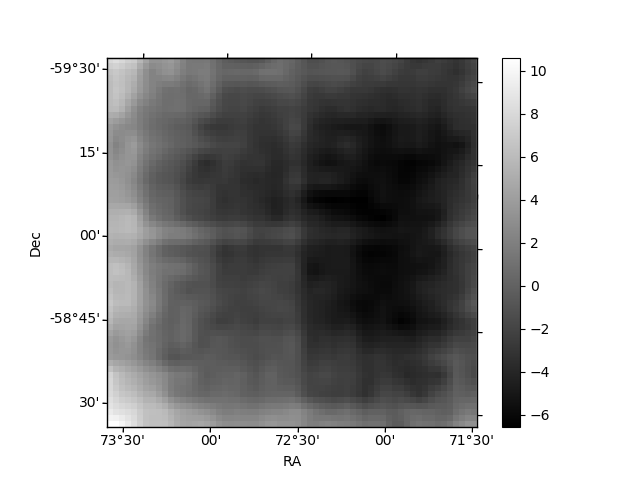
Histogram calculated using DETX and DETY for each event in the final _common_clean file
| Quadrant A | 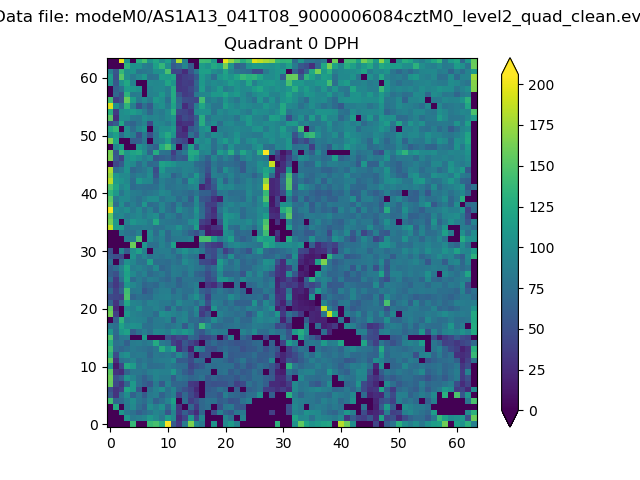 |
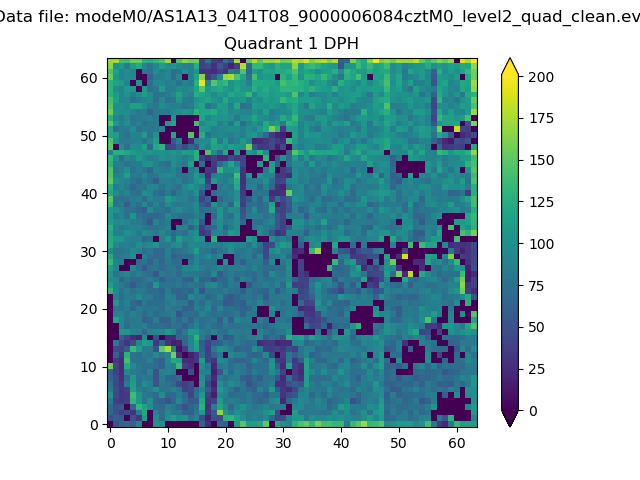 |
Quadrant B |
|---|---|---|---|
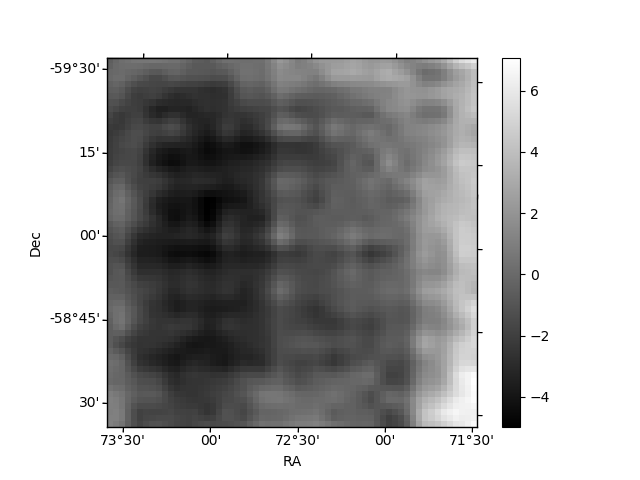
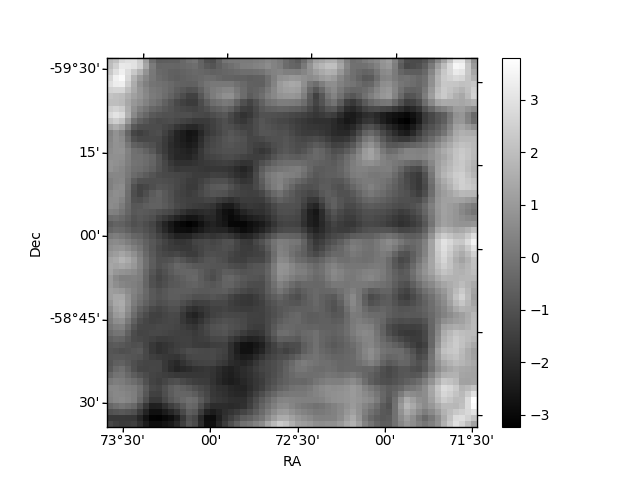
| Quadrant D | 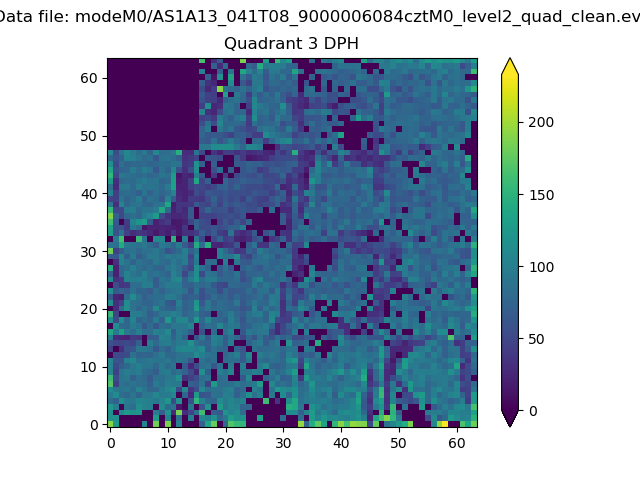 |
 |
Quadrant C |
| Plot type | Count rate plots | Images |
|---|---|---|
| Comparison with Poisson distribution Blue bars denote a histogram of data divided into 1 sec bins. Red curve is a Poisson curve with rate = median count rate of data. |
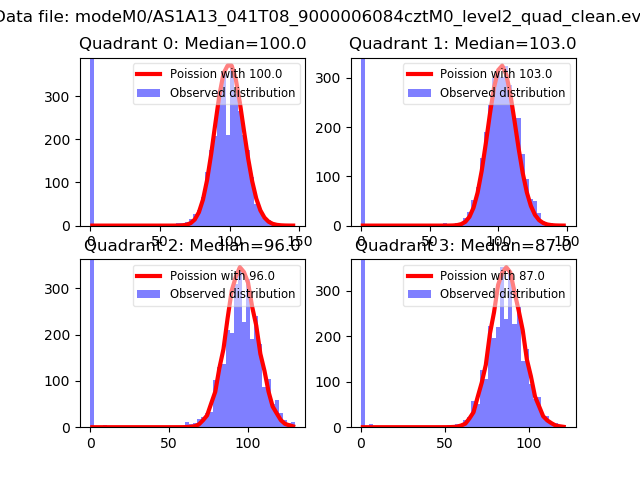 |
 |
| Quadrant-wise count rates Data is divided into 100 sec bins |
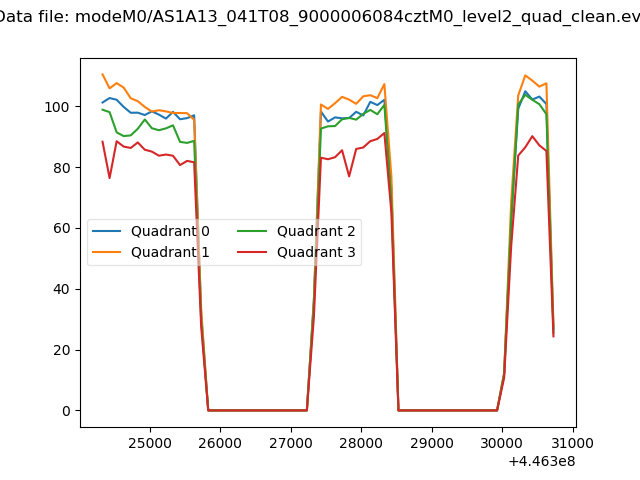 |
|
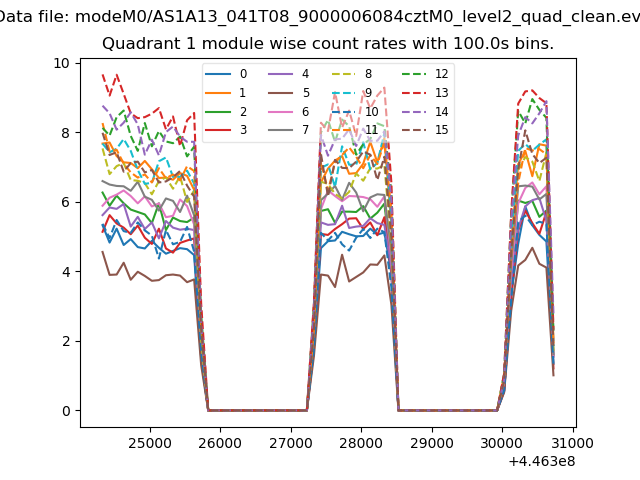
| Module-wise count rates for Quadrant A Data is divided into 100 sec bins |
 |
 |
| Module-wise count rates for Quadrant B Data is divided into 100 sec bins |
 |
 |
| Module-wise count rates for Quadrant C Data is divided into 100 sec bins |
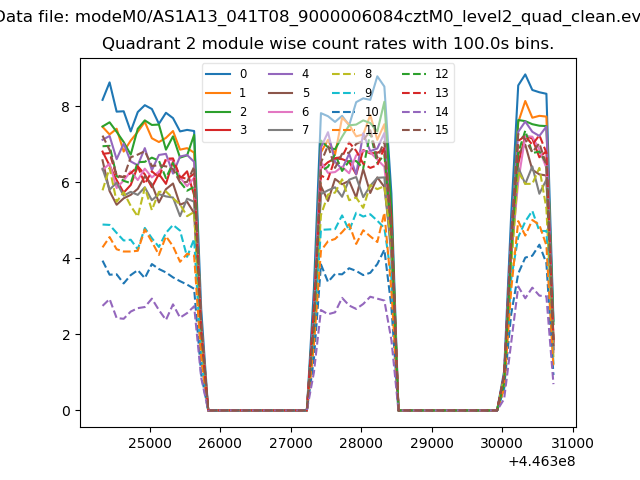 |
 |
| Module-wise count rates for Quadrant D Data is divided into 100 sec bins |
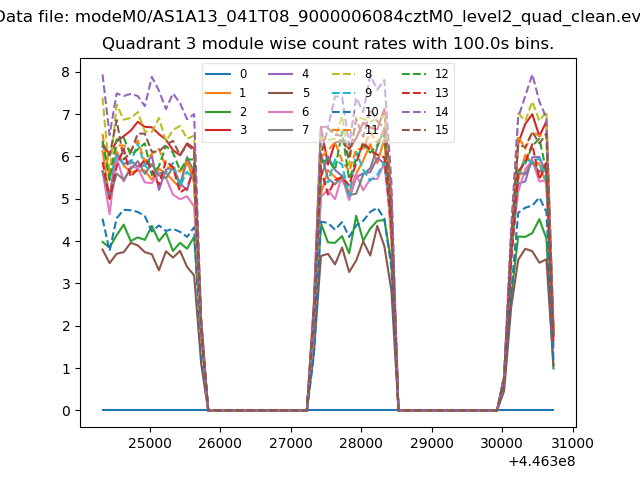 |
 |
| Parameter | Plot |
|---|---|
| CZT HV Monitor |  |
| D_VDD | 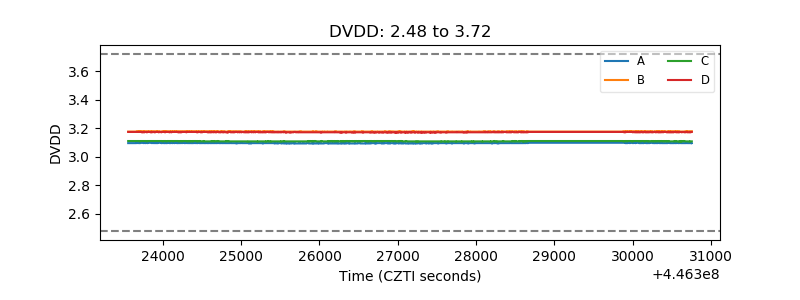 |
| Temperature 1 |  |
| Veto HV Monitor | 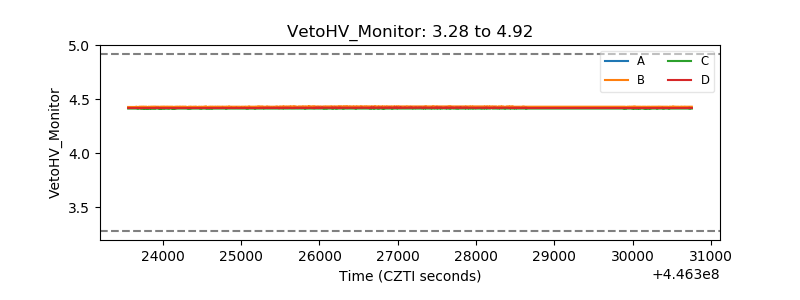 |
| Veto LLD | 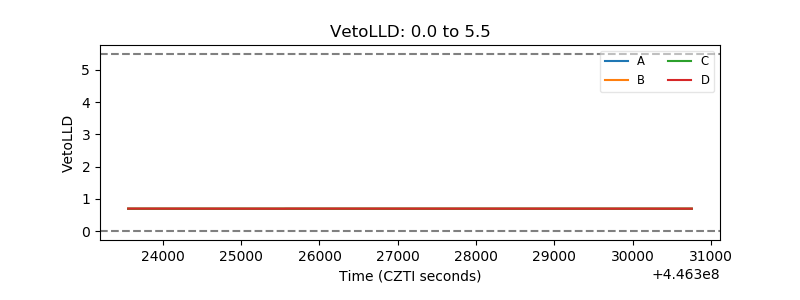 |
| Alpha Counter | 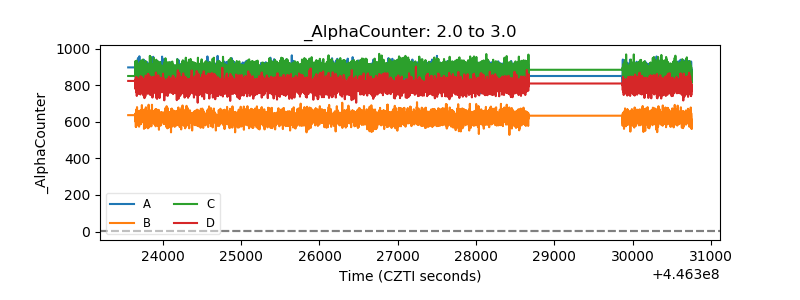 |
| _CPM_Rate | 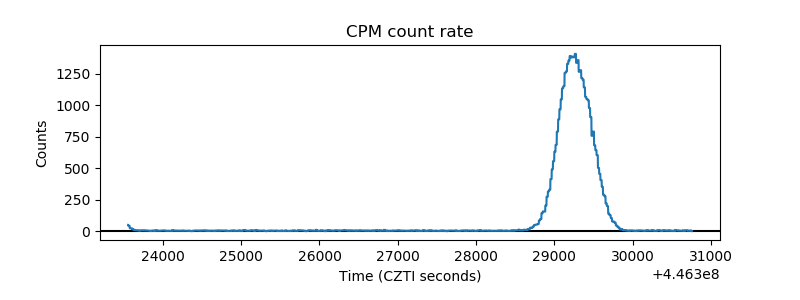 |
| CZT Counter | 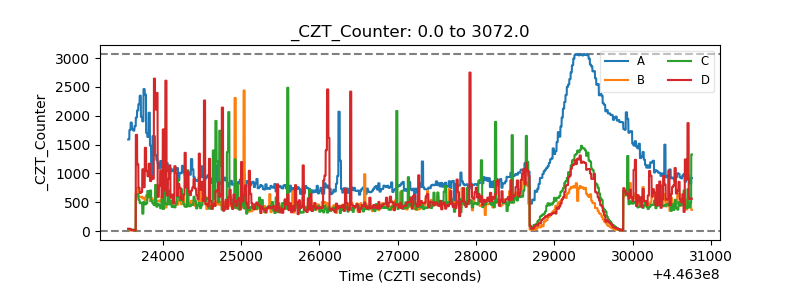 |
| +2.5 Volts monitor |  |
| +5 Volts monitor |  |
| _ROLL_ROT | 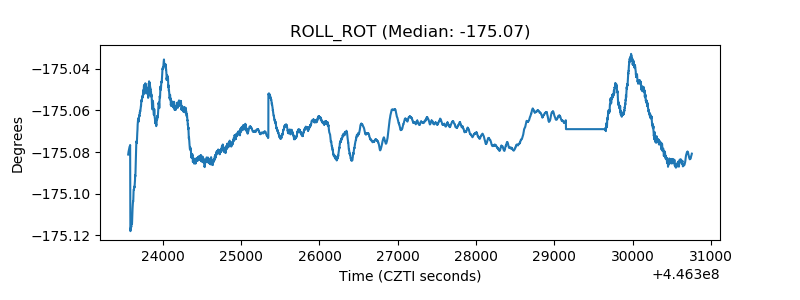 |
| _Roll_DEC | 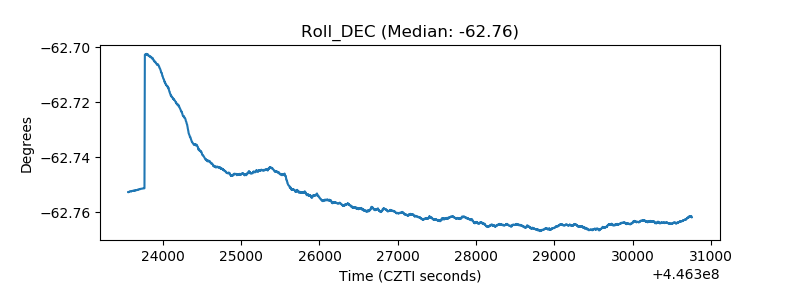 |
| _Roll_RA | 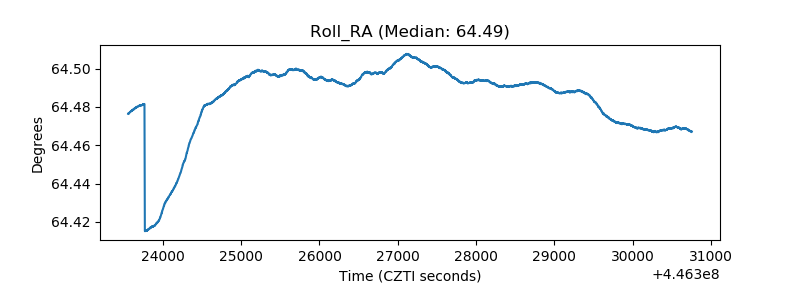 |
| Veto Counter | 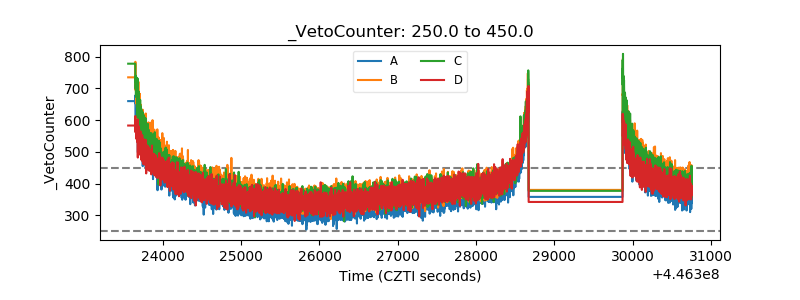 |