| Param | Original file | Final file |
|---|---|---|
| Filename | modeM0/AS1A13_038T03_9000006088cztM0_level2.fits | modeM0/AS1A13_038T03_9000006088cztM0_level2_quad_clean.evt |
| Size (bytes) | 233,697,600 | 252,601,920 |
| Size | 222.9 MB | 240.9 MB |
| Events in quadrant A | 1,367,464 | 1,506,631 |
| Events in quadrant B | 1,354,772 | 1,554,127 |
| Events in quadrant C | 1,400,804 | 1,485,315 |
| Events in quadrant D | 1,185,040 | 1,335,207 |
| Mode M9 | |||
|---|---|---|---|
| Quadrant | BADHDUFLAG | Total packets | Discarded packets |
| A | 0 | 46 | 0 |
| B | 0 | 47 | 0 |
| C | 0 | 47 | 0 |
| D | 0 | 47 | 0 |
| Mode M0 | |||
|---|---|---|---|
| Quadrant | BADHDUFLAG | Total packets | Discarded packets |
| A | 0 | 83313 | 0 |
| B | 0 | 58850 | 0 |
| C | 0 | 55328 | 0 |
| D | 0 | 64394 | 0 |
| Mode SS | |||
|---|---|---|---|
| Quadrant | BADHDUFLAG | Total packets | Discarded packets |
| A | 0 | 525 | 0 |
| B | 0 | 525 | 0 |
| C | 0 | 528 | 0 |
| D | 0 | 528 | 0 |
| Quadrant | Total seconds | Saturated seconds | Saturation percentage |
|---|---|---|---|
| A | 25700 | 955 | 3.715953% |
| B | 25722 | 736 | 2.861364% |
| C | 25733 | 376 | 1.461159% |
| D | 25678 | 673 | 2.620921% |
Noise dominated data is calculated using 1-second bins in cleaned event files. If a bin has >2000 counts, and if more than 50% of those come from <1% of pixels, then it is considered to be noise-dominated and hence unusable.
| Quadrant | # 1 sec bins | Bins with >0 counts | Bins with >2000 counts | High rate bins dominated by noise | Noise dominated (total time) | Noise dominated (detector-on time) | Marked lightcurve |
|---|---|---|---|---|---|---|---|
| A | 40970 | 25842 | 0 | 0 | 0.00% | 0.00% |  |
| B | 40970 | 25840 | 0 | 0 | 0.00% | 0.00% |  |
| C | 40970 | 25833 | 0 | 0 | 0.00% | 0.00% |  |
| D | 40970 | 25805 | 0 | 0 | 0.00% | 0.00% |  |
Top three noisy pixels from each quadrant. If the there are fewer than three noisy pixels in the level2.evt file, extra rows are filled as -1
| Pixel properties | Quadrant properties | ||||||
|---|---|---|---|---|---|---|---|
| Quadrant | DetID | PixID | Counts | Sigma | Mean | Median | Sigma |
| A | 7 | 110 | 1124 | 8.52 | 357 | 333 | 92.9 |
| A | 15 | 236 | 1104 | 8.3 | 357 | 333 | 92.9 |
| A | 14 | 95 | 1025 | 7.45 | 357 | 333 | 92.9 |
| B | 2 | 9 | 1318 | 13.12 | 358 | 341 | 74.5 |
| B | 2 | 8 | 1100 | 10.19 | 358 | 341 | 74.5 |
| B | 3 | 17 | 949 | 8.17 | 358 | 341 | 74.5 |
| C | 3 | 202 | 1069 | 7.47 | 369 | 344 | 97.1 |
| C | 1 | 81 | 1055 | 7.32 | 369 | 344 | 97.1 |
| C | 1 | 80 | 1022 | 6.98 | 369 | 344 | 97.1 |
| D | 10 | 189 | 902 | 6.19 | 340 | 309 | 95.8 |
| D | 7 | 3 | 875 | 5.91 | 340 | 309 | 95.8 |
| D | 15 | 47 | 866 | 5.82 | 340 | 309 | 95.8 |
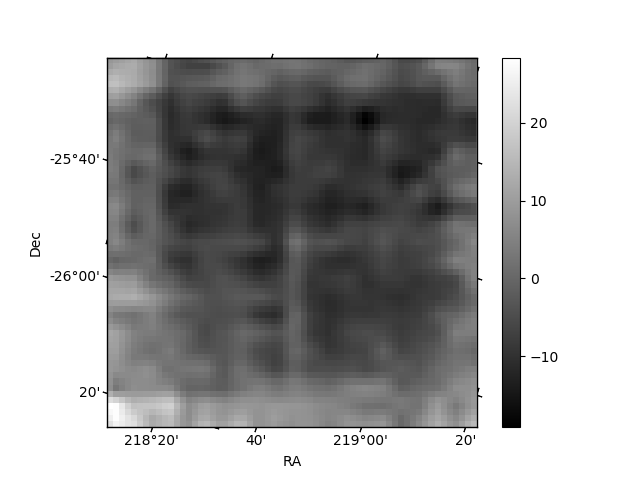
Histogram calculated using DETX and DETY for each event in the final _common_clean file
| Quadrant A |  |
 |
Quadrant B |
|---|---|---|---|
| Quadrant D |  |
 |
Quadrant C |
| Plot type | Count rate plots | Images |
|---|---|---|
| Comparison with Poisson distribution Blue bars denote a histogram of data divided into 1 sec bins. Red curve is a Poisson curve with rate = median count rate of data. |
 |
 |
| Quadrant-wise count rates Data is divided into 100 sec bins |
 |
|
| Module-wise count rates for Quadrant A Data is divided into 100 sec bins |
 |
 |
| Module-wise count rates for Quadrant B Data is divided into 100 sec bins |
 |
 |
| Module-wise count rates for Quadrant C Data is divided into 100 sec bins |
 |
 |
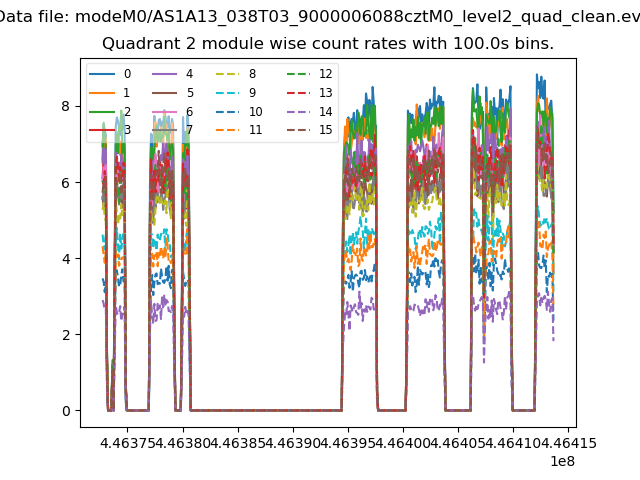
| Module-wise count rates for Quadrant D Data is divided into 100 sec bins |
 |
 |
| Parameter | Plot |
|---|---|
| CZT HV Monitor |  |
| D_VDD | 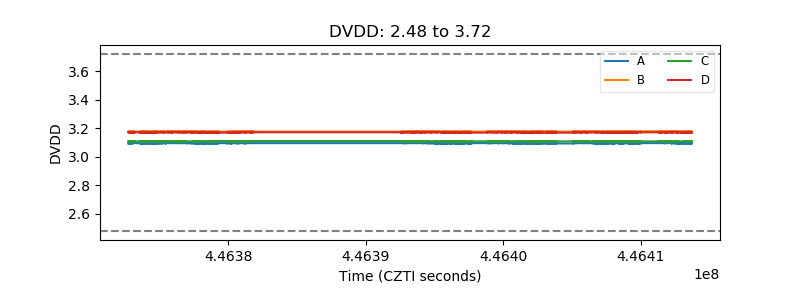 |
| Temperature 1 |  |
| Veto HV Monitor |  |
| Veto LLD |  |
| Alpha Counter |  |
| _CPM_Rate |  |
| CZT Counter | 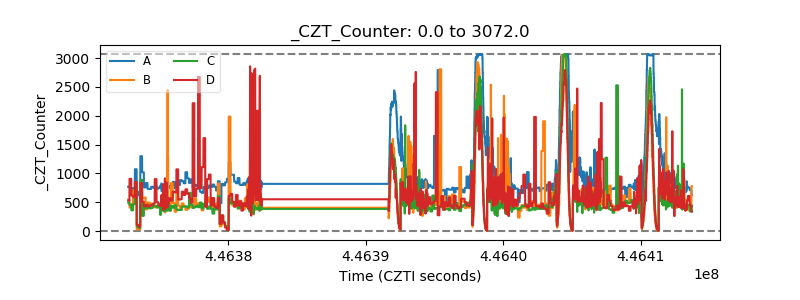 |
| +2.5 Volts monitor |  |
| +5 Volts monitor |  |
| _ROLL_ROT |  |
| _Roll_DEC | 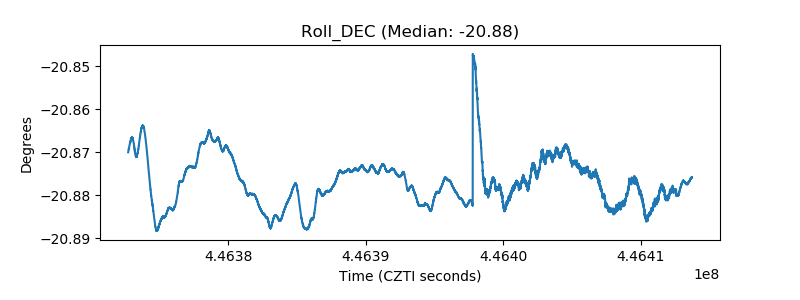 |
| _Roll_RA |  |
| Veto Counter |  |