| Param | Original file | Final file |
|---|---|---|
| Filename | modeM0/AS1A13_054T01_9000006098cztM0_level2.fits | modeM0/AS1A13_054T01_9000006098cztM0_level2_quad_clean.evt |
| Size (bytes) | 915,024,960 | 946,342,080 |
| Size | 872.6 MB | 902.5 MB |
| Events in quadrant A | 5,391,997 | 5,581,253 |
| Events in quadrant B | 5,271,246 | 5,777,761 |
| Events in quadrant C | 5,535,743 | 5,535,399 |
| Events in quadrant D | 4,590,734 | 4,850,003 |
| Mode M0 | |||
|---|---|---|---|
| Quadrant | BADHDUFLAG | Total packets | Discarded packets |
| A | 0 | 322110 | 0 |
| B | 0 | 230734 | 0 |
| C | 0 | 218799 | 0 |
| D | 0 | 290637 | 0 |
| Mode SS | |||
|---|---|---|---|
| Quadrant | BADHDUFLAG | Total packets | Discarded packets |
| A | 0 | 2054 | 0 |
| B | 0 | 2056 | 0 |
| C | 0 | 2054 | 0 |
| D | 0 | 2051 | 0 |
| Mode M9 | |||
|---|---|---|---|
| Quadrant | BADHDUFLAG | Total packets | Discarded packets |
| A | 0 | 150 | 0 |
| B | 0 | 150 | 0 |
| C | 0 | 150 | 0 |
| D | 0 | 150 | 0 |
| Quadrant | Total seconds | Saturated seconds | Saturation percentage |
|---|---|---|---|
| A | 100877 | 2832 | 2.807379% |
| B | 100949 | 3787 | 3.751399% |
| C | 100946 | 1500 | 1.485943% |
| D | 100854 | 5224 | 5.179765% |
Noise dominated data is calculated using 1-second bins in cleaned event files. If a bin has >2000 counts, and if more than 50% of those come from <1% of pixels, then it is considered to be noise-dominated and hence unusable.
| Quadrant | # 1 sec bins | Bins with >0 counts | Bins with >2000 counts | High rate bins dominated by noise | Noise dominated (total time) | Noise dominated (detector-on time) | Marked lightcurve |
|---|---|---|---|---|---|---|---|
| A | 135440 | 101042 | 0 | 0 | 0.00% | 0.00% |  |
| B | 135440 | 100892 | 0 | 0 | 0.00% | 0.00% |  |
| C | 135440 | 101062 | 0 | 0 | 0.00% | 0.00% | 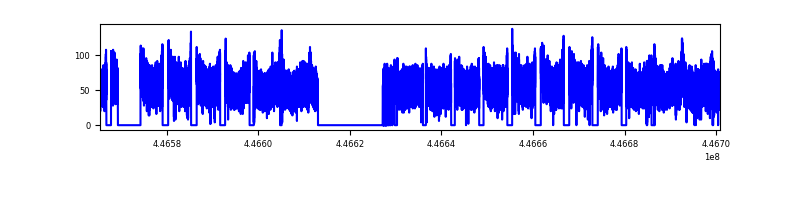 |
| D | 135440 | 100878 | 0 | 0 | 0.00% | 0.00% |  |
Top three noisy pixels from each quadrant. If the there are fewer than three noisy pixels in the level2.evt file, extra rows are filled as -1
| Pixel properties | Quadrant properties | ||||||
|---|---|---|---|---|---|---|---|
| Quadrant | DetID | PixID | Counts | Sigma | Mean | Median | Sigma |
| A | 7 | 110 | 4564 | 9.15 | 1406 | 1311 | 355.3 |
| A | 15 | 236 | 4334 | 8.51 | 1406 | 1311 | 355.3 |
| A | 14 | 95 | 4105 | 7.86 | 1406 | 1311 | 355.3 |
| B | 2 | 9 | 4886 | 13.22 | 1391 | 1324 | 269.4 |
| B | 2 | 8 | 3983 | 9.87 | 1391 | 1324 | 269.4 |
| B | 3 | 17 | 3906 | 9.58 | 1391 | 1324 | 269.4 |
| C | 1 | 81 | 4147 | 7.35 | 1464 | 1359 | 379.3 |
| C | 3 | 202 | 4105 | 7.24 | 1464 | 1359 | 379.3 |
| C | 1 | 80 | 4046 | 7.08 | 1464 | 1359 | 379.3 |
| D | 10 | 189 | 3451 | 6.11 | 1322 | 1202 | 368.0 |
| D | 12 | 6 | 3342 | 5.81 | 1322 | 1202 | 368.0 |
| D | 7 | 3 | 3288 | 5.67 | 1322 | 1202 | 368.0 |
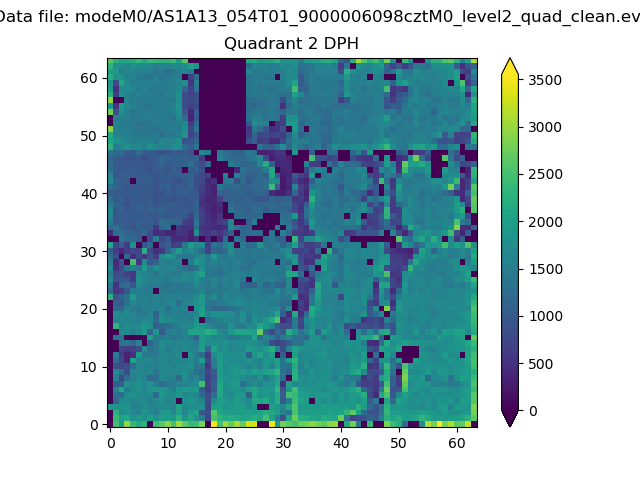
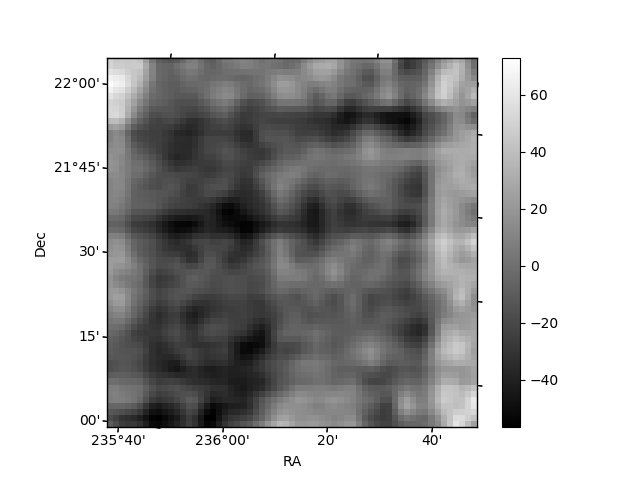
Histogram calculated using DETX and DETY for each event in the final _common_clean file
| Quadrant A | 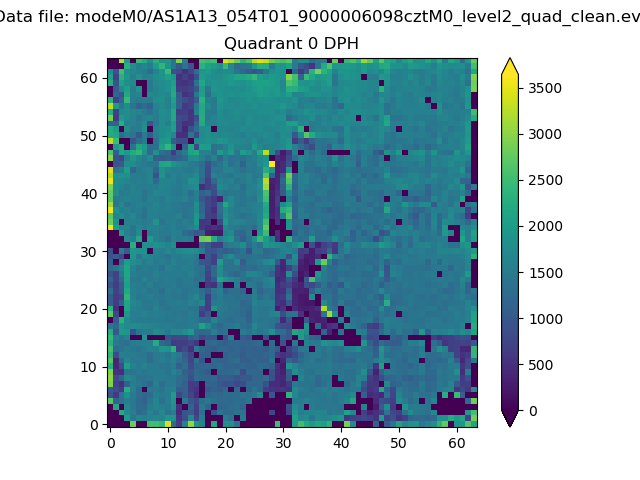 |
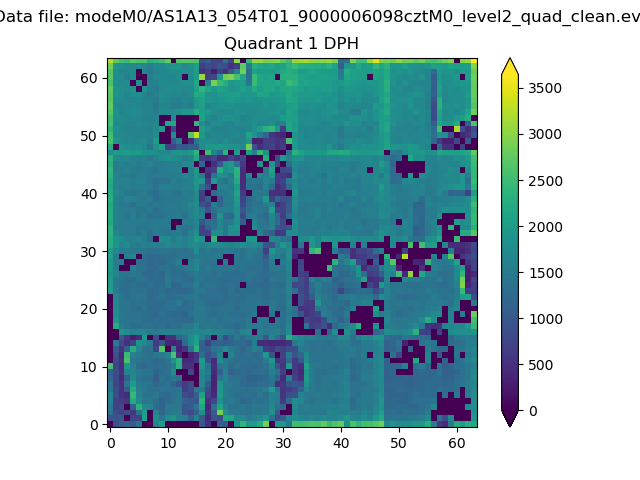 |
Quadrant B |
|---|---|---|---|
| Quadrant D | 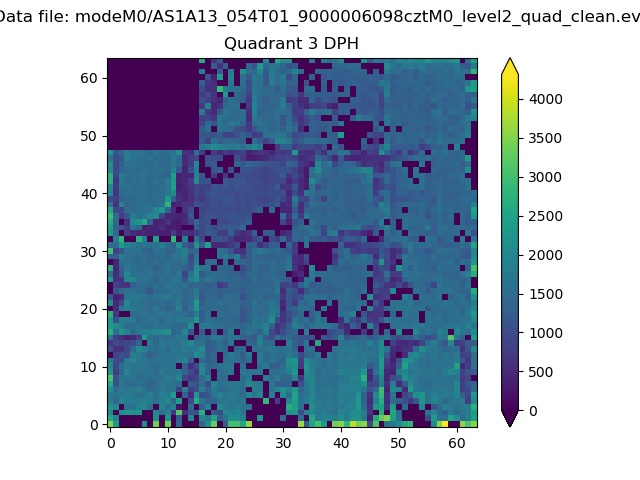 |
 |
Quadrant C |
| Plot type | Count rate plots | Images |
|---|---|---|
| Comparison with Poisson distribution Blue bars denote a histogram of data divided into 1 sec bins. Red curve is a Poisson curve with rate = median count rate of data. |
 |
 |
| Quadrant-wise count rates Data is divided into 100 sec bins |
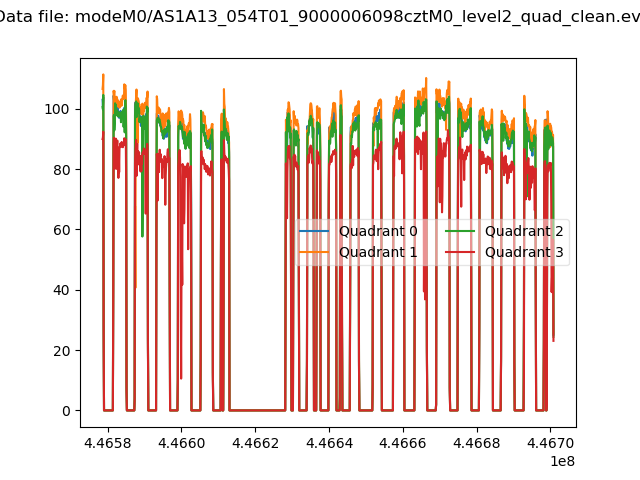 |
|
| Module-wise count rates for Quadrant A Data is divided into 100 sec bins |
 |
 |
| Module-wise count rates for Quadrant B Data is divided into 100 sec bins |
 |
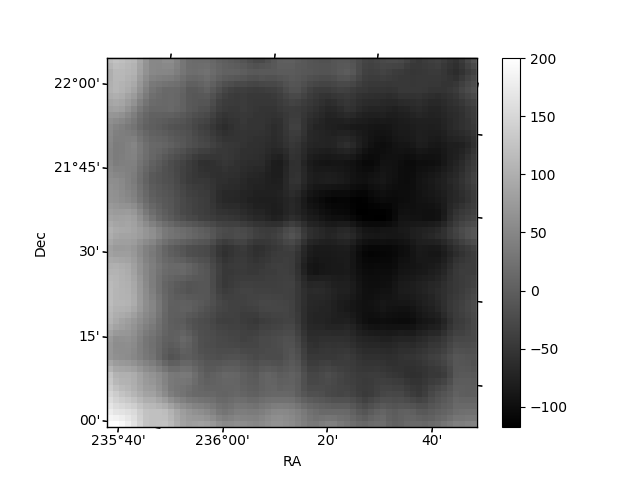 |
| Module-wise count rates for Quadrant C Data is divided into 100 sec bins |
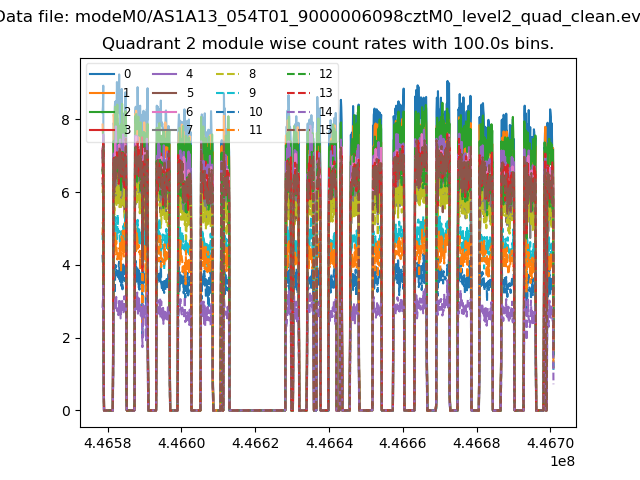 |
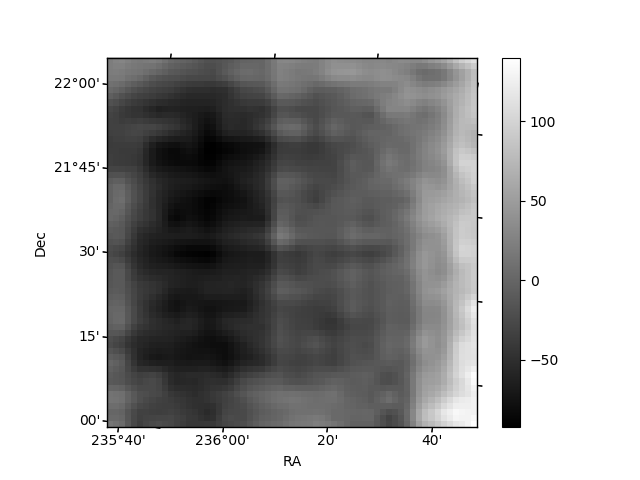 |
| Module-wise count rates for Quadrant D Data is divided into 100 sec bins |
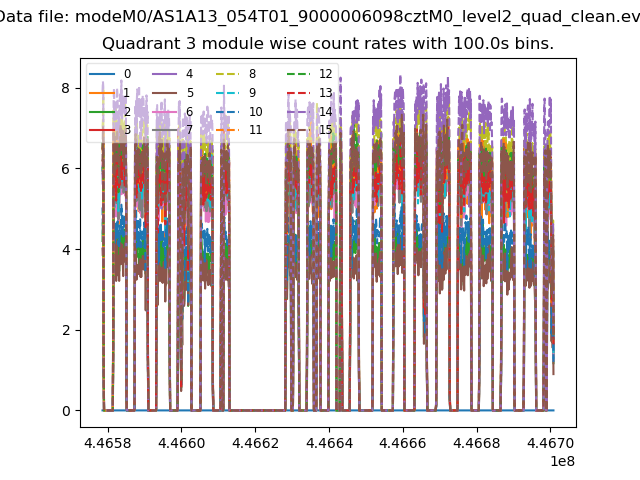 |
 |
| Parameter | Plot |
|---|---|
| CZT HV Monitor | 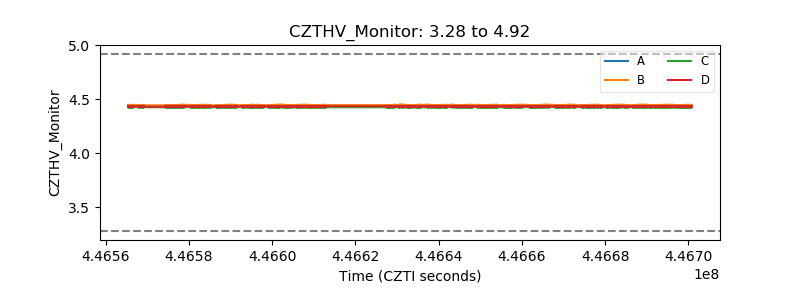 |
| D_VDD | 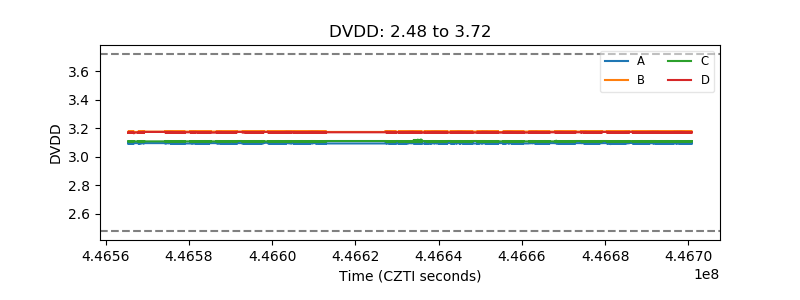 |
| Temperature 1 |  |
| Veto HV Monitor |  |
| Veto LLD | 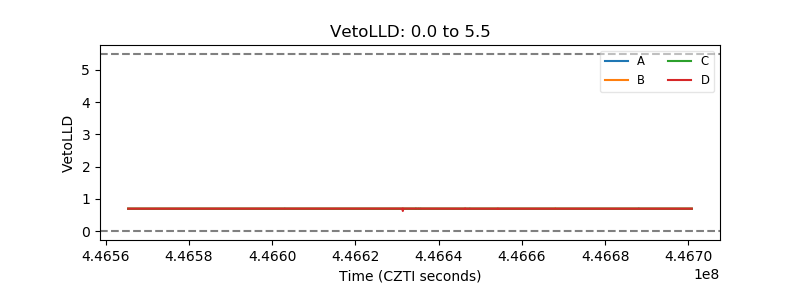 |
| Alpha Counter | 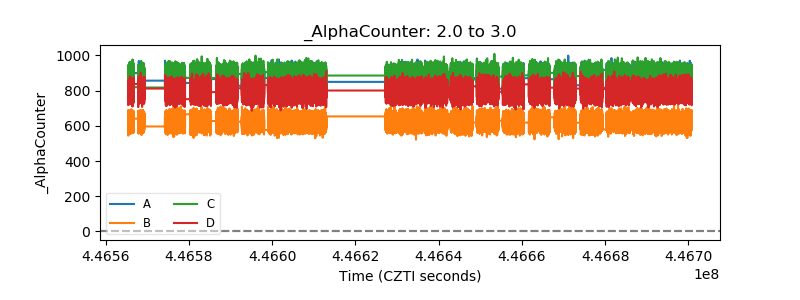 |
| _CPM_Rate | 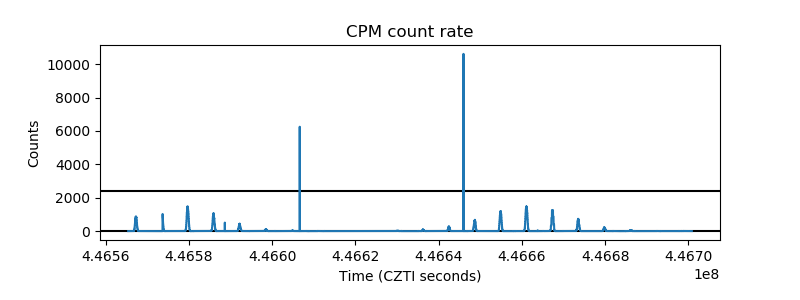 |
| CZT Counter | 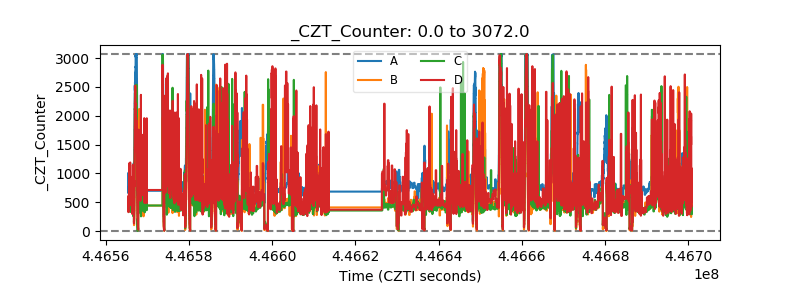 |
| +2.5 Volts monitor | 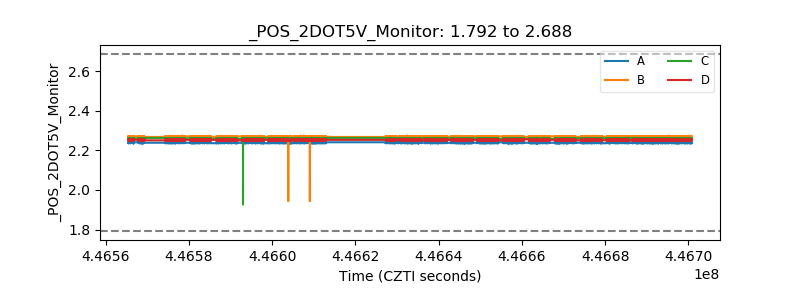 |
| +5 Volts monitor | 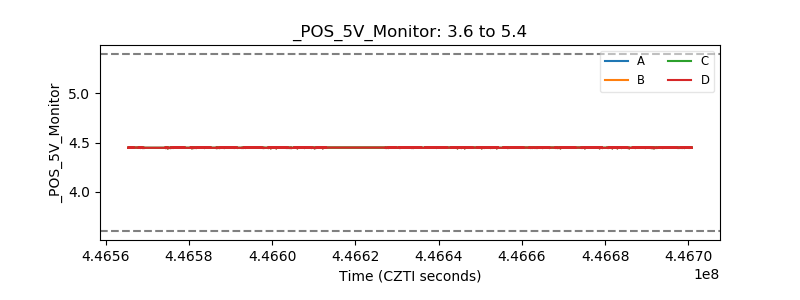 |
| _ROLL_ROT |  |
| _Roll_DEC |  |
| _Roll_RA | 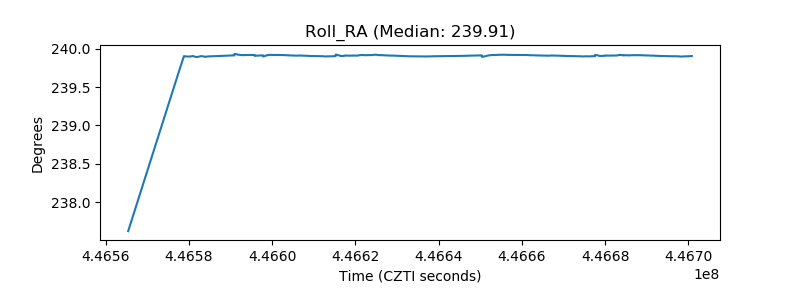 |
| Veto Counter | 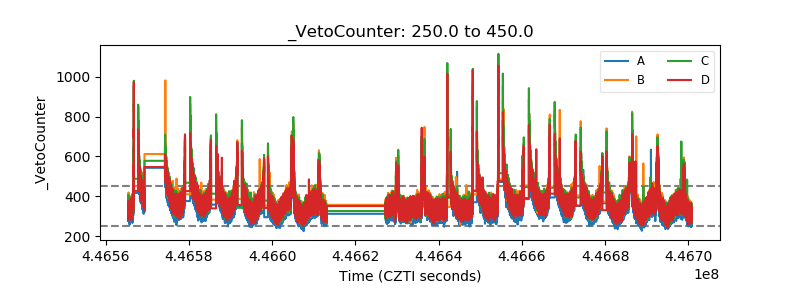 |