| Param | Original file | Final file |
|---|---|---|
| Filename | modeM0/AS1A13_031T01_9000006102cztM0_level2.fits | modeM0/AS1A13_031T01_9000006102cztM0_level2_quad_clean.evt |
| Size (bytes) | 388,895,040 | 432,601,920 |
| Size | 370.9 MB | 412.6 MB |
| Events in quadrant A | 2,289,040 | 2,612,606 |
| Events in quadrant B | 2,229,988 | 2,659,037 |
| Events in quadrant C | 2,345,024 | 2,612,259 |
| Events in quadrant D | 1,881,238 | 2,188,086 |
| Mode M0 | |||
|---|---|---|---|
| Quadrant | BADHDUFLAG | Total packets | Discarded packets |
| A | 0 | 139559 | 0 |
| B | 0 | 103574 | 0 |
| C | 0 | 91645 | 0 |
| D | 0 | 136935 | 0 |
| Mode M9 | |||
|---|---|---|---|
| Quadrant | BADHDUFLAG | Total packets | Discarded packets |
| A | 0 | 44 | 0 |
| B | 0 | 44 | 0 |
| C | 0 | 44 | 0 |
| D | 0 | 44 | 0 |
| Mode SS | |||
|---|---|---|---|
| Quadrant | BADHDUFLAG | Total packets | Discarded packets |
| A | 0 | 892 | 0 |
| B | 0 | 892 | 0 |
| C | 0 | 892 | 0 |
| D | 0 | 892 | 0 |
| Quadrant | Total seconds | Saturated seconds | Saturation percentage |
|---|---|---|---|
| A | 44147 | 1112 | 2.518857% |
| B | 44148 | 1570 | 3.556220% |
| C | 44147 | 256 | 0.579881% |
| D | 44147 | 4855 | 10.997350% |
Noise dominated data is calculated using 1-second bins in cleaned event files. If a bin has >2000 counts, and if more than 50% of those come from <1% of pixels, then it is considered to be noise-dominated and hence unusable.
| Quadrant | # 1 sec bins | Bins with >0 counts | Bins with >2000 counts | High rate bins dominated by noise | Noise dominated (total time) | Noise dominated (detector-on time) | Marked lightcurve |
|---|---|---|---|---|---|---|---|
| A | 52352 | 44149 | 0 | 0 | 0.00% | 0.00% | 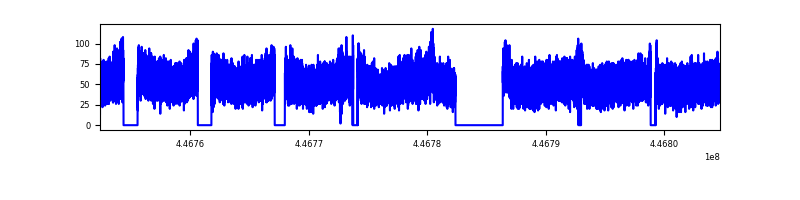 |
| B | 52352 | 44139 | 0 | 0 | 0.00% | 0.00% | 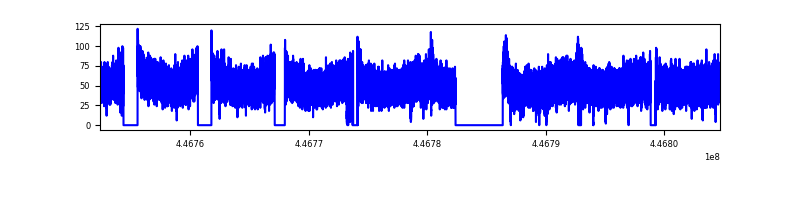 |
| C | 52352 | 44148 | 0 | 0 | 0.00% | 0.00% | 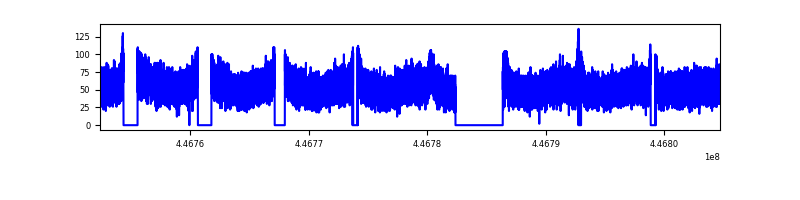 |
| D | 52352 | 43545 | 0 | 0 | 0.00% | 0.00% | 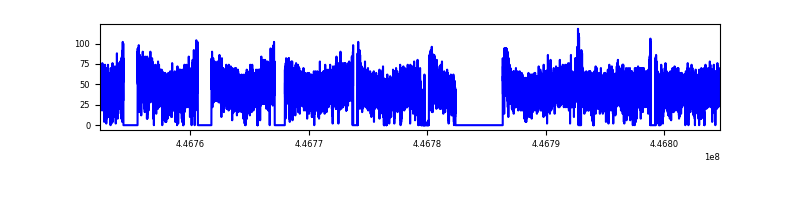 |
Top three noisy pixels from each quadrant. If the there are fewer than three noisy pixels in the level2.evt file, extra rows are filled as -1
| Pixel properties | Quadrant properties | ||||||
|---|---|---|---|---|---|---|---|
| Quadrant | DetID | PixID | Counts | Sigma | Mean | Median | Sigma |
| A | 15 | 236 | 1880 | 8.6 | 596 | 556 | 154.0 |
| A | 7 | 110 | 1852 | 8.41 | 596 | 556 | 154.0 |
| A | 0 | 29 | 1792 | 8.02 | 596 | 556 | 154.0 |
| B | 2 | 9 | 2097 | 13.03 | 588 | 558 | 118.1 |
| B | 2 | 8 | 1697 | 9.64 | 588 | 558 | 118.1 |
| B | 3 | 17 | 1589 | 8.73 | 588 | 558 | 118.1 |
| C | 3 | 202 | 1820 | 7.78 | 619 | 577 | 159.7 |
| C | 3 | 203 | 1786 | 7.57 | 619 | 577 | 159.7 |
| C | 1 | 81 | 1714 | 7.12 | 619 | 577 | 159.7 |
| D | 8 | 176 | 1659 | 7.77 | 539 | 489 | 150.6 |
| D | 12 | 6 | 1389 | 5.98 | 539 | 489 | 150.6 |
| D | 6 | 38 | 1337 | 5.63 | 539 | 489 | 150.6 |
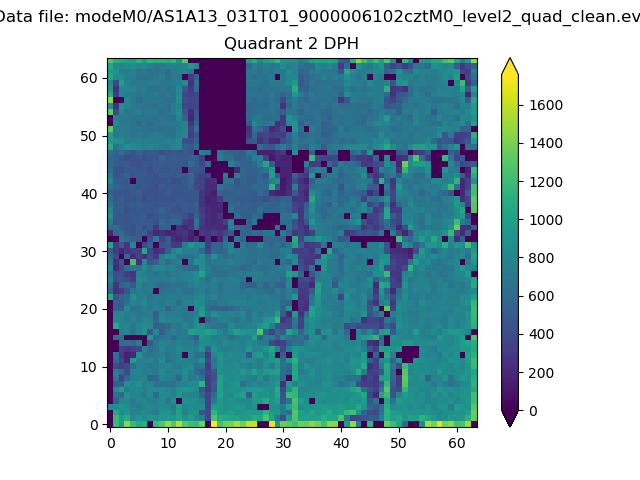
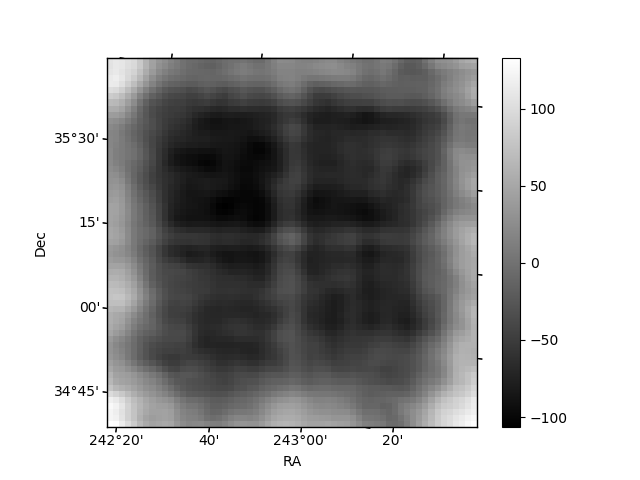
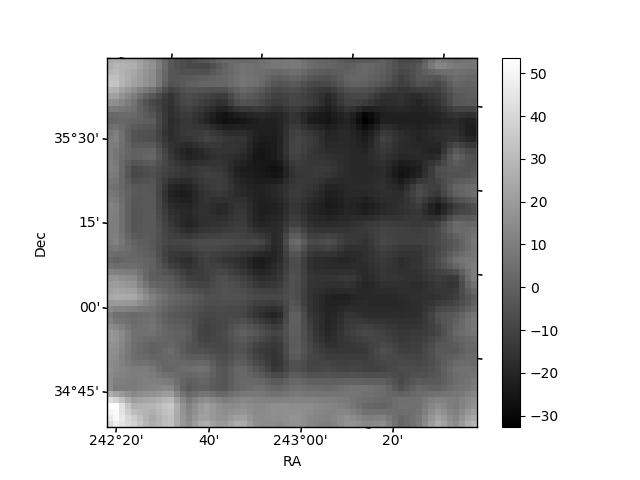
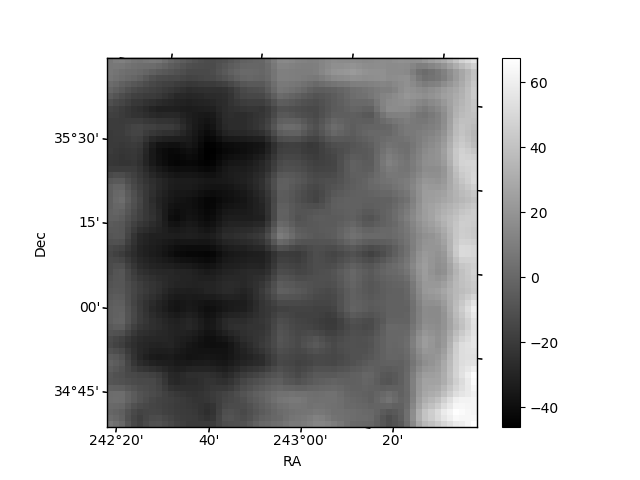
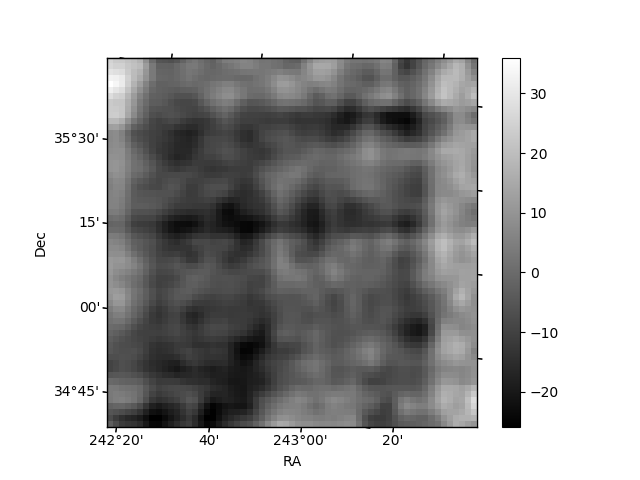
Histogram calculated using DETX and DETY for each event in the final _common_clean file
| Quadrant A | 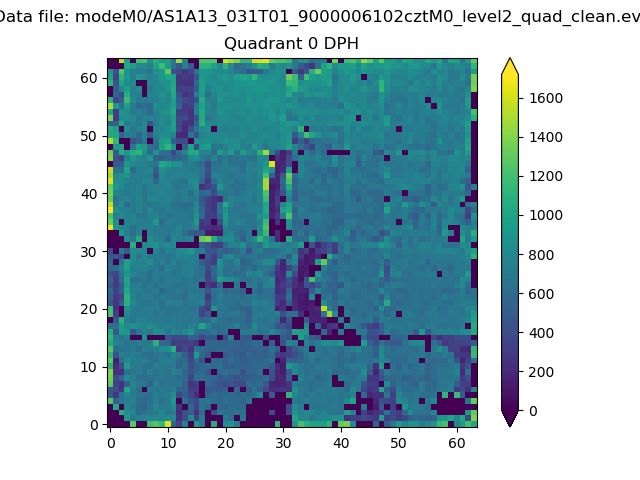 |
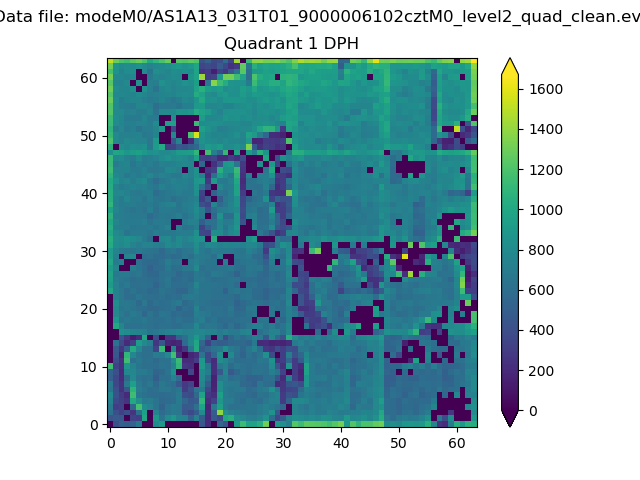 |
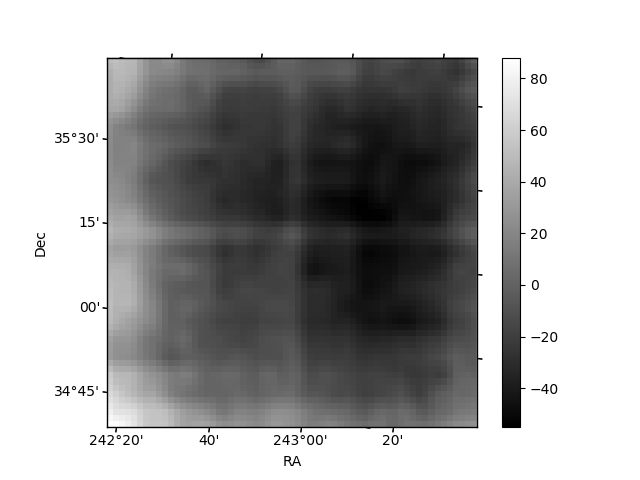
Quadrant B |
|---|---|---|---|
| Quadrant D | 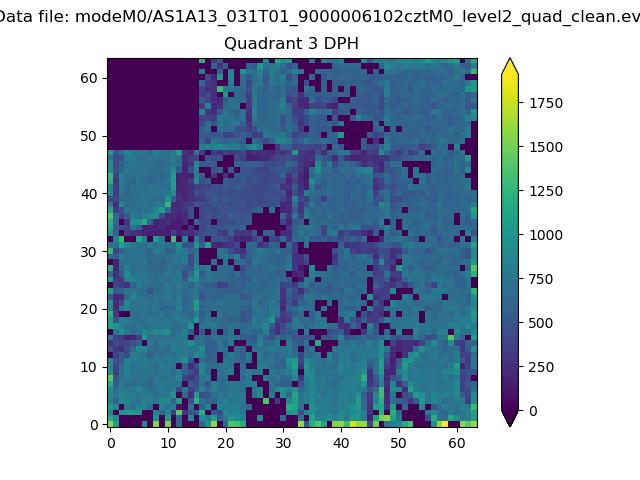 |
 |
Quadrant C |
| Plot type | Count rate plots | Images |
|---|---|---|
| Comparison with Poisson distribution Blue bars denote a histogram of data divided into 1 sec bins. Red curve is a Poisson curve with rate = median count rate of data. |
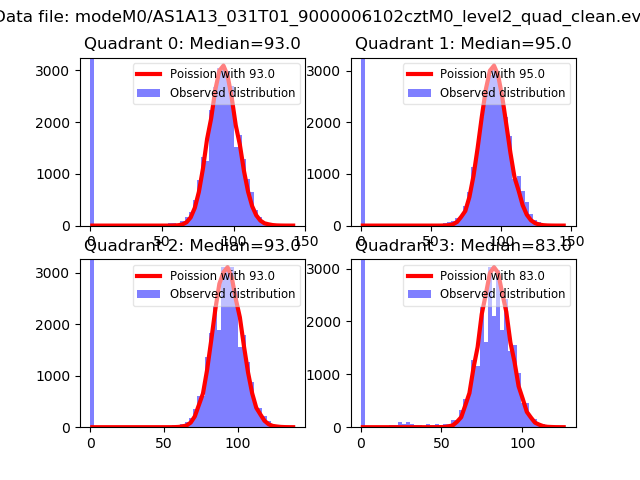 |
 |
| Quadrant-wise count rates Data is divided into 100 sec bins |
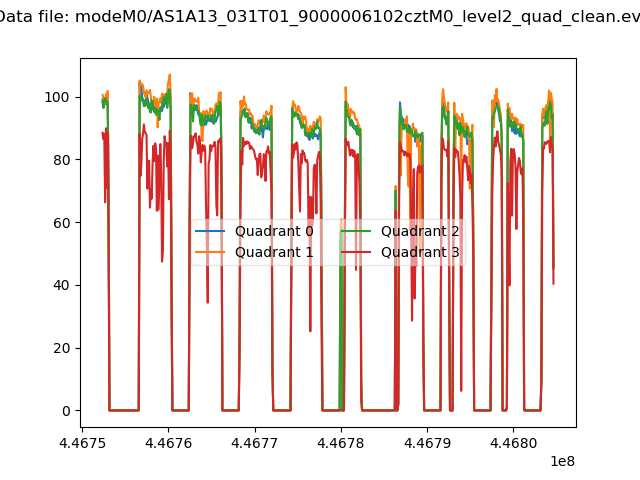 |
|
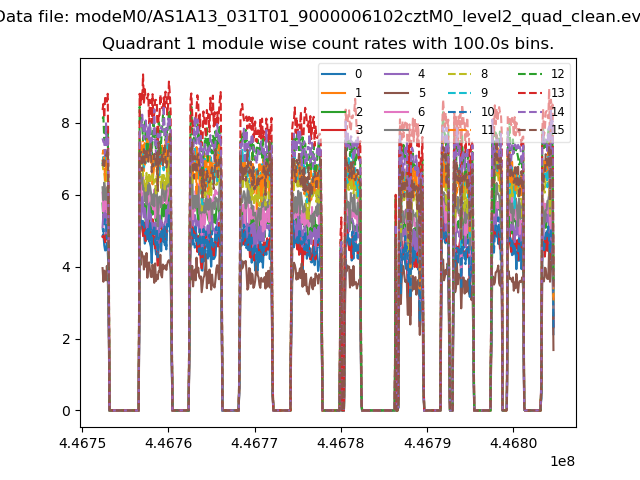
| Module-wise count rates for Quadrant A Data is divided into 100 sec bins |
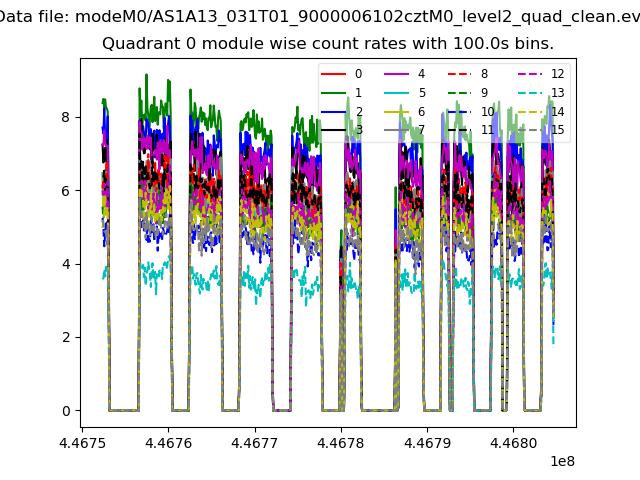 |
 |
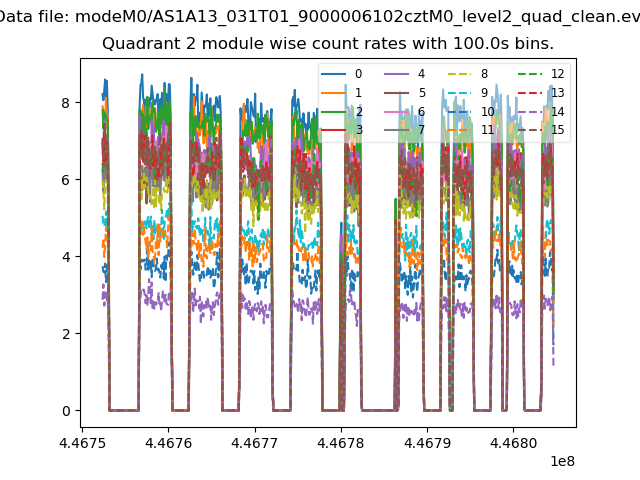
| Module-wise count rates for Quadrant B Data is divided into 100 sec bins |
 |
 |
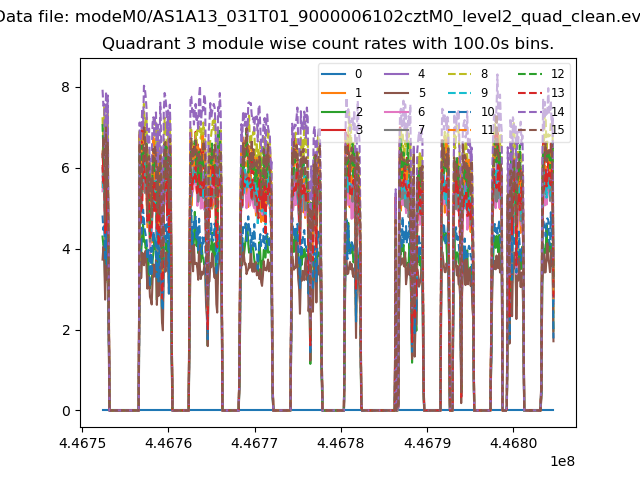
| Module-wise count rates for Quadrant C Data is divided into 100 sec bins |
 |
 |
| Module-wise count rates for Quadrant D Data is divided into 100 sec bins |
 |
 |
| Parameter | Plot |
|---|---|
| CZT HV Monitor | 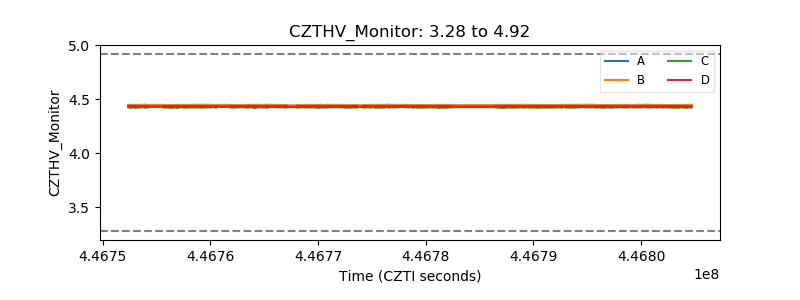 |
| D_VDD | 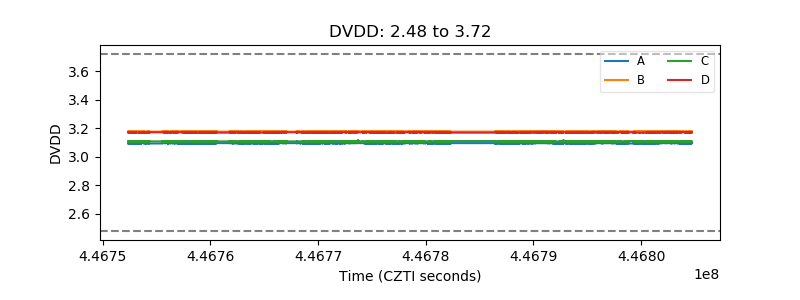 |
| Temperature 1 | 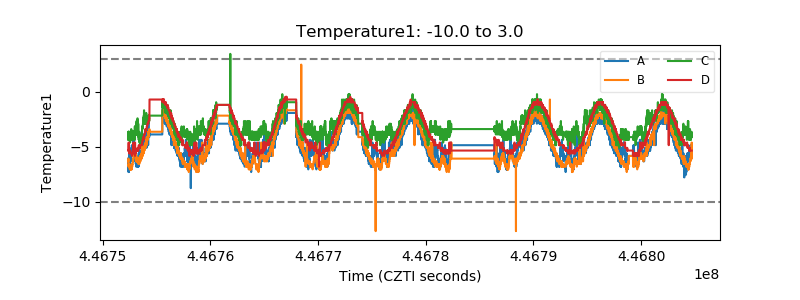 |
| Veto HV Monitor | 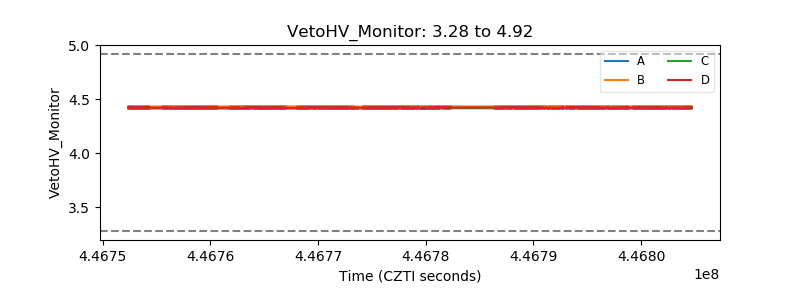 |
| Veto LLD | 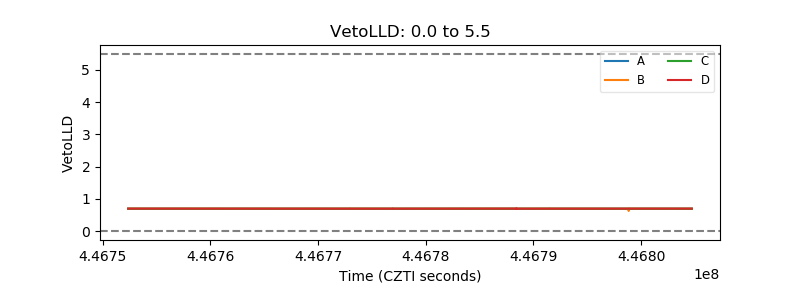 |
| Alpha Counter | 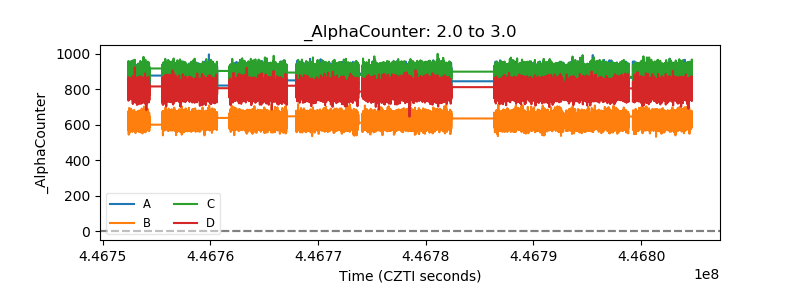 |
| _CPM_Rate | 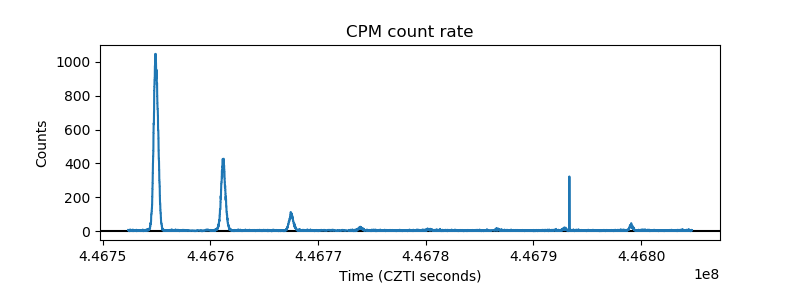 |
| CZT Counter | 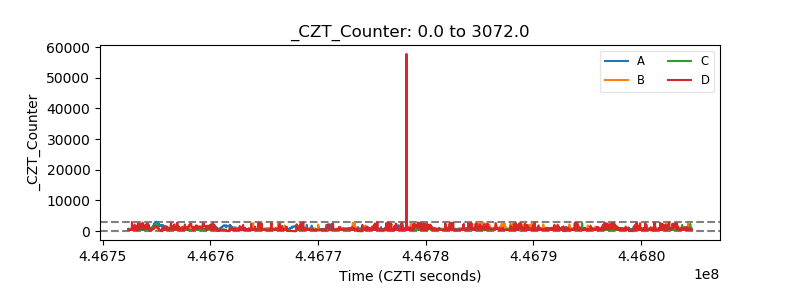 |
| +2.5 Volts monitor | 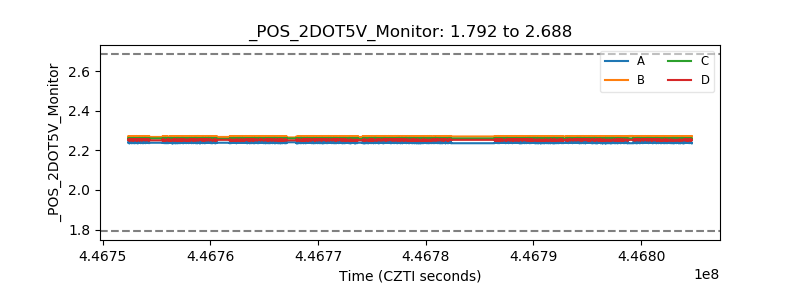 |
| +5 Volts monitor | 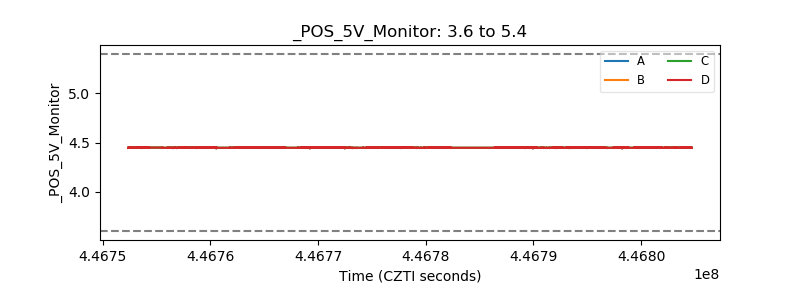 |
| _ROLL_ROT | 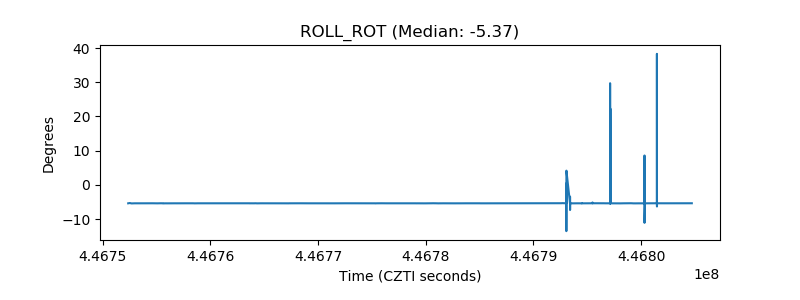 |
| _Roll_DEC | 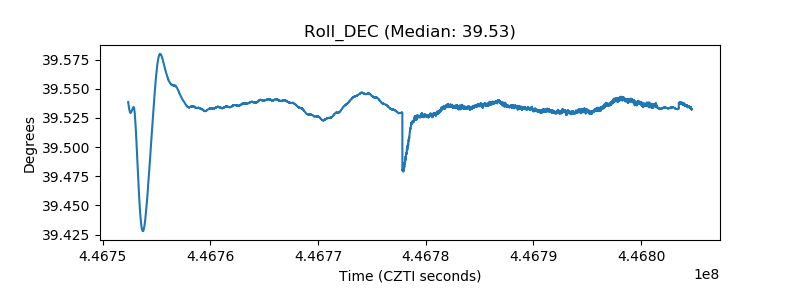 |
| _Roll_RA | 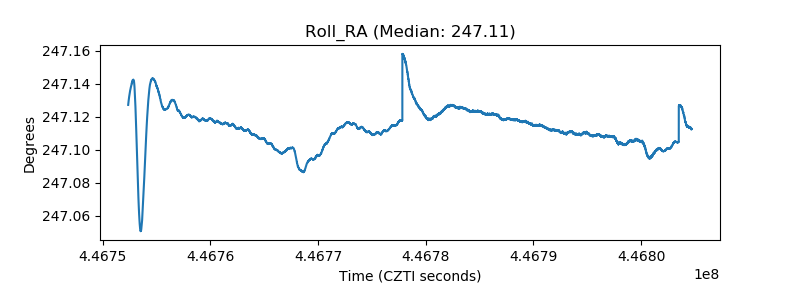 |
| Veto Counter | 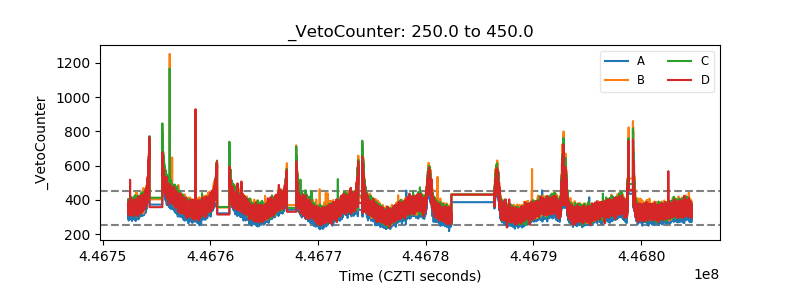 |