| Param | Original file | Final file |
|---|---|---|
| Filename | modeM0/AS1A13_071T01_9000006104cztM0_level2.fits | modeM0/AS1A13_071T01_9000006104cztM0_level2_quad_clean.evt |
| Size (bytes) | 337,777,920 | 383,624,640 |
| Size | 322.1 MB | 365.9 MB |
| Events in quadrant A | 2,000,892 | 2,354,106 |
| Events in quadrant B | 1,956,706 | 2,404,036 |
| Events in quadrant C | 2,012,146 | 2,274,214 |
| Events in quadrant D | 1,670,416 | 1,998,530 |
| Mode SS | |||
|---|---|---|---|
| Quadrant | BADHDUFLAG | Total packets | Discarded packets |
| A | 0 | 766 | 0 |
| B | 0 | 766 | 0 |
| C | 0 | 766 | 0 |
| D | 0 | 766 | 0 |
| Mode M9 | |||
|---|---|---|---|
| Quadrant | BADHDUFLAG | Total packets | Discarded packets |
| A | 0 | 76 | 0 |
| B | 0 | 76 | 0 |
| C | 0 | 76 | 0 |
| D | 0 | 76 | 0 |
| Mode M0 | |||
|---|---|---|---|
| Quadrant | BADHDUFLAG | Total packets | Discarded packets |
| A | 0 | 123562 | 0 |
| B | 0 | 86253 | 0 |
| C | 0 | 83210 | 0 |
| D | 0 | 110093 | 0 |
| Quadrant | Total seconds | Saturated seconds | Saturation percentage |
|---|---|---|---|
| A | 37679 | 1383 | 3.670480% |
| B | 37679 | 1402 | 3.720906% |
| C | 37679 | 831 | 2.205473% |
| D | 37679 | 2495 | 6.621726% |
Noise dominated data is calculated using 1-second bins in cleaned event files. If a bin has >2000 counts, and if more than 50% of those come from <1% of pixels, then it is considered to be noise-dominated and hence unusable.
| Quadrant | # 1 sec bins | Bins with >0 counts | Bins with >2000 counts | High rate bins dominated by noise | Noise dominated (total time) | Noise dominated (detector-on time) | Marked lightcurve |
|---|---|---|---|---|---|---|---|
| A | 45164 | 37678 | 0 | 0 | 0.00% | 0.00% | 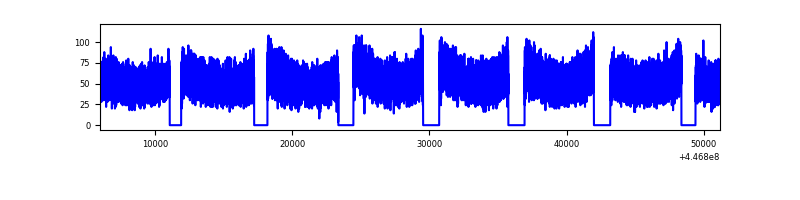 |
| B | 45164 | 37666 | 0 | 0 | 0.00% | 0.00% | 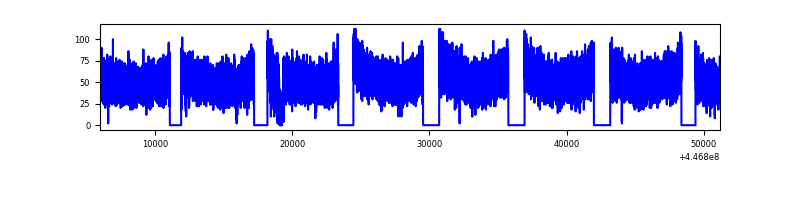 |
| C | 45164 | 37663 | 0 | 0 | 0.00% | 0.00% | 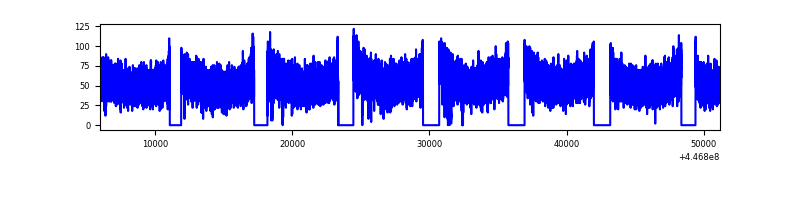 |
| D | 45164 | 37622 | 0 | 0 | 0.00% | 0.00% |  |
Top three noisy pixels from each quadrant. If the there are fewer than three noisy pixels in the level2.evt file, extra rows are filled as -1
| Pixel properties | Quadrant properties | ||||||
|---|---|---|---|---|---|---|---|
| Quadrant | DetID | PixID | Counts | Sigma | Mean | Median | Sigma |
| A | 7 | 110 | 1644 | 8.5 | 522 | 488 | 136.0 |
| A | 15 | 236 | 1550 | 7.81 | 522 | 488 | 136.0 |
| A | 0 | 29 | 1541 | 7.74 | 522 | 488 | 136.0 |
| B | 2 | 9 | 1868 | 13.55 | 516 | 492 | 101.5 |
| B | 2 | 8 | 1493 | 9.86 | 516 | 492 | 101.5 |
| B | 3 | 17 | 1365 | 8.6 | 516 | 492 | 101.5 |
| C | 3 | 203 | 1530 | 7.42 | 532 | 496 | 139.4 |
| C | 1 | 81 | 1517 | 7.33 | 532 | 496 | 139.4 |
| C | 3 | 202 | 1514 | 7.31 | 532 | 496 | 139.4 |
| D | 8 | 176 | 1603 | 8.62 | 479 | 433 | 135.7 |
| D | 12 | 6 | 1226 | 5.84 | 479 | 433 | 135.7 |
| D | 10 | 189 | 1223 | 5.82 | 479 | 433 | 135.7 |
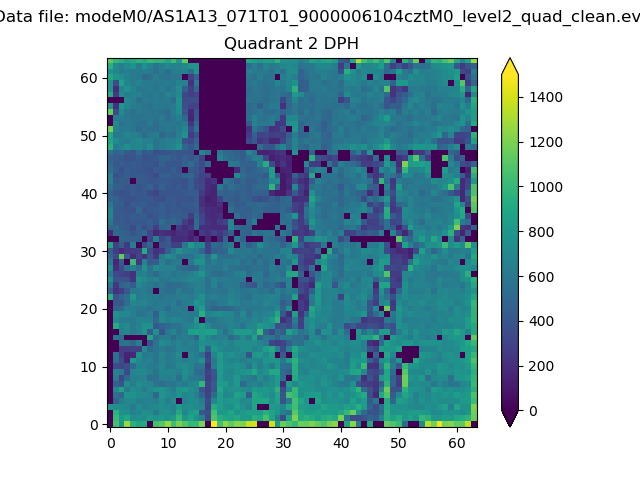
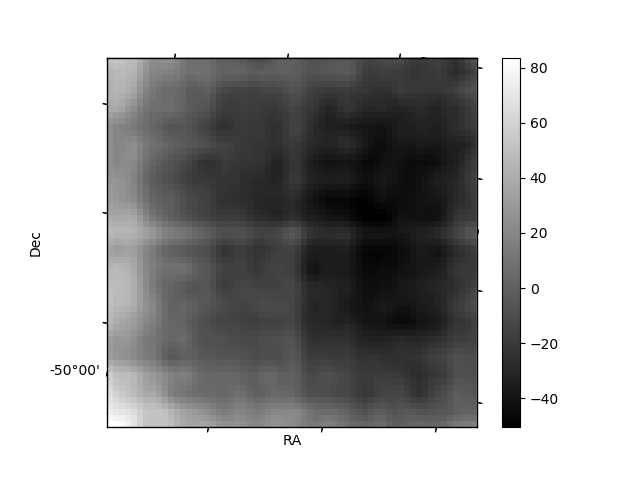
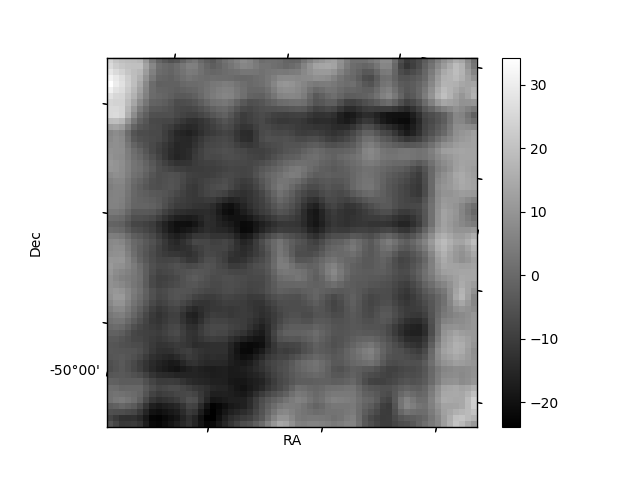
Histogram calculated using DETX and DETY for each event in the final _common_clean file
| Quadrant A | 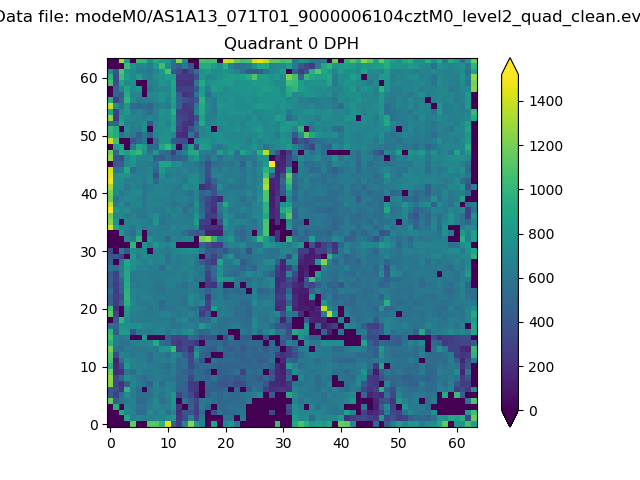 |
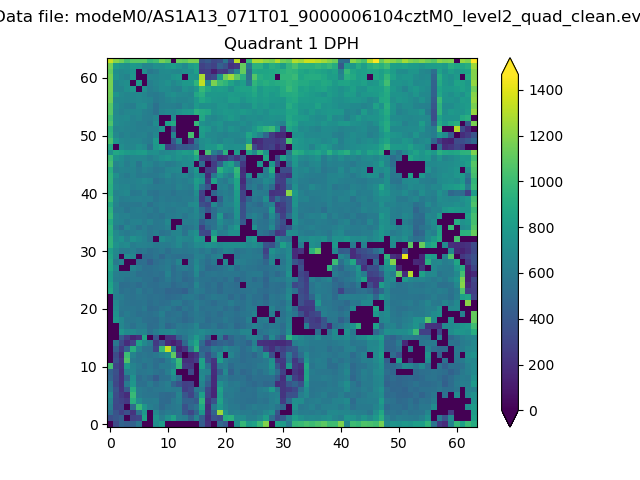 |
Quadrant B |
|---|---|---|---|
| Quadrant D | 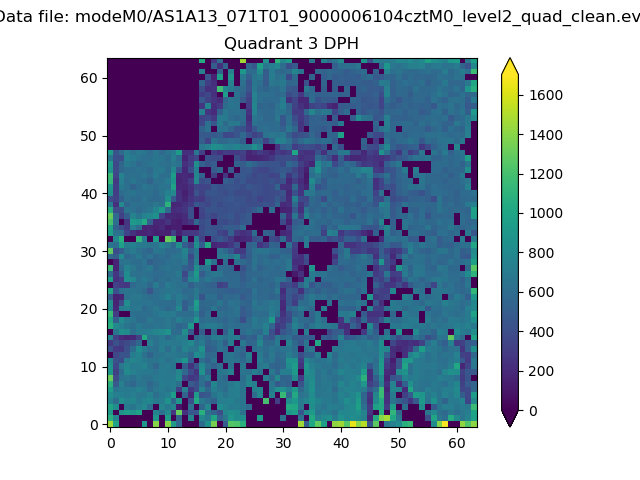 |
 |
Quadrant C |
| Plot type | Count rate plots | Images |
|---|---|---|
| Comparison with Poisson distribution Blue bars denote a histogram of data divided into 1 sec bins. Red curve is a Poisson curve with rate = median count rate of data. |
 |
 |
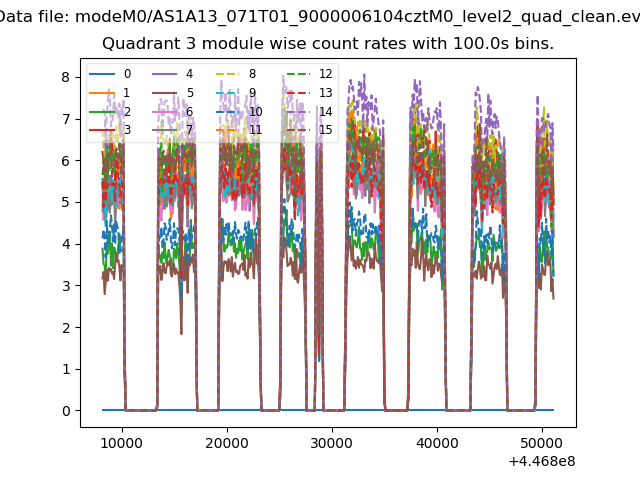
| Quadrant-wise count rates Data is divided into 100 sec bins |
 |
|
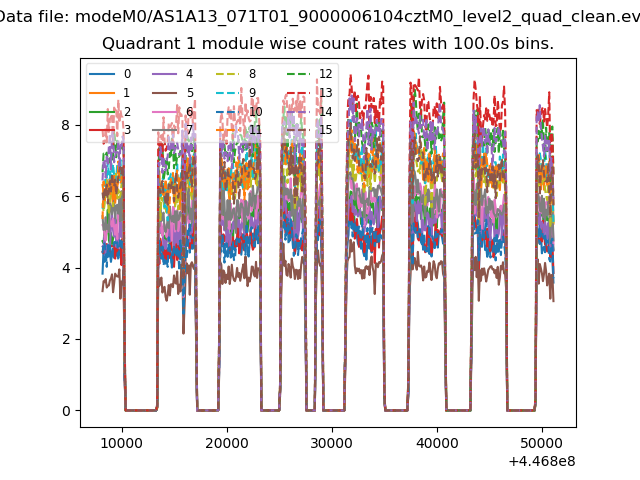
| Module-wise count rates for Quadrant A Data is divided into 100 sec bins |
 |
 |
| Module-wise count rates for Quadrant B Data is divided into 100 sec bins |
 |
 |
| Module-wise count rates for Quadrant C Data is divided into 100 sec bins |
 |
 |
| Module-wise count rates for Quadrant D Data is divided into 100 sec bins |
 |
 |
| Parameter | Plot |
|---|---|
| CZT HV Monitor | 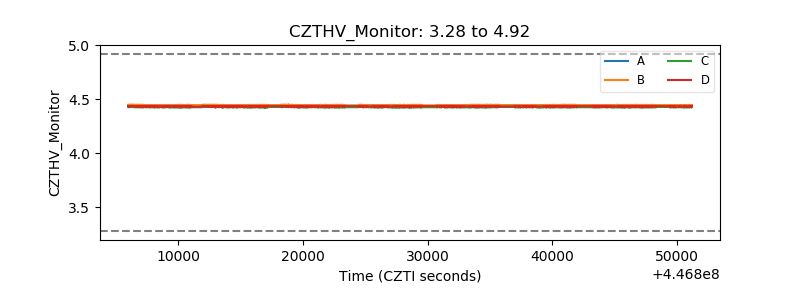 |
| D_VDD | 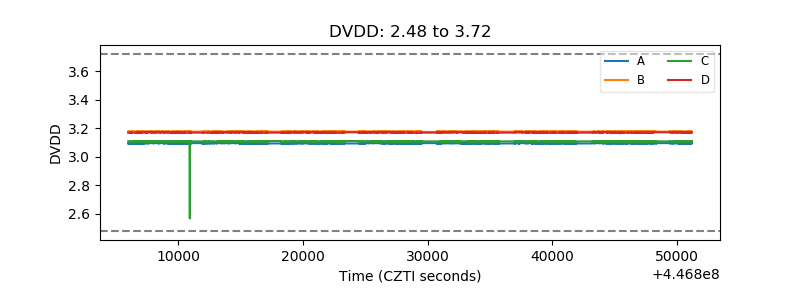 |
| Temperature 1 |  |
| Veto HV Monitor |  |
| Veto LLD |  |
| Alpha Counter |  |
| _CPM_Rate |  |
| CZT Counter |  |
| +2.5 Volts monitor |  |
| +5 Volts monitor |  |
| _ROLL_ROT | 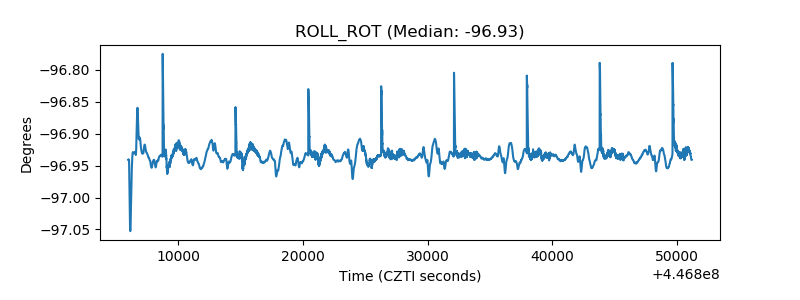 |
| _Roll_DEC |  |
| _Roll_RA | 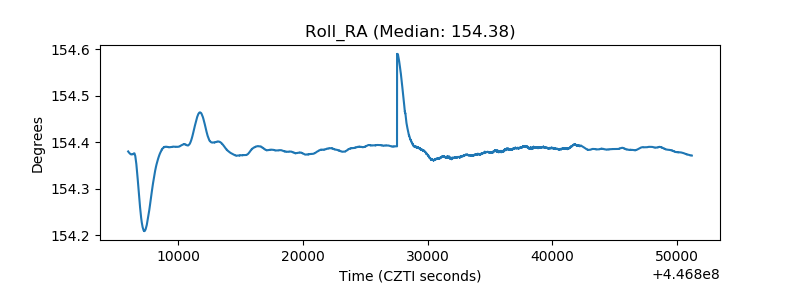 |
| Veto Counter | 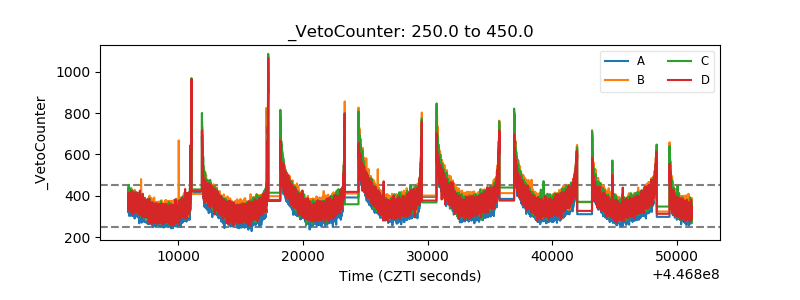 |