| Param | Original file | Final file |
|---|---|---|
| Filename | modeM0/AS1A13_082T02_9000006112cztM0_level2.fits | modeM0/AS1A13_082T02_9000006112cztM0_level2_quad_clean.evt |
| Size (bytes) | 578,010,240 | 682,565,760 |
| Size | 551.2 MB | 650.9 MB |
| Events in quadrant A | 3,472,040 | 4,284,806 |
| Events in quadrant B | 3,379,176 | 4,402,507 |
| Events in quadrant C | 3,523,942 | 4,185,679 |
| Events in quadrant D | 2,694,866 | 3,366,911 |
| Mode M0 | |||
|---|---|---|---|
| Quadrant | BADHDUFLAG | Total packets | Discarded packets |
| A | 0 | 208549 | 0 |
| B | 0 | 149670 | 0 |
| C | 0 | 142612 | 0 |
| D | 0 | 156855 | 0 |
| Mode M9 | |||
|---|---|---|---|
| Quadrant | BADHDUFLAG | Total packets | Discarded packets |
| A | 0 | 84 | 0 |
| B | 0 | 84 | 0 |
| C | 0 | 84 | 0 |
| D | 0 | 84 | 0 |
| Mode SS | |||
|---|---|---|---|
| Quadrant | BADHDUFLAG | Total packets | Discarded packets |
| A | 0 | 1340 | 0 |
| B | 0 | 1340 | 0 |
| C | 0 | 1340 | 0 |
| D | 0 | 1340 | 0 |
| Quadrant | Total seconds | Saturated seconds | Saturation percentage |
|---|---|---|---|
| A | 66120 | 1726 | 2.610405% |
| B | 66129 | 2078 | 3.142343% |
| C | 66120 | 982 | 1.485178% |
| D | 59760 | 1741 | 2.913320% |
Noise dominated data is calculated using 1-second bins in cleaned event files. If a bin has >2000 counts, and if more than 50% of those come from <1% of pixels, then it is considered to be noise-dominated and hence unusable.
| Quadrant | # 1 sec bins | Bins with >0 counts | Bins with >2000 counts | High rate bins dominated by noise | Noise dominated (total time) | Noise dominated (detector-on time) | Marked lightcurve |
|---|---|---|---|---|---|---|---|
| A | 77722 | 66122 | 0 | 0 | 0.00% | 0.00% |  |
| B | 77723 | 66096 | 0 | 0 | 0.00% | 0.00% |  |
| C | 77723 | 66116 | 0 | 0 | 0.00% | 0.00% |  |
| D | 77723 | 59757 | 0 | 0 | 0.00% | 0.00% |  |
Top three noisy pixels from each quadrant. If the there are fewer than three noisy pixels in the level2.evt file, extra rows are filled as -1
| Pixel properties | Quadrant properties | ||||||
|---|---|---|---|---|---|---|---|
| Quadrant | DetID | PixID | Counts | Sigma | Mean | Median | Sigma |
| A | 7 | 110 | 2886 | 8.84 | 904 | 843 | 231.1 |
| A | 0 | 29 | 2715 | 8.1 | 904 | 843 | 231.1 |
| A | 15 | 236 | 2714 | 8.1 | 904 | 843 | 231.1 |
| B | 2 | 9 | 3123 | 13.09 | 892 | 851 | 173.6 |
| B | 2 | 8 | 2564 | 9.87 | 892 | 851 | 173.6 |
| B | 3 | 17 | 2471 | 9.33 | 892 | 851 | 173.6 |
| C | 1 | 81 | 2712 | 7.64 | 932 | 866 | 241.5 |
| C | 1 | 80 | 2648 | 7.38 | 932 | 866 | 241.5 |
| C | 3 | 158 | 2490 | 6.72 | 932 | 866 | 241.5 |
| D | 10 | 189 | 1983 | 5.98 | 776 | 705 | 213.6 |
| D | 6 | 38 | 1947 | 5.82 | 776 | 705 | 213.6 |
| D | 4 | 12 | 1915 | 5.67 | 776 | 705 | 213.6 |
Histogram calculated using DETX and DETY for each event in the final _common_clean file
| Quadrant A | 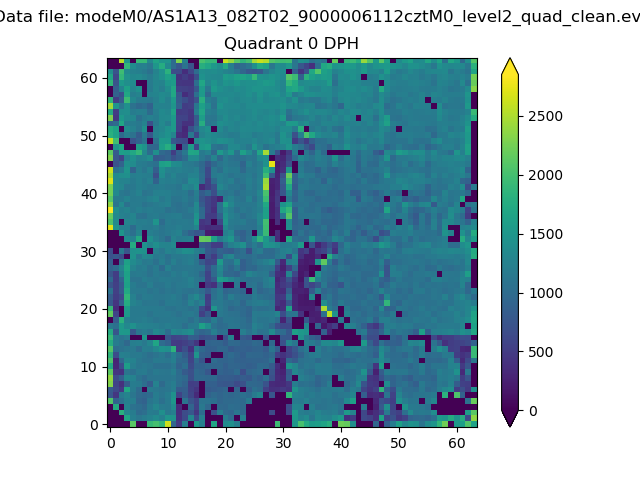 |
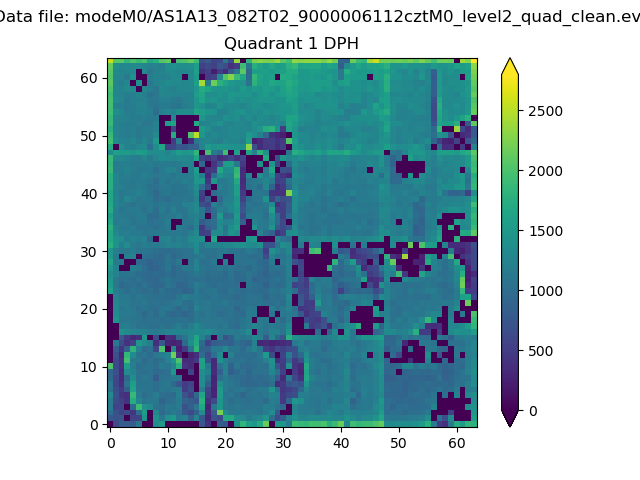 |
Quadrant B |
|---|---|---|---|
| Quadrant D |  |
 |
Quadrant C |
| Plot type | Count rate plots | Images |
|---|---|---|
| Comparison with Poisson distribution Blue bars denote a histogram of data divided into 1 sec bins. Red curve is a Poisson curve with rate = median count rate of data. |
 |
 |
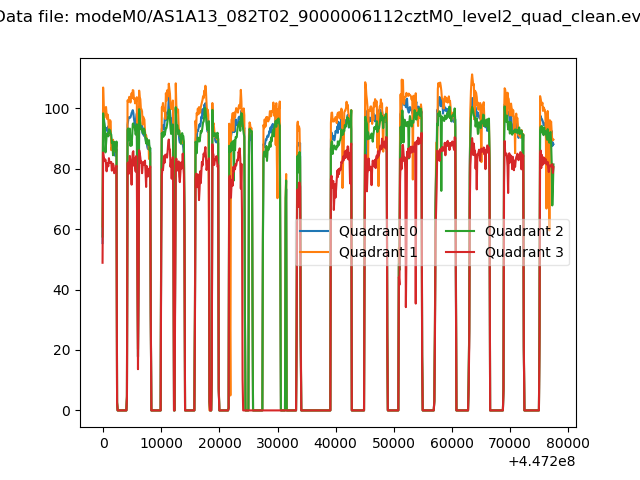
| Quadrant-wise count rates Data is divided into 100 sec bins |
 |
|
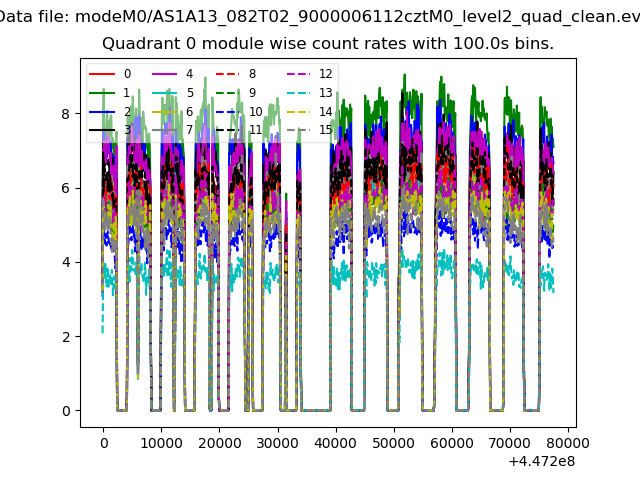
| Module-wise count rates for Quadrant A Data is divided into 100 sec bins |
 |
 |
| Module-wise count rates for Quadrant B Data is divided into 100 sec bins |
 |
 |
| Module-wise count rates for Quadrant C Data is divided into 100 sec bins |
 |
 |
| Module-wise count rates for Quadrant D Data is divided into 100 sec bins |
 |
 |
| Parameter | Plot |
|---|---|
| CZT HV Monitor |  |
| D_VDD |  |
| Temperature 1 |  |
| Veto HV Monitor |  |
| Veto LLD |  |
| Alpha Counter | 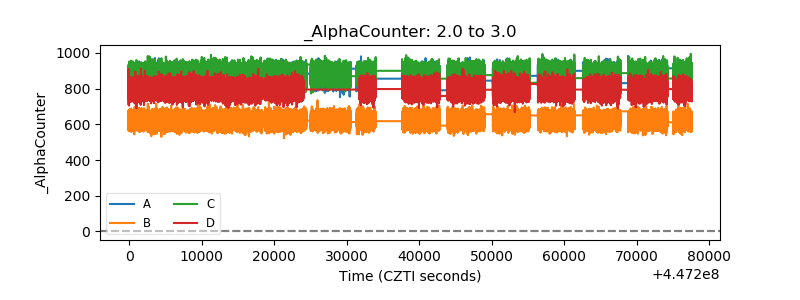 |
| _CPM_Rate | 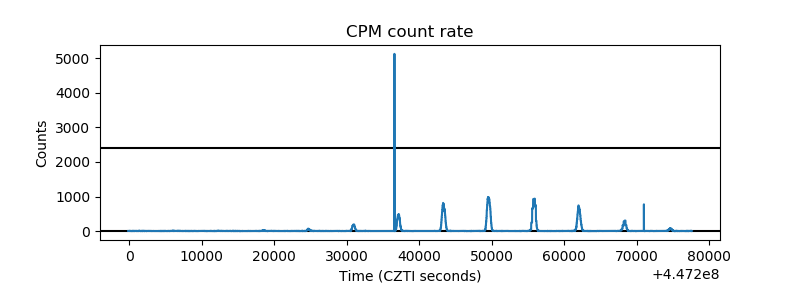 |
| CZT Counter |  |
| +2.5 Volts monitor |  |
| +5 Volts monitor |  |
| _ROLL_ROT |  |
| _Roll_DEC |  |
| _Roll_RA |  |
| Veto Counter |  |