| Param | Original file | Final file |
|---|---|---|
| Filename | modeM0/AS1A13_071T07_9000006116cztM0_level2.fits | modeM0/AS1A13_071T07_9000006116cztM0_level2_quad_clean.evt |
| Size (bytes) | 841,224,960 | 1,003,867,200 |
| Size | 802.3 MB | 957.4 MB |
| Events in quadrant A | 5,044,926 | 6,370,947 |
| Events in quadrant B | 4,805,982 | 6,308,058 |
| Events in quadrant C | 4,980,020 | 5,936,295 |
| Events in quadrant D | 4,166,512 | 5,318,439 |
| Mode M9 | |||
|---|---|---|---|
| Quadrant | BADHDUFLAG | Total packets | Discarded packets |
| A | 0 | 135 | 0 |
| B | 0 | 135 | 0 |
| C | 0 | 135 | 0 |
| D | 0 | 135 | 0 |
| Mode M0 | |||
|---|---|---|---|
| Quadrant | BADHDUFLAG | Total packets | Discarded packets |
| A | 0 | 304342 | 0 |
| B | 0 | 237306 | 0 |
| C | 0 | 243789 | 0 |
| D | 0 | 301162 | 0 |
| Mode SS | |||
|---|---|---|---|
| Quadrant | BADHDUFLAG | Total packets | Discarded packets |
| A | 0 | 1918 | 0 |
| B | 0 | 1918 | 0 |
| C | 0 | 1918 | 0 |
| D | 0 | 1918 | 0 |
| Quadrant | Total seconds | Saturated seconds | Saturation percentage |
|---|---|---|---|
| A | 94389 | 2746 | 2.909237% |
| B | 94390 | 5819 | 6.164848% |
| C | 94390 | 5212 | 5.521771% |
| D | 94390 | 8026 | 8.503019% |
Noise dominated data is calculated using 1-second bins in cleaned event files. If a bin has >2000 counts, and if more than 50% of those come from <1% of pixels, then it is considered to be noise-dominated and hence unusable.
| Quadrant | # 1 sec bins | Bins with >0 counts | Bins with >2000 counts | High rate bins dominated by noise | Noise dominated (total time) | Noise dominated (detector-on time) | Marked lightcurve |
|---|---|---|---|---|---|---|---|
| A | 107854 | 94381 | 0 | 0 | 0.00% | 0.00% |  |
| B | 107855 | 94300 | 0 | 0 | 0.00% | 0.00% |  |
| C | 107855 | 94376 | 0 | 0 | 0.00% | 0.00% |  |
| D | 107855 | 94186 | 0 | 0 | 0.00% | 0.00% |  |
Top three noisy pixels from each quadrant. If the there are fewer than three noisy pixels in the level2.evt file, extra rows are filled as -1
| Pixel properties | Quadrant properties | ||||||
|---|---|---|---|---|---|---|---|
| Quadrant | DetID | PixID | Counts | Sigma | Mean | Median | Sigma |
| A | 7 | 110 | 4063 | 8.5 | 1316 | 1237 | 332.4 |
| A | 0 | 29 | 3991 | 8.28 | 1316 | 1237 | 332.4 |
| A | 14 | 95 | 3883 | 7.96 | 1316 | 1237 | 332.4 |
| B | 2 | 9 | 4461 | 13.22 | 1273 | 1218 | 245.2 |
| B | 2 | 8 | 3648 | 9.91 | 1273 | 1218 | 245.2 |
| B | 3 | 17 | 3415 | 8.96 | 1273 | 1218 | 245.2 |
| C | 1 | 81 | 3857 | 7.71 | 1318 | 1232 | 340.3 |
| C | 3 | 202 | 3835 | 7.65 | 1318 | 1232 | 340.3 |
| C | 3 | 203 | 3697 | 7.24 | 1318 | 1232 | 340.3 |
| D | 10 | 189 | 3088 | 6.03 | 1198 | 1088 | 331.8 |
| D | 6 | 38 | 2996 | 5.75 | 1198 | 1088 | 331.8 |
| D | 4 | 12 | 2975 | 5.69 | 1198 | 1088 | 331.8 |
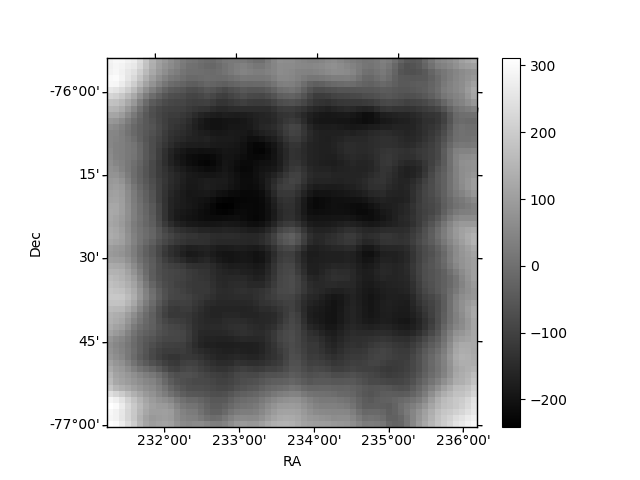
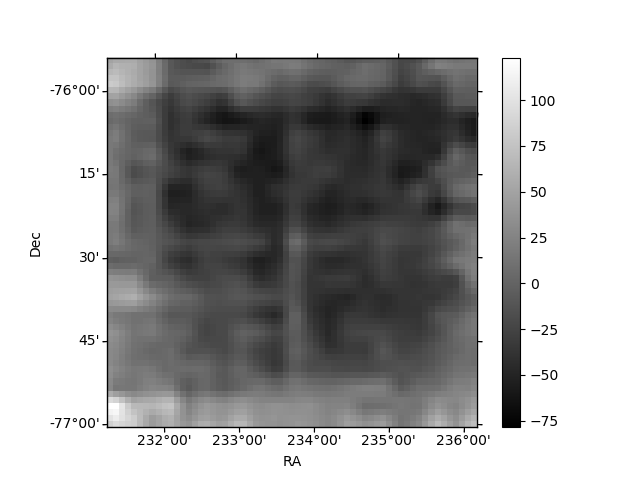
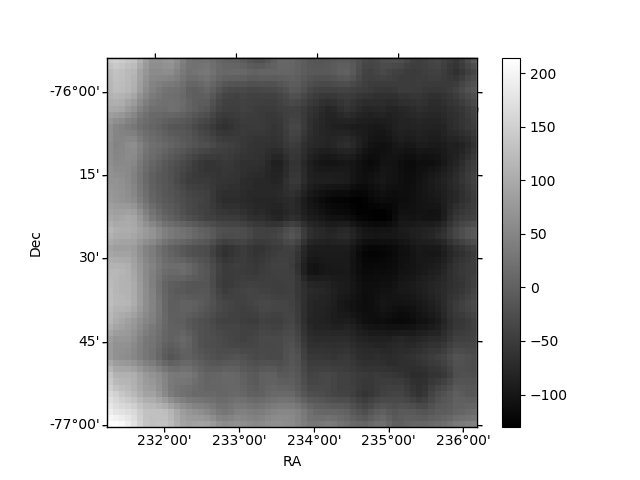
Histogram calculated using DETX and DETY for each event in the final _common_clean file
| Quadrant A | 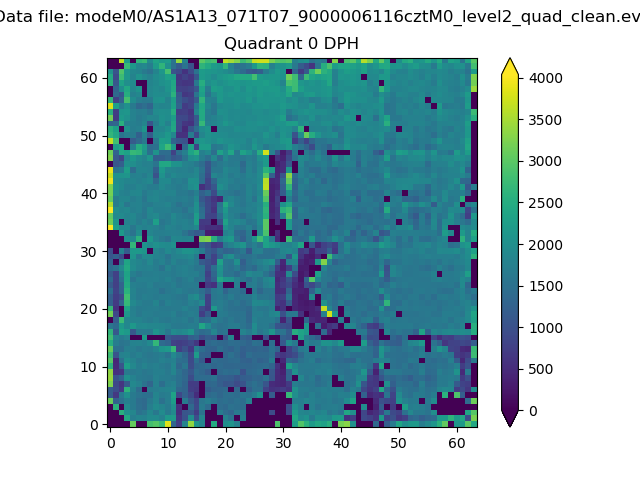 |
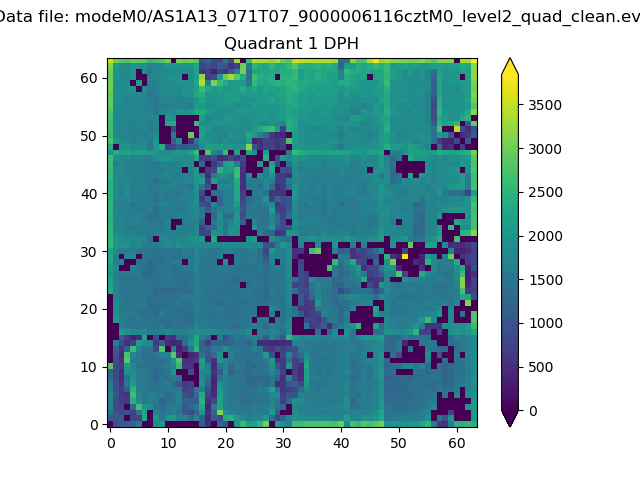 |
Quadrant B |
|---|---|---|---|
| Quadrant D | 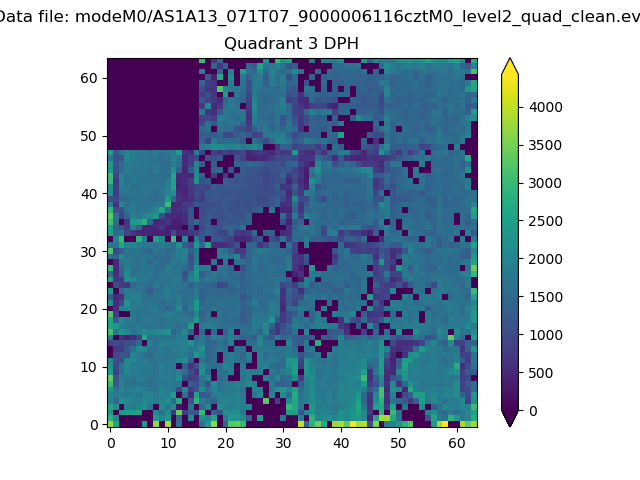 |
 |
Quadrant C |
| Plot type | Count rate plots | Images |
|---|---|---|
| Comparison with Poisson distribution Blue bars denote a histogram of data divided into 1 sec bins. Red curve is a Poisson curve with rate = median count rate of data. |
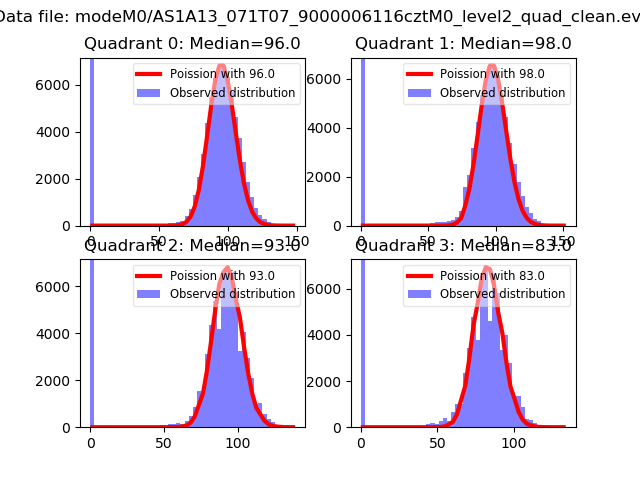 |
 |
| Quadrant-wise count rates Data is divided into 100 sec bins |
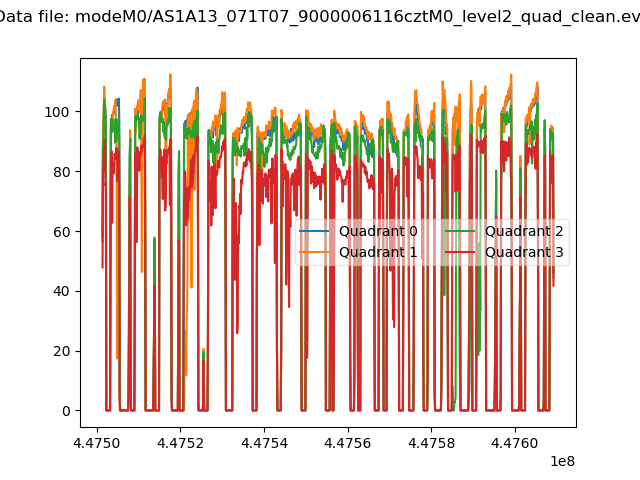 |
|
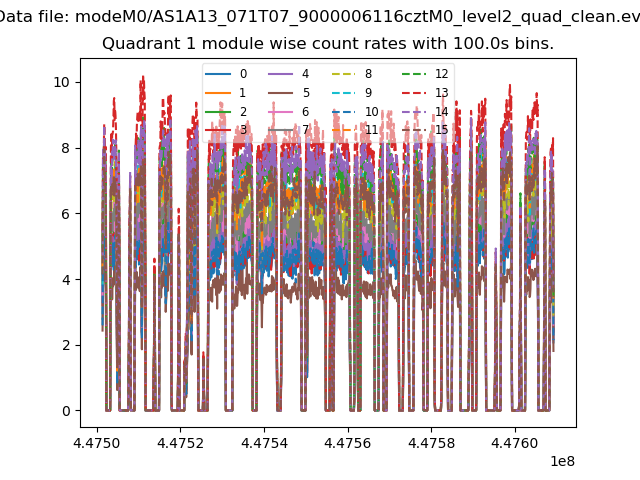
| Module-wise count rates for Quadrant A Data is divided into 100 sec bins |
 |
 |
| Module-wise count rates for Quadrant B Data is divided into 100 sec bins |
 |
 |
| Module-wise count rates for Quadrant C Data is divided into 100 sec bins |
 |
 |
| Module-wise count rates for Quadrant D Data is divided into 100 sec bins |
 |
 |
| Parameter | Plot |
|---|---|
| CZT HV Monitor | 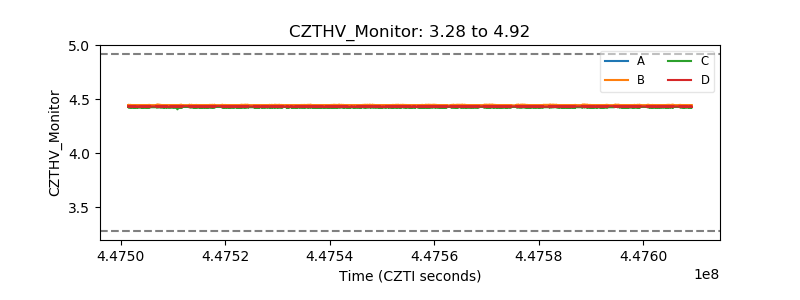 |
| D_VDD |  |
| Temperature 1 |  |
| Veto HV Monitor | 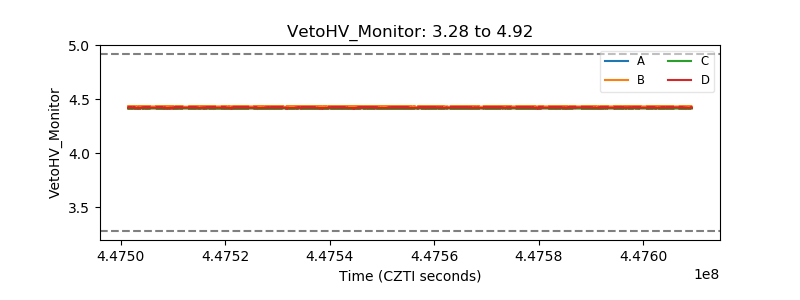 |
| Veto LLD |  |
| Alpha Counter |  |
| _CPM_Rate | 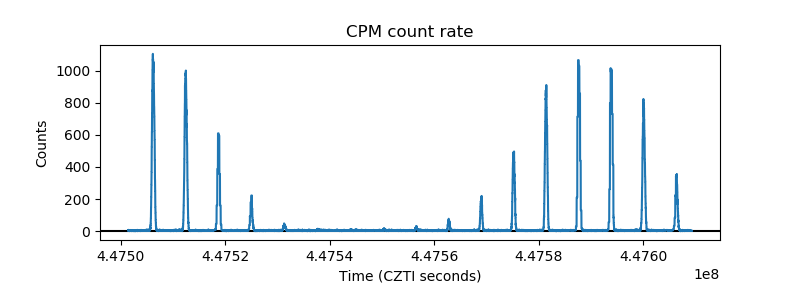 |
| CZT Counter |  |
| +2.5 Volts monitor |  |
| +5 Volts monitor |  |
| _ROLL_ROT | 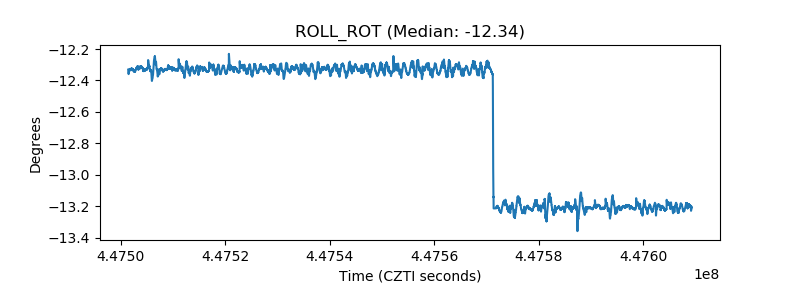 |
| _Roll_DEC |  |
| _Roll_RA | 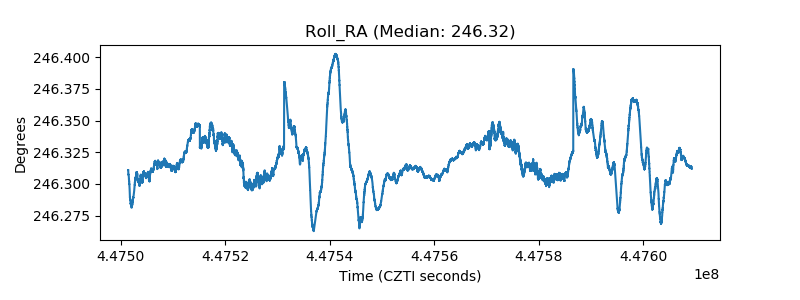 |
| Veto Counter |  |