| Param | Original file | Final file |
|---|---|---|
| Filename | modeM0/AS1A13_093T12_9000006118cztM0_level2.fits | modeM0/AS1A13_093T12_9000006118cztM0_level2_quad_clean.evt |
| Size (bytes) | 589,991,040 | 695,424,960 |
| Size | 562.7 MB | 663.2 MB |
| Events in quadrant A | 3,457,696 | 4,233,832 |
| Events in quadrant B | 3,354,582 | 4,299,119 |
| Events in quadrant C | 3,512,250 | 4,204,257 |
| Events in quadrant D | 2,985,088 | 3,768,821 |
| Mode M0 | |||
|---|---|---|---|
| Quadrant | BADHDUFLAG | Total packets | Discarded packets |
| A | 0 | 212541 | 0 |
| B | 0 | 150733 | 0 |
| C | 0 | 145465 | 0 |
| D | 0 | 165029 | 0 |
| Mode SS | |||
|---|---|---|---|
| Quadrant | BADHDUFLAG | Total packets | Discarded packets |
| A | 0 | 1350 | 0 |
| B | 0 | 1350 | 0 |
| C | 0 | 1350 | 0 |
| D | 0 | 1350 | 0 |
| Mode M9 | |||
|---|---|---|---|
| Quadrant | BADHDUFLAG | Total packets | Discarded packets |
| A | 0 | 81 | 0 |
| B | 0 | 81 | 0 |
| C | 0 | 81 | 0 |
| D | 0 | 81 | 0 |
| Quadrant | Total seconds | Saturated seconds | Saturation percentage |
|---|---|---|---|
| A | 66446 | 1516 | 2.281552% |
| B | 66446 | 1649 | 2.481714% |
| C | 66446 | 922 | 1.387593% |
| D | 66446 | 2057 | 3.095747% |
Noise dominated data is calculated using 1-second bins in cleaned event files. If a bin has >2000 counts, and if more than 50% of those come from <1% of pixels, then it is considered to be noise-dominated and hence unusable.
| Quadrant | # 1 sec bins | Bins with >0 counts | Bins with >2000 counts | High rate bins dominated by noise | Noise dominated (total time) | Noise dominated (detector-on time) | Marked lightcurve |
|---|---|---|---|---|---|---|---|
| A | 74427 | 66439 | 0 | 0 | 0.00% | 0.00% | 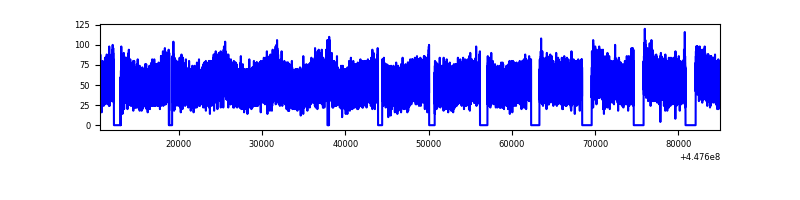 |
| B | 74427 | 66424 | 0 | 0 | 0.00% | 0.00% |  |
| C | 74427 | 66434 | 0 | 0 | 0.00% | 0.00% |  |
| D | 74427 | 66430 | 0 | 0 | 0.00% | 0.00% |  |
Top three noisy pixels from each quadrant. If the there are fewer than three noisy pixels in the level2.evt file, extra rows are filled as -1
| Pixel properties | Quadrant properties | ||||||
|---|---|---|---|---|---|---|---|
| Quadrant | DetID | PixID | Counts | Sigma | Mean | Median | Sigma |
| A | 7 | 110 | 2844 | 8.71 | 903 | 844 | 229.5 |
| A | 0 | 29 | 2607 | 7.68 | 903 | 844 | 229.5 |
| A | 15 | 236 | 2584 | 7.58 | 903 | 844 | 229.5 |
| B | 2 | 9 | 3119 | 13.03 | 890 | 847 | 174.4 |
| B | 2 | 8 | 2472 | 9.32 | 890 | 847 | 174.4 |
| B | 3 | 17 | 2419 | 9.01 | 890 | 847 | 174.4 |
| C | 3 | 202 | 2730 | 7.84 | 927 | 865 | 237.9 |
| C | 1 | 81 | 2711 | 7.76 | 927 | 865 | 237.9 |
| C | 1 | 80 | 2599 | 7.29 | 927 | 865 | 237.9 |
| D | 10 | 189 | 2294 | 6.36 | 858 | 778 | 238.3 |
| D | 12 | 6 | 2155 | 5.78 | 858 | 778 | 238.3 |
| D | 1 | 31 | 2120 | 5.63 | 858 | 778 | 238.3 |
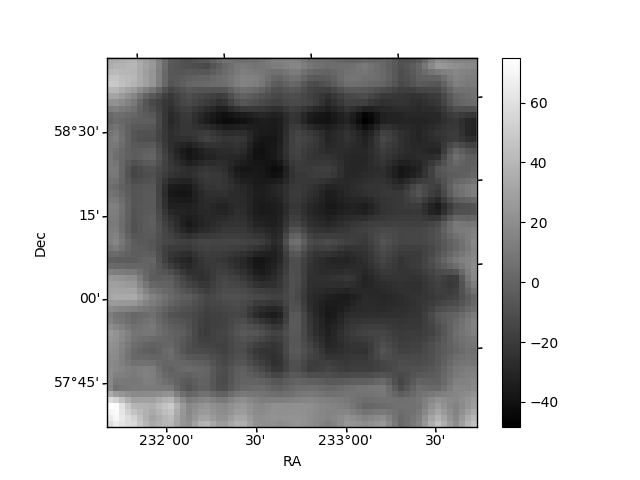
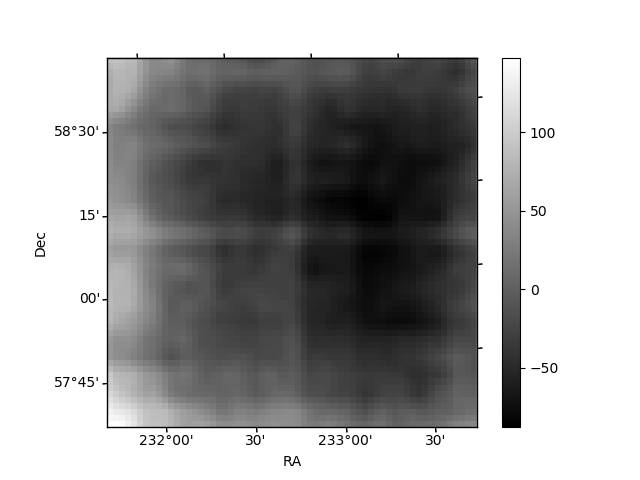
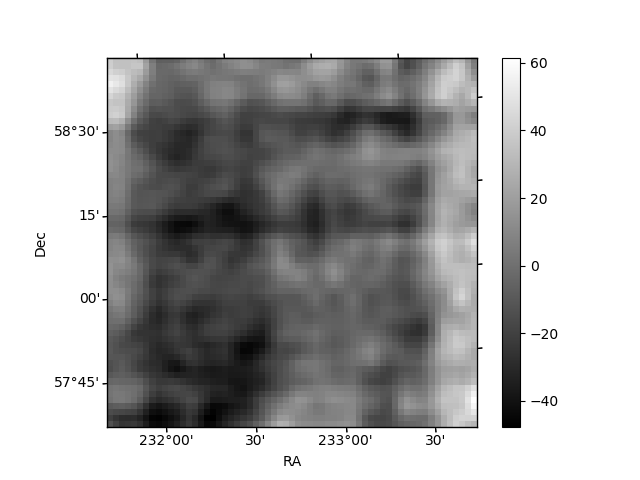
Histogram calculated using DETX and DETY for each event in the final _common_clean file
| Quadrant A |  |
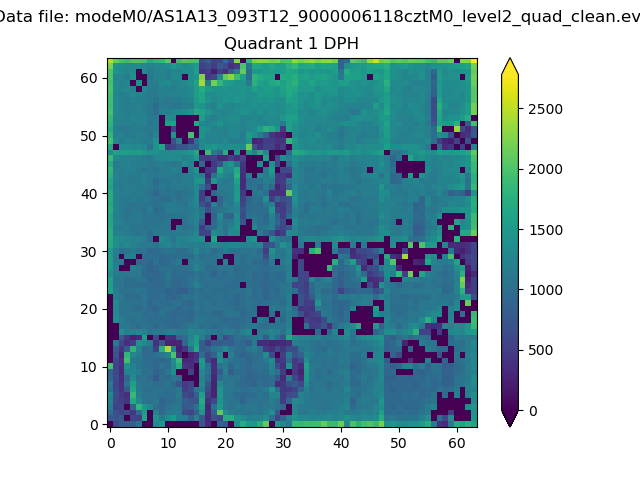 |
Quadrant B |
|---|---|---|---|
| Quadrant D |  |
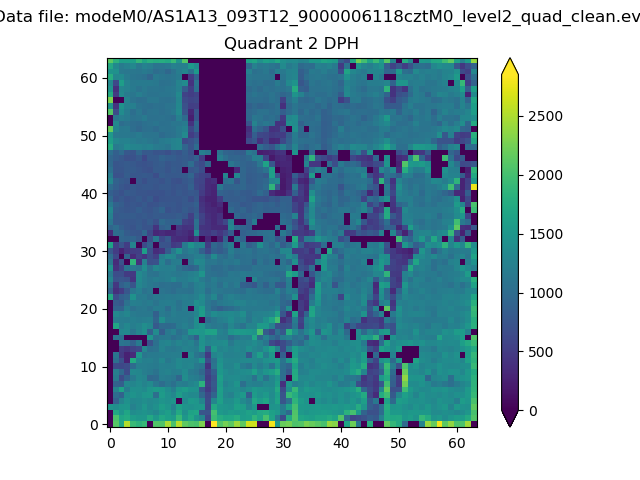 |
Quadrant C |
| Plot type | Count rate plots | Images |
|---|---|---|
| Comparison with Poisson distribution Blue bars denote a histogram of data divided into 1 sec bins. Red curve is a Poisson curve with rate = median count rate of data. |
 |
 |
| Quadrant-wise count rates Data is divided into 100 sec bins |
 |
|
| Module-wise count rates for Quadrant A Data is divided into 100 sec bins |
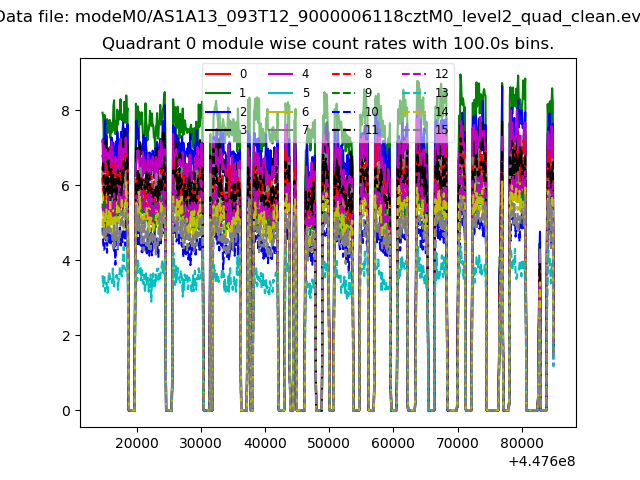 |
 |
| Module-wise count rates for Quadrant B Data is divided into 100 sec bins |
 |
 |
| Module-wise count rates for Quadrant C Data is divided into 100 sec bins |
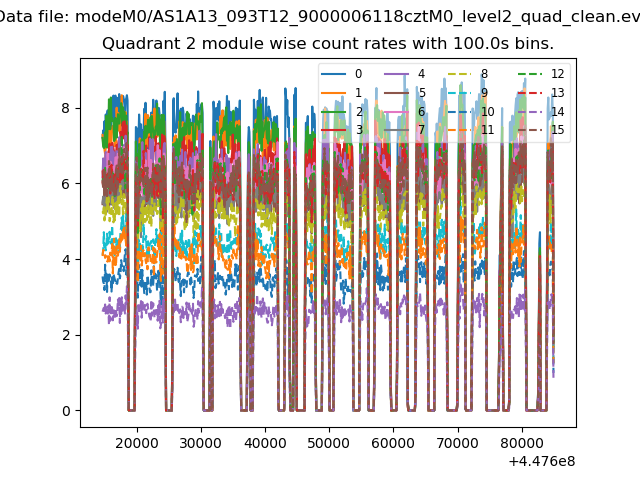 |
 |
| Module-wise count rates for Quadrant D Data is divided into 100 sec bins |
 |
 |
| Parameter | Plot |
|---|---|
| CZT HV Monitor |  |
| D_VDD | 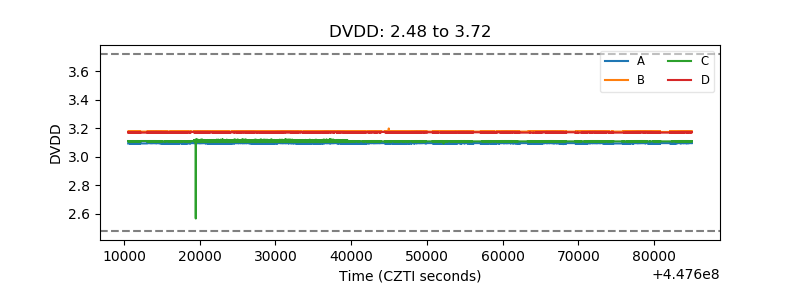 |
| Temperature 1 |  |
| Veto HV Monitor |  |
| Veto LLD | 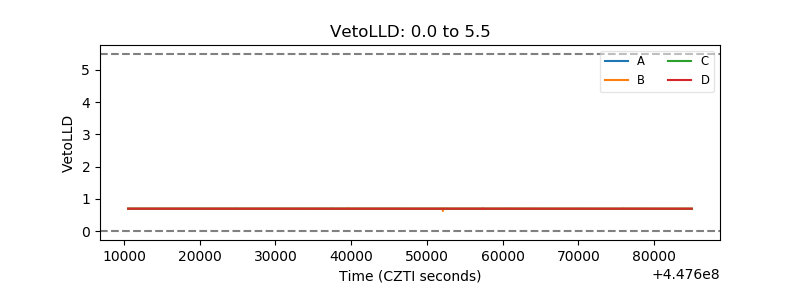 |
| Alpha Counter |  |
| _CPM_Rate |  |
| CZT Counter |  |
| +2.5 Volts monitor | 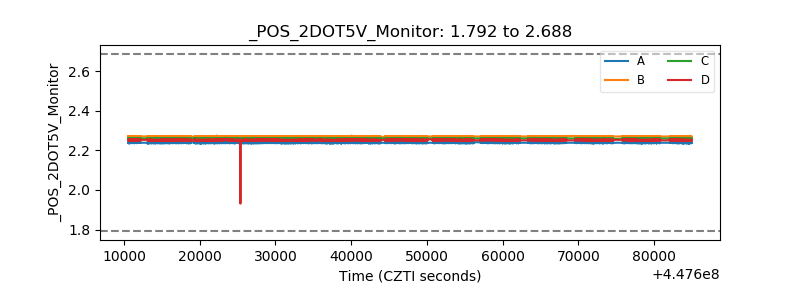 |
| +5 Volts monitor |  |
| _ROLL_ROT |  |
| _Roll_DEC |  |
| _Roll_RA | 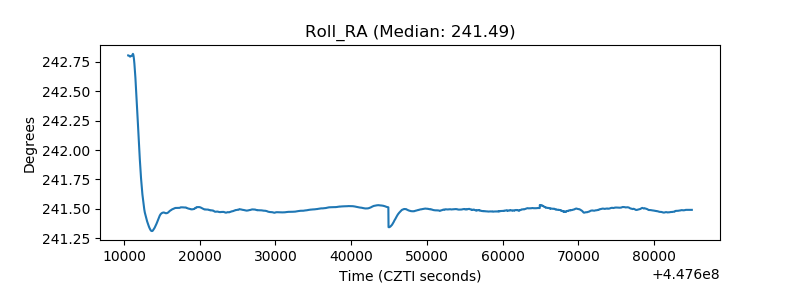 |
| Veto Counter |  |