| Param | Original file | Final file |
|---|---|---|
| Filename | modeM0/AS1T05_183T01_9000006124cztM0_level2.fits | modeM0/AS1T05_183T01_9000006124cztM0_level2_quad_clean.evt |
| Size (bytes) | 2,781,872,640 | 2,896,352,640 |
| Size | 2.6 GB | 2.7 GB |
| Events in quadrant A | 16,586,898 | 17,548,789 |
| Events in quadrant B | 15,444,230 | 16,545,529 |
| Events in quadrant C | 16,930,272 | 17,753,357 |
| Events in quadrant D | 13,838,270 | 14,456,676 |
| Mode SS | |||
|---|---|---|---|
| Quadrant | BADHDUFLAG | Total packets | Discarded packets |
| A | 0 | 6348 | 0 |
| B | 0 | 6348 | 0 |
| C | 0 | 6348 | 0 |
| D | 0 | 6348 | 0 |
| Mode M0 | |||
|---|---|---|---|
| Quadrant | BADHDUFLAG | Total packets | Discarded packets |
| A | 0 | 1063565 | 0 |
| B | 0 | 1080382 | 0 |
| C | 0 | 708961 | 0 |
| D | 0 | 1051366 | 0 |
| Mode M9 | |||
|---|---|---|---|
| Quadrant | BADHDUFLAG | Total packets | Discarded packets |
| A | 0 | 377 | 0 |
| B | 0 | 377 | 0 |
| C | 0 | 377 | 0 |
| D | 0 | 377 | 0 |
| Quadrant | Total seconds | Saturated seconds | Saturation percentage |
|---|---|---|---|
| A | 312626 | 11781 | 3.768401% |
| B | 312629 | 36585 | 11.702369% |
| C | 312630 | 7094 | 2.269136% |
| D | 312630 | 34132 | 10.917698% |
Noise dominated data is calculated using 1-second bins in cleaned event files. If a bin has >2000 counts, and if more than 50% of those come from <1% of pixels, then it is considered to be noise-dominated and hence unusable.
| Quadrant | # 1 sec bins | Bins with >0 counts | Bins with >2000 counts | High rate bins dominated by noise | Noise dominated (total time) | Noise dominated (detector-on time) | Marked lightcurve |
|---|---|---|---|---|---|---|---|
| A | 359840 | 312617 | 0 | 0 | 0.00% | 0.00% |  |
| B | 359840 | 312383 | 0 | 0 | 0.00% | 0.00% |  |
| C | 359841 | 312535 | 0 | 0 | 0.00% | 0.00% |  |
| D | 359840 | 312302 | 0 | 0 | 0.00% | 0.00% |  |
Top three noisy pixels from each quadrant. If the there are fewer than three noisy pixels in the level2.evt file, extra rows are filled as -1
| Pixel properties | Quadrant properties | ||||||
|---|---|---|---|---|---|---|---|
| Quadrant | DetID | PixID | Counts | Sigma | Mean | Median | Sigma |
| A | 7 | 110 | 13302 | 8.6 | 4328 | 4037 | 1077.4 |
| A | 15 | 236 | 13182 | 8.49 | 4328 | 4037 | 1077.4 |
| A | 0 | 29 | 12983 | 8.3 | 4328 | 4037 | 1077.4 |
| B | 2 | 9 | 14161 | 12.74 | 4096 | 3885 | 806.4 |
| B | 2 | 8 | 11281 | 9.17 | 4096 | 3885 | 806.4 |
| B | 3 | 17 | 11206 | 9.08 | 4096 | 3885 | 806.4 |
| C | 1 | 81 | 13348 | 7.98 | 4478 | 4160 | 1151.1 |
| C | 3 | 202 | 13123 | 7.79 | 4478 | 4160 | 1151.1 |
| C | 1 | 80 | 12953 | 7.64 | 4478 | 4160 | 1151.1 |
| D | 10 | 189 | 10369 | 6.2 | 3988 | 3634 | 1085.6 |
| D | 7 | 3 | 9816 | 5.69 | 3988 | 3634 | 1085.6 |
| D | 15 | 47 | 9808 | 5.69 | 3988 | 3634 | 1085.6 |
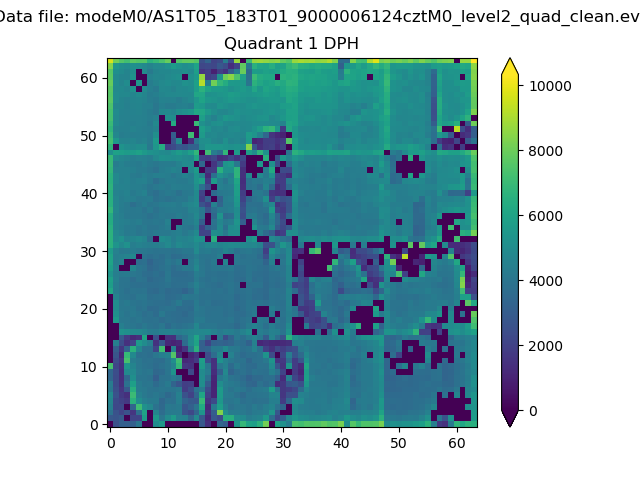
Histogram calculated using DETX and DETY for each event in the final _common_clean file
| Quadrant A |  |
 |
Quadrant B |
|---|---|---|---|
| Quadrant D | 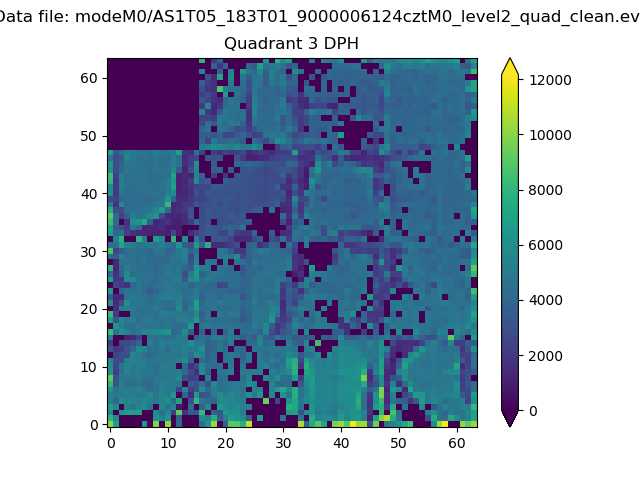 |
 |
Quadrant C |
| Plot type | Count rate plots | Images |
|---|---|---|
| Comparison with Poisson distribution Blue bars denote a histogram of data divided into 1 sec bins. Red curve is a Poisson curve with rate = median count rate of data. |
 |
 |
| Quadrant-wise count rates Data is divided into 100 sec bins |
 |
|
| Module-wise count rates for Quadrant A Data is divided into 100 sec bins |
 |
 |
| Module-wise count rates for Quadrant B Data is divided into 100 sec bins |
 |
 |
| Module-wise count rates for Quadrant C Data is divided into 100 sec bins |
 |
 |
| Module-wise count rates for Quadrant D Data is divided into 100 sec bins |
 |
 |
| Parameter | Plot |
|---|---|
| CZT HV Monitor |  |
| D_VDD |  |
| Temperature 1 |  |
| Veto HV Monitor |  |
| Veto LLD |  |
| Alpha Counter |  |
| _CPM_Rate | 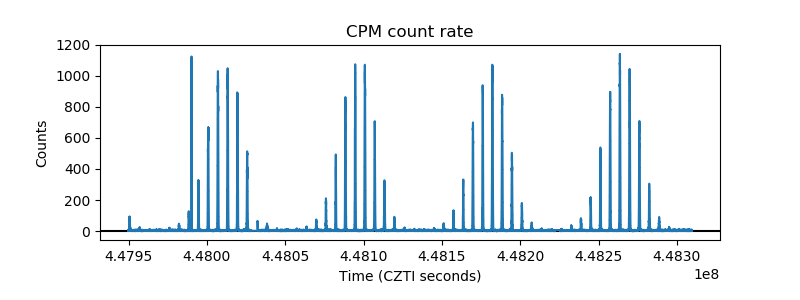 |
| CZT Counter |  |
| +2.5 Volts monitor |  |
| +5 Volts monitor |  |
| _ROLL_ROT |  |
| _Roll_DEC |  |
| _Roll_RA |  |
| Veto Counter |  |