| Param | Original file | Final file |
|---|---|---|
| Filename | modeM0/AS1A13_034T01_9000006134cztM0_level2.fits | modeM0/AS1A13_034T01_9000006134cztM0_level2_quad_clean.evt |
| Size (bytes) | 459,889,920 | 476,948,160 |
| Size | 438.6 MB | 454.9 MB |
| Events in quadrant A | 2,756,518 | 2,995,872 |
| Events in quadrant B | 2,222,188 | 2,276,408 |
| Events in quadrant C | 2,864,056 | 2,937,242 |
| Events in quadrant D | 2,395,514 | 2,557,073 |
| Mode SS | |||
|---|---|---|---|
| Quadrant | BADHDUFLAG | Total packets | Discarded packets |
| A | 0 | 1086 | 0 |
| B | 0 | 1086 | 0 |
| C | 0 | 1086 | 0 |
| D | 0 | 1086 | 0 |
| Mode M0 | |||
|---|---|---|---|
| Quadrant | BADHDUFLAG | Total packets | Discarded packets |
| A | 0 | 176937 | 0 |
| B | 0 | 281770 | 0 |
| C | 0 | 110927 | 0 |
| D | 0 | 142570 | 0 |
| Mode M9 | |||
|---|---|---|---|
| Quadrant | BADHDUFLAG | Total packets | Discarded packets |
| A | 0 | 55 | 0 |
| B | 0 | 56 | 0 |
| C | 0 | 56 | 0 |
| D | 0 | 56 | 0 |
| Quadrant | Total seconds | Saturated seconds | Saturation percentage |
|---|---|---|---|
| A | 53585 | 1926 | 3.594289% |
| B | 53585 | 22394 | 41.791546% |
| C | 53585 | 492 | 0.918167% |
| D | 53585 | 2914 | 5.438089% |
Noise dominated data is calculated using 1-second bins in cleaned event files. If a bin has >2000 counts, and if more than 50% of those come from <1% of pixels, then it is considered to be noise-dominated and hence unusable.
| Quadrant | # 1 sec bins | Bins with >0 counts | Bins with >2000 counts | High rate bins dominated by noise | Noise dominated (total time) | Noise dominated (detector-on time) | Marked lightcurve |
|---|---|---|---|---|---|---|---|
| A | 58659 | 53586 | 0 | 0 | 0.00% | 0.00% | 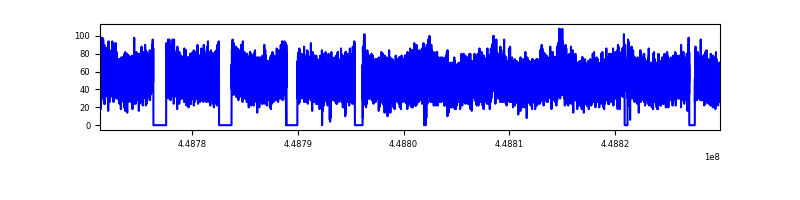 |
| B | 58659 | 53503 | 0 | 0 | 0.00% | 0.00% | 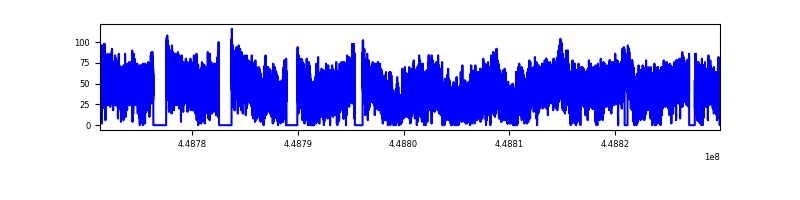 |
| C | 58659 | 53583 | 0 | 0 | 0.00% | 0.00% | 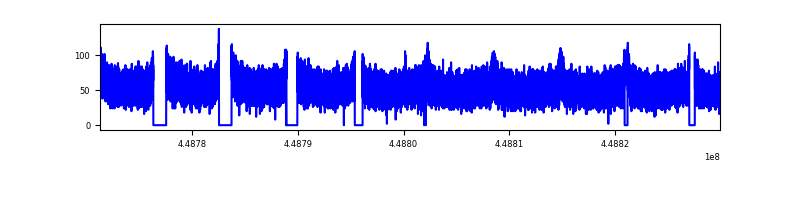 |
| D | 58659 | 53542 | 0 | 0 | 0.00% | 0.00% | 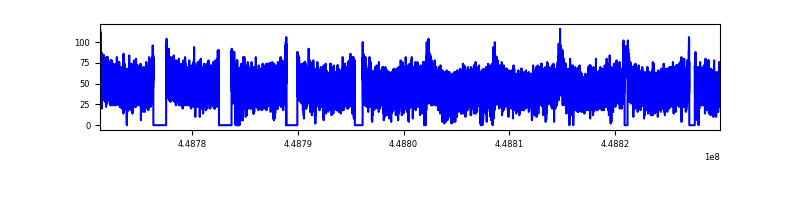 |
Top three noisy pixels from each quadrant. If the there are fewer than three noisy pixels in the level2.evt file, extra rows are filled as -1
| Pixel properties | Quadrant properties | ||||||
|---|---|---|---|---|---|---|---|
| Quadrant | DetID | PixID | Counts | Sigma | Mean | Median | Sigma |
| A | 7 | 110 | 2244 | 8.65 | 719 | 672 | 181.8 |
| A | 15 | 236 | 2194 | 8.37 | 719 | 672 | 181.8 |
| A | 0 | 29 | 2146 | 8.11 | 719 | 672 | 181.8 |
| B | 2 | 9 | 2049 | 12.85 | 587 | 557 | 116.1 |
| B | 2 | 8 | 1712 | 9.95 | 587 | 557 | 116.1 |
| B | 3 | 17 | 1593 | 8.92 | 587 | 557 | 116.1 |
| C | 3 | 202 | 2248 | 7.93 | 755 | 700 | 195.3 |
| C | 1 | 81 | 2223 | 7.8 | 755 | 700 | 195.3 |
| C | 3 | 203 | 2179 | 7.57 | 755 | 700 | 195.3 |
| D | 8 | 176 | 2038 | 7.41 | 688 | 624 | 190.9 |
| D | 12 | 6 | 1732 | 5.8 | 688 | 624 | 190.9 |
| D | 10 | 189 | 1728 | 5.78 | 688 | 624 | 190.9 |
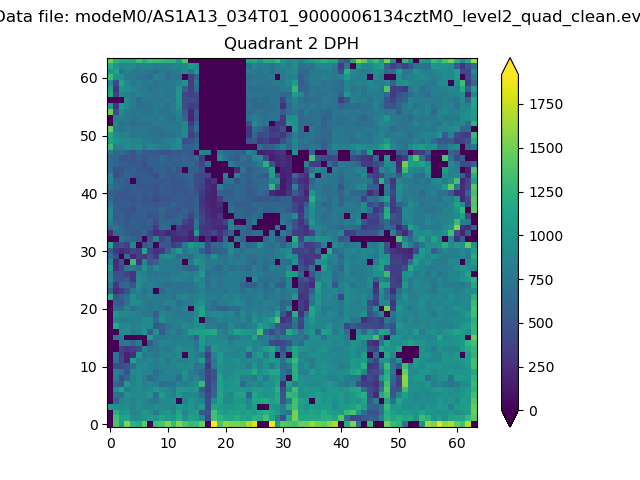
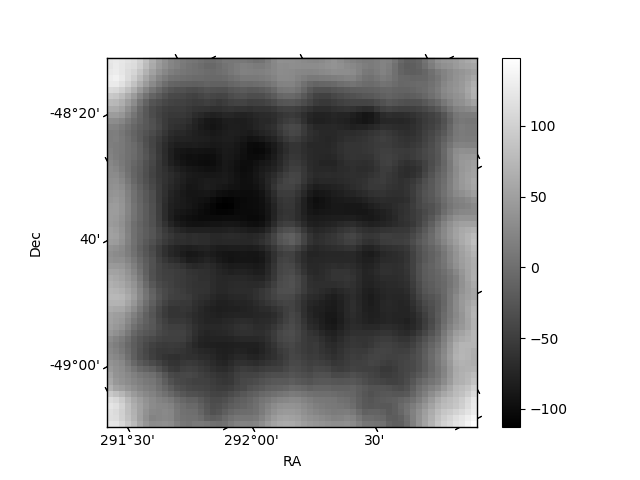
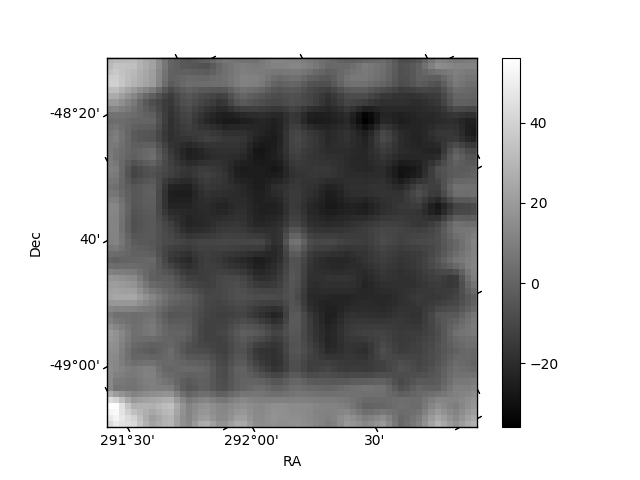
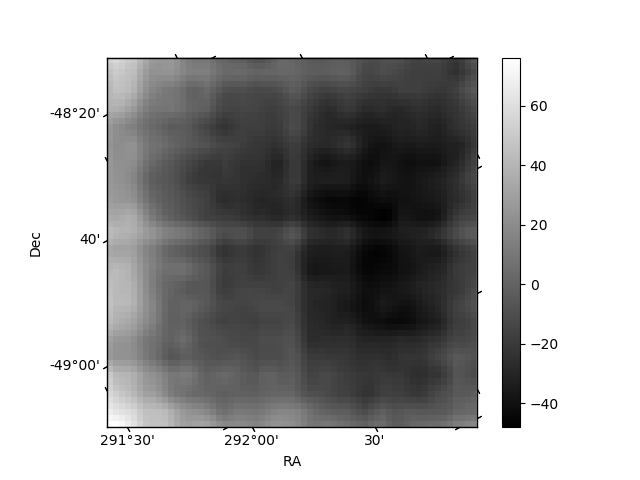
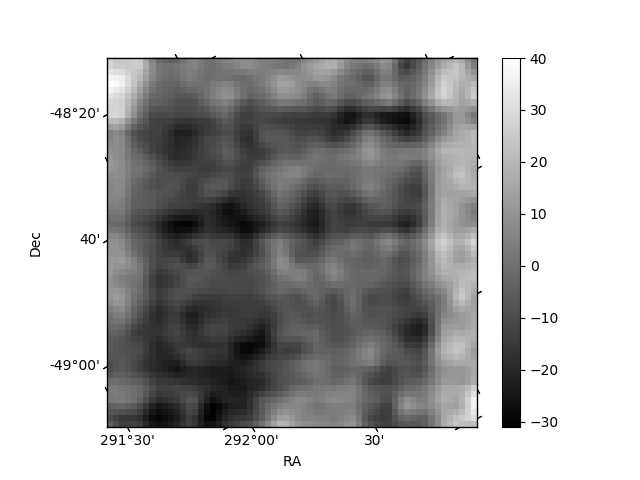
Histogram calculated using DETX and DETY for each event in the final _common_clean file
| Quadrant A | 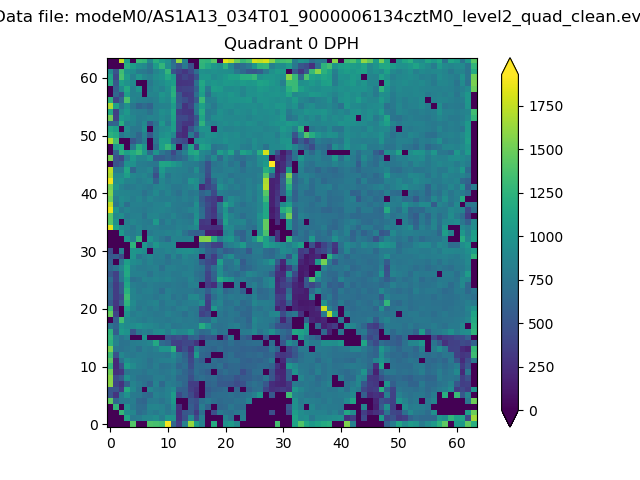 |
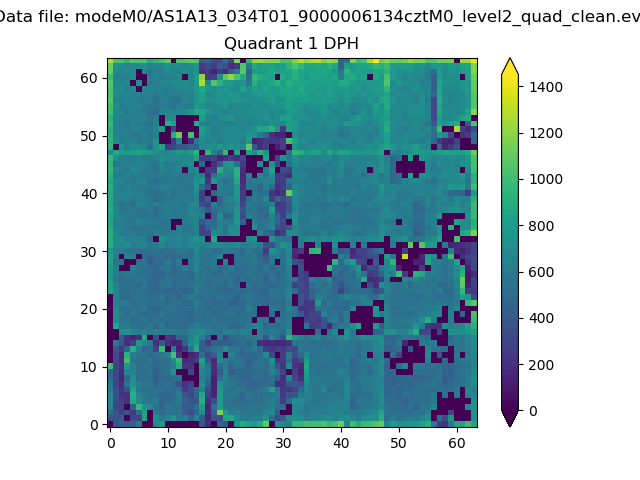 |
Quadrant B |
|---|---|---|---|
| Quadrant D | 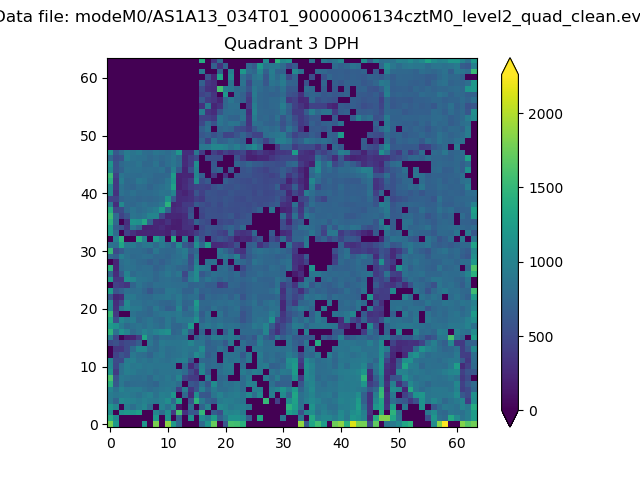 |
 |
Quadrant C |
| Plot type | Count rate plots | Images |
|---|---|---|
| Comparison with Poisson distribution Blue bars denote a histogram of data divided into 1 sec bins. Red curve is a Poisson curve with rate = median count rate of data. |
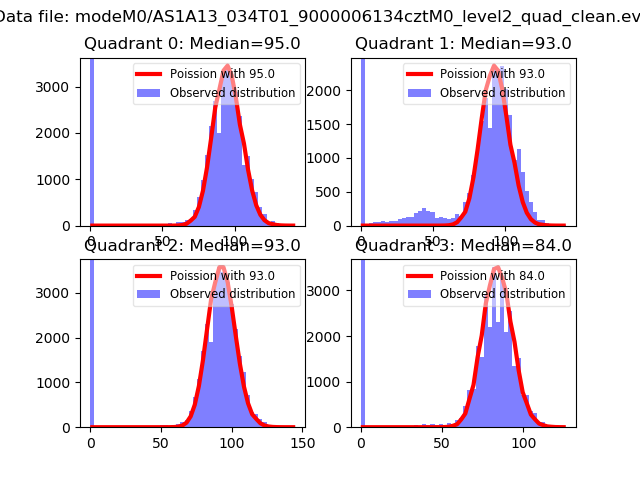 |
 |
| Quadrant-wise count rates Data is divided into 100 sec bins |
 |
|
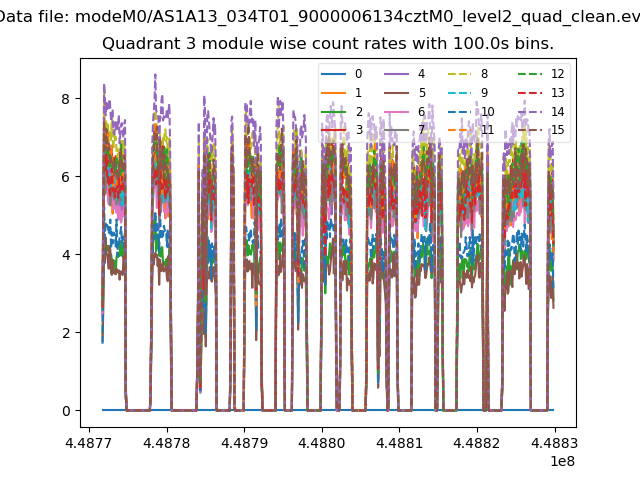
| Module-wise count rates for Quadrant A Data is divided into 100 sec bins |
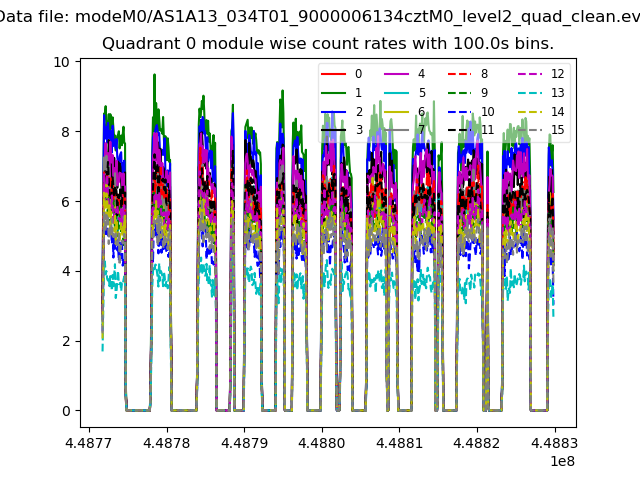 |
 |
| Module-wise count rates for Quadrant B Data is divided into 100 sec bins |
 |
 |
| Module-wise count rates for Quadrant C Data is divided into 100 sec bins |
 |
 |
| Module-wise count rates for Quadrant D Data is divided into 100 sec bins |
 |
 |
| Parameter | Plot |
|---|---|
| CZT HV Monitor | 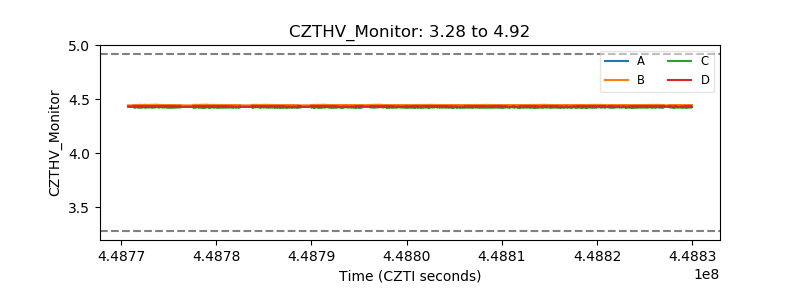 |
| D_VDD | 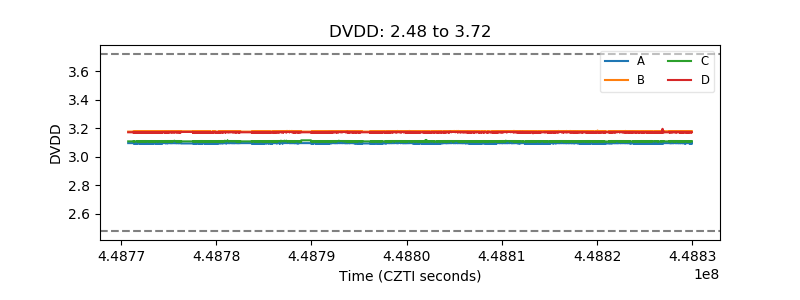 |
| Temperature 1 |  |
| Veto HV Monitor | 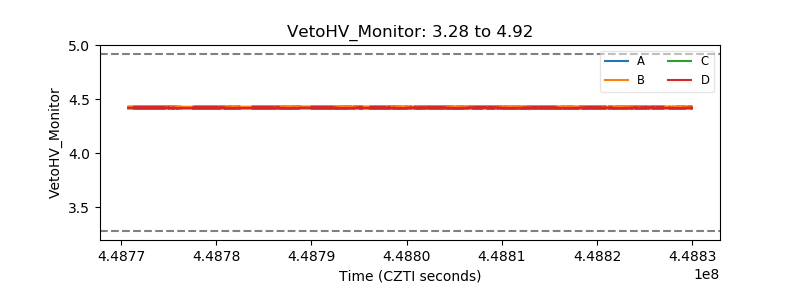 |
| Veto LLD |  |
| Alpha Counter |  |
| _CPM_Rate | 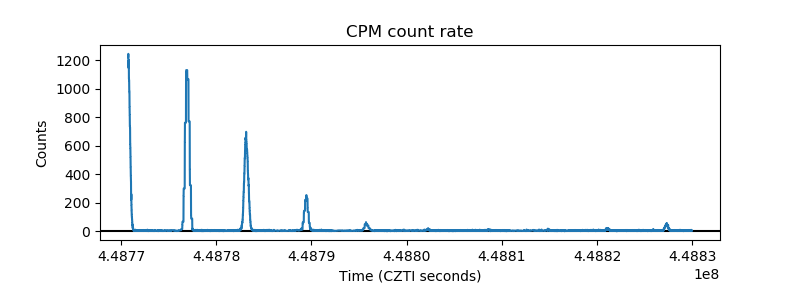 |
| CZT Counter | 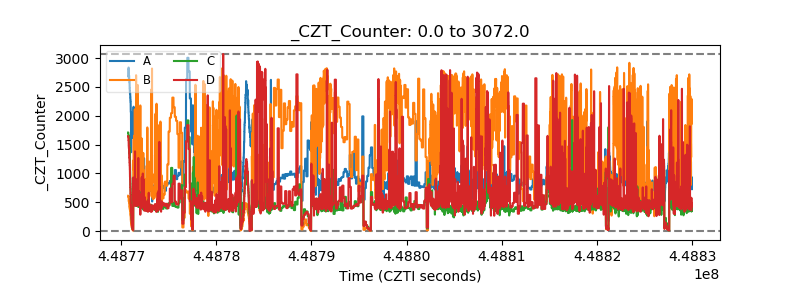 |
| +2.5 Volts monitor |  |
| +5 Volts monitor | 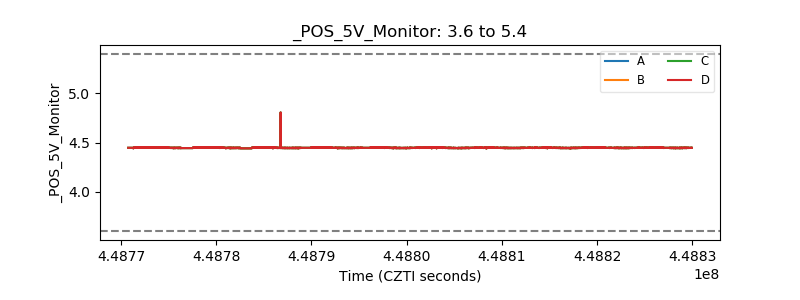 |
| _ROLL_ROT | 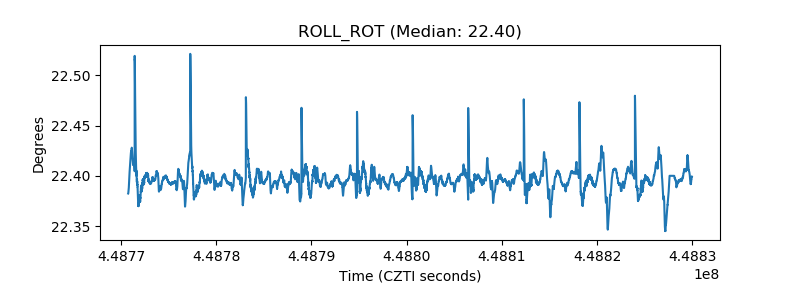 |
| _Roll_DEC |  |
| _Roll_RA | 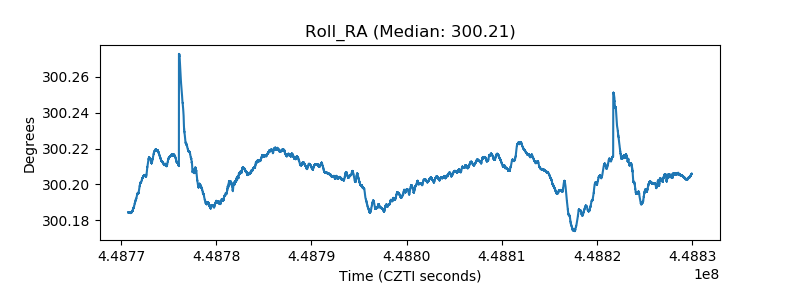 |
| Veto Counter | 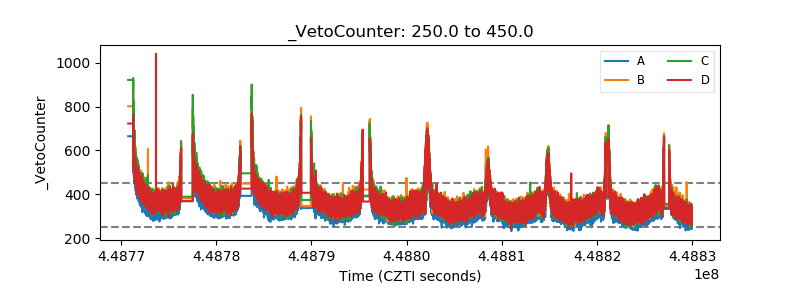 |