| Param | Original file | Final file |
|---|---|---|
| Filename | modeM0/AS1T05_188T01_9000006138cztM0_level2.fits | modeM0/AS1T05_188T01_9000006138cztM0_level2_quad_clean.evt |
| Size (bytes) | 356,552,640 | 382,622,400 |
| Size | 340.0 MB | 364.9 MB |
| Events in quadrant A | 2,110,176 | 2,332,380 |
| Events in quadrant B | 1,893,468 | 2,190,360 |
| Events in quadrant C | 2,162,604 | 2,269,287 |
| Events in quadrant D | 1,775,456 | 1,943,998 |
| Mode SS | |||
|---|---|---|---|
| Quadrant | BADHDUFLAG | Total packets | Discarded packets |
| A | 0 | 844 | 0 |
| B | 0 | 844 | 0 |
| C | 0 | 844 | 0 |
| D | 0 | 844 | 0 |
| Mode M0 | |||
|---|---|---|---|
| Quadrant | BADHDUFLAG | Total packets | Discarded packets |
| A | 0 | 133184 | 0 |
| B | 0 | 160726 | 0 |
| C | 0 | 86083 | 0 |
| D | 0 | 124436 | 0 |
| Mode M9 | |||
|---|---|---|---|
| Quadrant | BADHDUFLAG | Total packets | Discarded packets |
| A | 0 | 39 | 0 |
| B | 0 | 39 | 0 |
| C | 0 | 39 | 0 |
| D | 0 | 39 | 0 |
| Quadrant | Total seconds | Saturated seconds | Saturation percentage |
|---|---|---|---|
| A | 41523 | 1136 | 2.735833% |
| B | 41523 | 7671 | 18.474099% |
| C | 41523 | 245 | 0.590034% |
| D | 41523 | 3289 | 7.920911% |
Noise dominated data is calculated using 1-second bins in cleaned event files. If a bin has >2000 counts, and if more than 50% of those come from <1% of pixels, then it is considered to be noise-dominated and hence unusable.
| Quadrant | # 1 sec bins | Bins with >0 counts | Bins with >2000 counts | High rate bins dominated by noise | Noise dominated (total time) | Noise dominated (detector-on time) | Marked lightcurve |
|---|---|---|---|---|---|---|---|
| A | 45468 | 41522 | 0 | 0 | 0.00% | 0.00% |  |
| B | 45468 | 41453 | 0 | 0 | 0.00% | 0.00% |  |
| C | 45468 | 41523 | 0 | 0 | 0.00% | 0.00% |  |
| D | 45468 | 41456 | 0 | 0 | 0.00% | 0.00% |  |
Top three noisy pixels from each quadrant. If the there are fewer than three noisy pixels in the level2.evt file, extra rows are filled as -1
| Pixel properties | Quadrant properties | ||||||
|---|---|---|---|---|---|---|---|
| Quadrant | DetID | PixID | Counts | Sigma | Mean | Median | Sigma |
| A | 7 | 110 | 1655 | 8.1 | 548 | 513 | 141.0 |
| A | 15 | 236 | 1648 | 8.05 | 548 | 513 | 141.0 |
| A | 0 | 29 | 1629 | 7.91 | 548 | 513 | 141.0 |
| B | 2 | 9 | 1748 | 12.6 | 498 | 472 | 101.3 |
| B | 2 | 8 | 1365 | 8.82 | 498 | 472 | 101.3 |
| B | 3 | 17 | 1315 | 8.32 | 498 | 472 | 101.3 |
| C | 1 | 81 | 1665 | 7.54 | 571 | 529 | 150.6 |
| C | 3 | 202 | 1626 | 7.28 | 571 | 529 | 150.6 |
| C | 1 | 80 | 1594 | 7.07 | 571 | 529 | 150.6 |
| D | 8 | 176 | 1437 | 6.83 | 509 | 460 | 143.1 |
| D | 10 | 189 | 1308 | 5.93 | 509 | 460 | 143.1 |
| D | 4 | 16 | 1271 | 5.67 | 509 | 460 | 143.1 |
Histogram calculated using DETX and DETY for each event in the final _common_clean file
| Quadrant A | 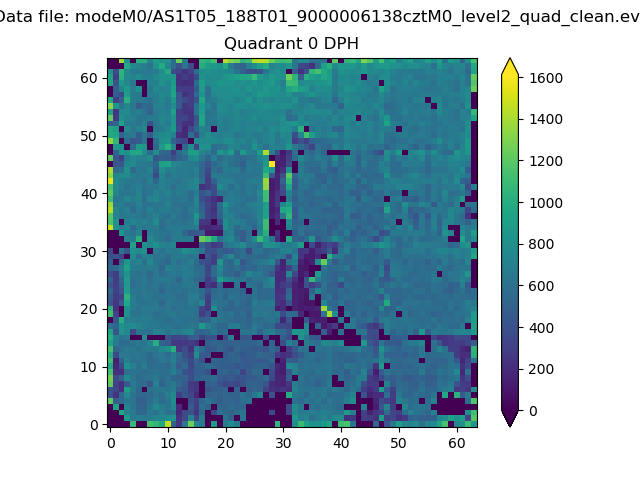 |
 |
Quadrant B |
|---|---|---|---|
| Quadrant D | 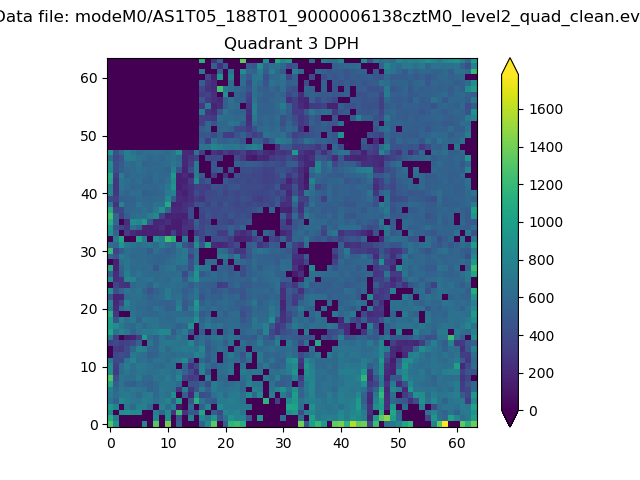 |
 |
Quadrant C |
| Plot type | Count rate plots | Images |
|---|---|---|
| Comparison with Poisson distribution Blue bars denote a histogram of data divided into 1 sec bins. Red curve is a Poisson curve with rate = median count rate of data. |
 |
 |
| Quadrant-wise count rates Data is divided into 100 sec bins |
 |
|
| Module-wise count rates for Quadrant A Data is divided into 100 sec bins |
 |
 |
| Module-wise count rates for Quadrant B Data is divided into 100 sec bins |
 |
 |
| Module-wise count rates for Quadrant C Data is divided into 100 sec bins |
 |
 |
| Module-wise count rates for Quadrant D Data is divided into 100 sec bins |
 |
 |
| Parameter | Plot |
|---|---|
| CZT HV Monitor |  |
| D_VDD | 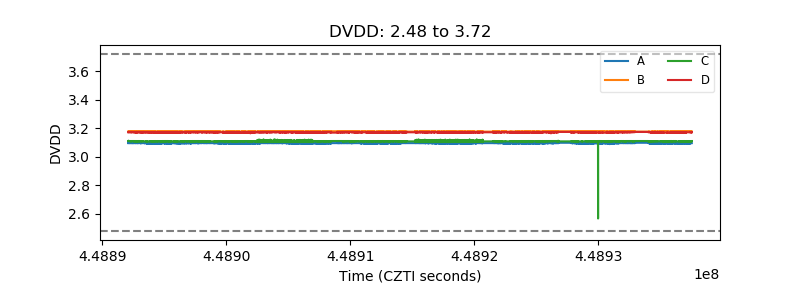 |
| Temperature 1 |  |
| Veto HV Monitor |  |
| Veto LLD | 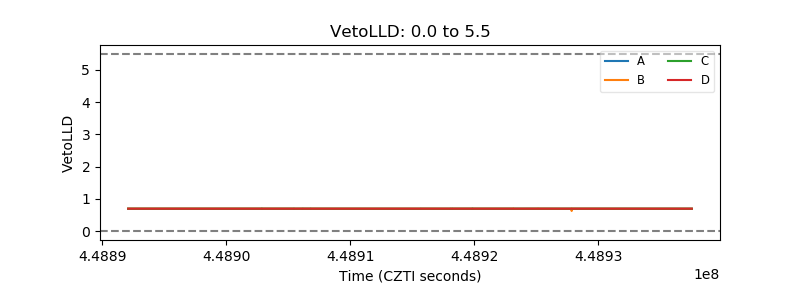 |
| Alpha Counter |  |
| _CPM_Rate |  |
| CZT Counter |  |
| +2.5 Volts monitor |  |
| +5 Volts monitor |  |
| _ROLL_ROT |  |
| _Roll_DEC |  |
| _Roll_RA |  |
| Veto Counter |  |