| Param | Original file | Final file |
|---|---|---|
| Filename | modeM0/AS1A13_037T01_9000006212cztM0_level2.fits | modeM0/AS1A13_037T01_9000006212cztM0_level2_quad_clean.evt |
| Size (bytes) | 467,795,520 | 455,068,800 |
| Size | 446.1 MB | 434.0 MB |
| Events in quadrant A | 2,748,954 | 2,642,826 |
| Events in quadrant B | 2,697,532 | 2,690,126 |
| Events in quadrant C | 2,773,818 | 2,547,833 |
| Events in quadrant D | 2,356,250 | 2,312,229 |
| Mode M9 | |||
|---|---|---|---|
| Quadrant | BADHDUFLAG | Total packets | Discarded packets |
| A | 0 | 85 | 0 |
| B | 0 | 85 | 0 |
| C | 0 | 85 | 0 |
| D | 0 | 85 | 0 |
| Mode SS | |||
|---|---|---|---|
| Quadrant | BADHDUFLAG | Total packets | Discarded packets |
| A | 0 | 1066 | 0 |
| B | 0 | 1066 | 0 |
| C | 0 | 1066 | 0 |
| D | 0 | 1066 | 0 |
| Mode M0 | |||
|---|---|---|---|
| Quadrant | BADHDUFLAG | Total packets | Discarded packets |
| A | 0 | 180514 | 0 |
| B | 0 | 115292 | 0 |
| C | 0 | 122347 | 0 |
| D | 0 | 144278 | 0 |
| Quadrant | Total seconds | Saturated seconds | Saturation percentage |
|---|---|---|---|
| A | 52293 | 1760 | 3.365651% |
| B | 52293 | 1126 | 2.153252% |
| C | 52294 | 1414 | 2.703943% |
| D | 52294 | 2619 | 5.008223% |
Noise dominated data is calculated using 1-second bins in cleaned event files. If a bin has >2000 counts, and if more than 50% of those come from <1% of pixels, then it is considered to be noise-dominated and hence unusable.
| Quadrant | # 1 sec bins | Bins with >0 counts | Bins with >2000 counts | High rate bins dominated by noise | Noise dominated (total time) | Noise dominated (detector-on time) | Marked lightcurve |
|---|---|---|---|---|---|---|---|
| A | 60803 | 52288 | 0 | 0 | 0.00% | 0.00% |  |
| B | 60804 | 52278 | 0 | 0 | 0.00% | 0.00% |  |
| C | 60804 | 52288 | 0 | 0 | 0.00% | 0.00% | 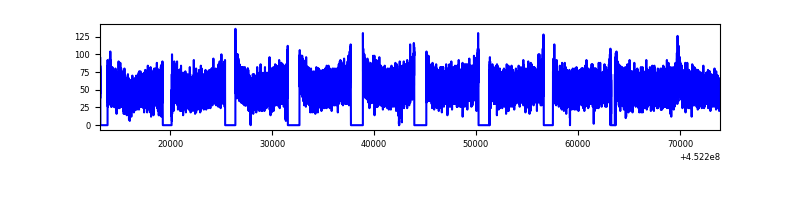 |
| D | 60804 | 52271 | 0 | 0 | 0.00% | 0.00% |  |
Top three noisy pixels from each quadrant. If the there are fewer than three noisy pixels in the level2.evt file, extra rows are filled as -1
| Pixel properties | Quadrant properties | ||||||
|---|---|---|---|---|---|---|---|
| Quadrant | DetID | PixID | Counts | Sigma | Mean | Median | Sigma |
| A | 7 | 110 | 2168 | 8.13 | 718 | 670 | 184.3 |
| A | 0 | 29 | 2143 | 7.99 | 718 | 670 | 184.3 |
| A | 14 | 95 | 2054 | 7.51 | 718 | 670 | 184.3 |
| B | 2 | 9 | 2431 | 12.51 | 715 | 680 | 139.9 |
| B | 2 | 8 | 2005 | 9.47 | 715 | 680 | 139.9 |
| B | 3 | 17 | 1897 | 8.7 | 715 | 680 | 139.9 |
| C | 1 | 81 | 2097 | 7.41 | 733 | 680 | 191.3 |
| C | 3 | 202 | 2092 | 7.38 | 733 | 680 | 191.3 |
| C | 3 | 203 | 2008 | 6.94 | 733 | 680 | 191.3 |
| D | 10 | 189 | 1747 | 6.0 | 676 | 612 | 189.3 |
| D | 4 | 16 | 1711 | 5.81 | 676 | 612 | 189.3 |
| D | 15 | 47 | 1694 | 5.72 | 676 | 612 | 189.3 |
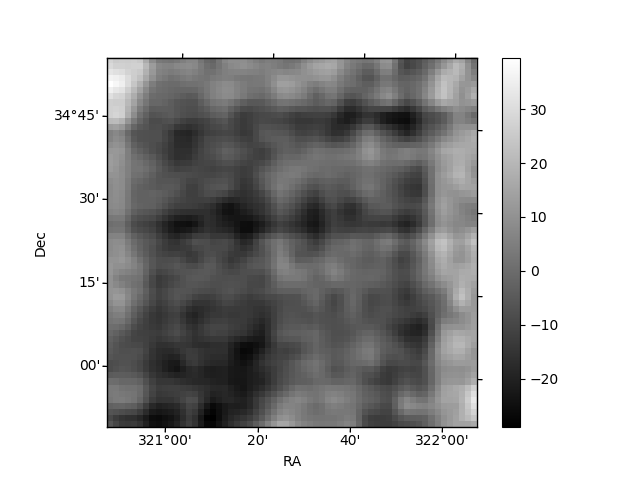
Histogram calculated using DETX and DETY for each event in the final _common_clean file
| Quadrant A | 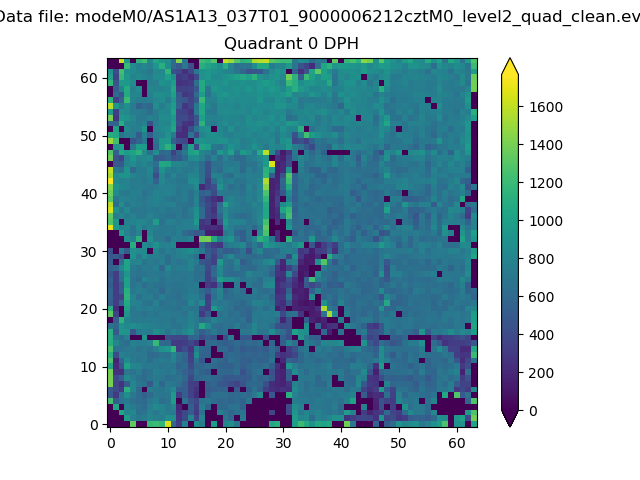 |
 |
Quadrant B |
|---|---|---|---|
| Quadrant D | 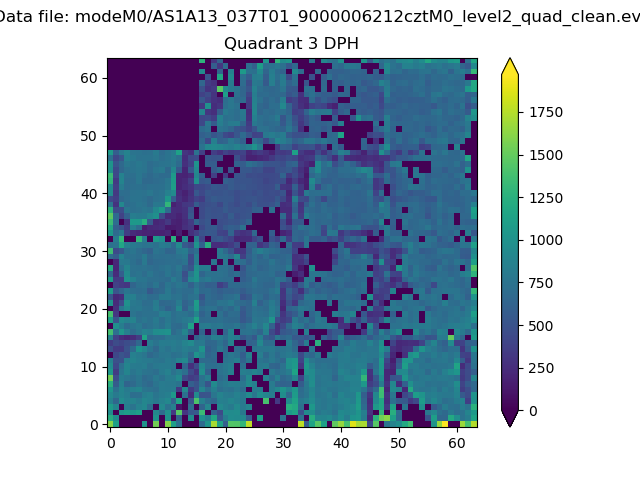 |
 |
Quadrant C |
| Plot type | Count rate plots | Images |
|---|---|---|
| Comparison with Poisson distribution Blue bars denote a histogram of data divided into 1 sec bins. Red curve is a Poisson curve with rate = median count rate of data. |
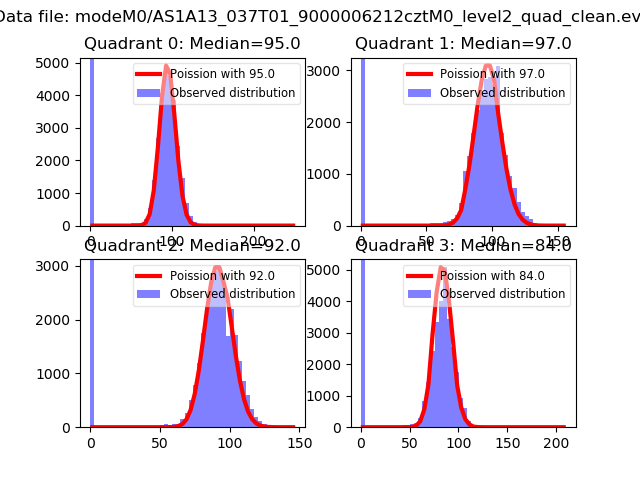 |
 |
| Quadrant-wise count rates Data is divided into 100 sec bins |
 |
|
| Module-wise count rates for Quadrant A Data is divided into 100 sec bins |
 |
 |
| Module-wise count rates for Quadrant B Data is divided into 100 sec bins |
 |
 |
| Module-wise count rates for Quadrant C Data is divided into 100 sec bins |
 |
 |
| Module-wise count rates for Quadrant D Data is divided into 100 sec bins |
 |
 |
| Parameter | Plot |
|---|---|
| CZT HV Monitor |  |
| D_VDD | 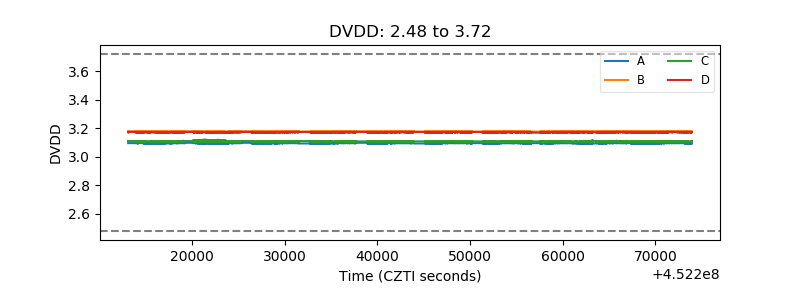 |
| Temperature 1 |  |
| Veto HV Monitor |  |
| Veto LLD | 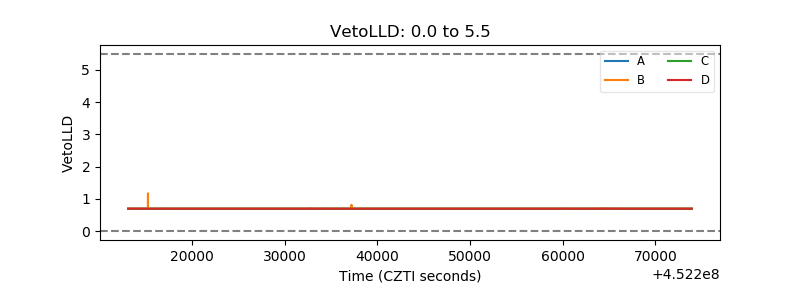 |
| Alpha Counter | 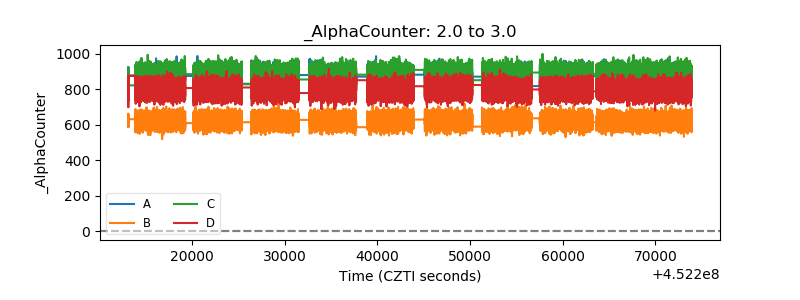 |
| _CPM_Rate |  |
| CZT Counter |  |
| +2.5 Volts monitor | 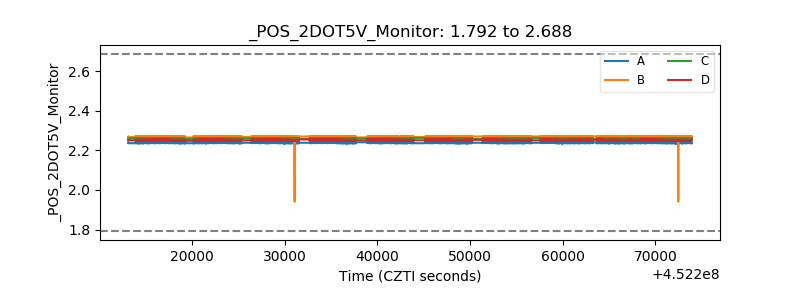 |
| +5 Volts monitor | 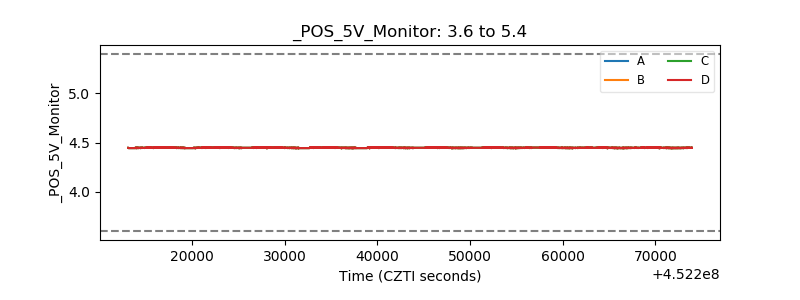 |
| _ROLL_ROT |  |
| _Roll_DEC |  |
| _Roll_RA | 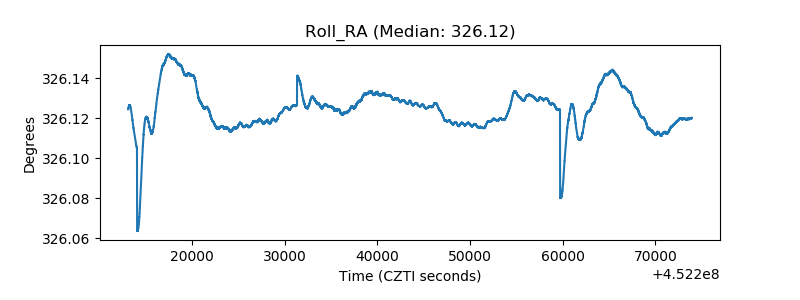 |
| Veto Counter | 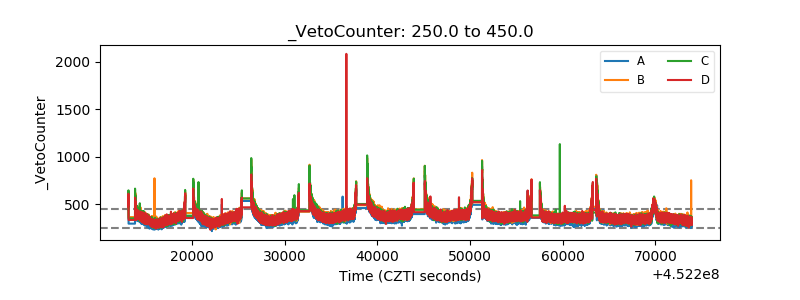 |