| Param | Original file | Final file |
|---|---|---|
| Filename | modeM0/AS1A13_091T05_9000006224cztM0_level2.fits | modeM0/AS1A13_091T05_9000006224cztM0_level2_quad_clean.evt |
| Size (bytes) | 486,878,400 | 451,005,120 |
| Size | 464.3 MB | 430.1 MB |
| Events in quadrant A | 2,839,758 | 2,533,954 |
| Events in quadrant B | 2,702,390 | 2,523,408 |
| Events in quadrant C | 2,922,454 | 2,543,594 |
| Events in quadrant D | 2,508,234 | 2,288,909 |
| Mode M9 | |||
|---|---|---|---|
| Quadrant | BADHDUFLAG | Total packets | Discarded packets |
| A | 0 | 93 | 0 |
| B | 0 | 93 | 0 |
| C | 0 | 93 | 0 |
| D | 0 | 93 | 0 |
| Mode M0 | |||
|---|---|---|---|
| Quadrant | BADHDUFLAG | Total packets | Discarded packets |
| A | 0 | 208610 | 0 |
| B | 0 | 149884 | 0 |
| C | 0 | 122339 | 0 |
| D | 0 | 140083 | 0 |
| Mode SS | |||
|---|---|---|---|
| Quadrant | BADHDUFLAG | Total packets | Discarded packets |
| A | 0 | 1114 | 0 |
| B | 0 | 1114 | 0 |
| C | 0 | 1114 | 0 |
| D | 0 | 1114 | 0 |
| Quadrant | Total seconds | Saturated seconds | Saturation percentage |
|---|---|---|---|
| A | 54930 | 3506 | 6.382669% |
| B | 54930 | 5358 | 9.754233% |
| C | 54930 | 854 | 1.554706% |
| D | 54930 | 1892 | 3.444384% |
Noise dominated data is calculated using 1-second bins in cleaned event files. If a bin has >2000 counts, and if more than 50% of those come from <1% of pixels, then it is considered to be noise-dominated and hence unusable.
| Quadrant | # 1 sec bins | Bins with >0 counts | Bins with >2000 counts | High rate bins dominated by noise | Noise dominated (total time) | Noise dominated (detector-on time) | Marked lightcurve |
|---|---|---|---|---|---|---|---|
| A | 64015 | 54919 | 0 | 0 | 0.00% | 0.00% |  |
| B | 64015 | 54625 | 0 | 0 | 0.00% | 0.00% |  |
| C | 64015 | 54924 | 0 | 0 | 0.00% | 0.00% |  |
| D | 64015 | 54911 | 0 | 0 | 0.00% | 0.00% | 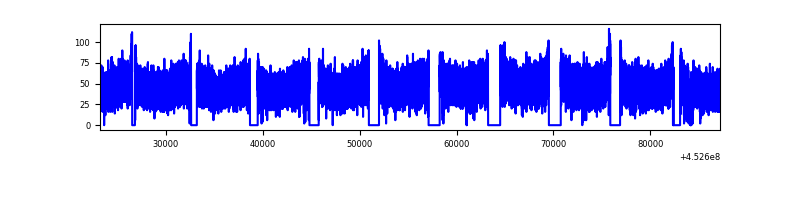 |
Top three noisy pixels from each quadrant. If the there are fewer than three noisy pixels in the level2.evt file, extra rows are filled as -1
| Pixel properties | Quadrant properties | ||||||
|---|---|---|---|---|---|---|---|
| Quadrant | DetID | PixID | Counts | Sigma | Mean | Median | Sigma |
| A | 7 | 110 | 2300 | 8.53 | 741 | 690 | 188.8 |
| A | 0 | 29 | 2199 | 7.99 | 741 | 690 | 188.8 |
| A | 0 | 30 | 2078 | 7.35 | 741 | 690 | 188.8 |
| B | 2 | 9 | 2531 | 12.99 | 714 | 677 | 142.7 |
| B | 2 | 8 | 2003 | 9.29 | 714 | 677 | 142.7 |
| B | 3 | 17 | 1964 | 9.02 | 714 | 677 | 142.7 |
| C | 3 | 202 | 2218 | 7.57 | 774 | 721 | 197.9 |
| C | 1 | 81 | 2206 | 7.51 | 774 | 721 | 197.9 |
| C | 3 | 203 | 2203 | 7.49 | 774 | 721 | 197.9 |
| D | 6 | 38 | 1860 | 6.02 | 721 | 655 | 200.2 |
| D | 12 | 6 | 1817 | 5.8 | 721 | 655 | 200.2 |
| D | 6 | 67 | 1793 | 5.68 | 721 | 655 | 200.2 |
Histogram calculated using DETX and DETY for each event in the final _common_clean file
| Quadrant A |  |
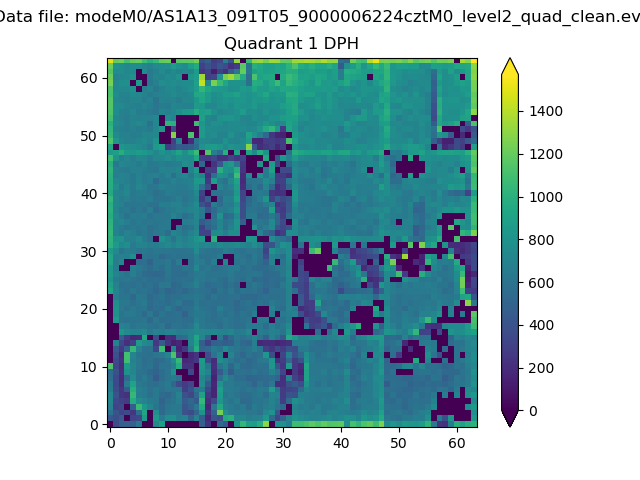 |
Quadrant B |
|---|---|---|---|
| Quadrant D | 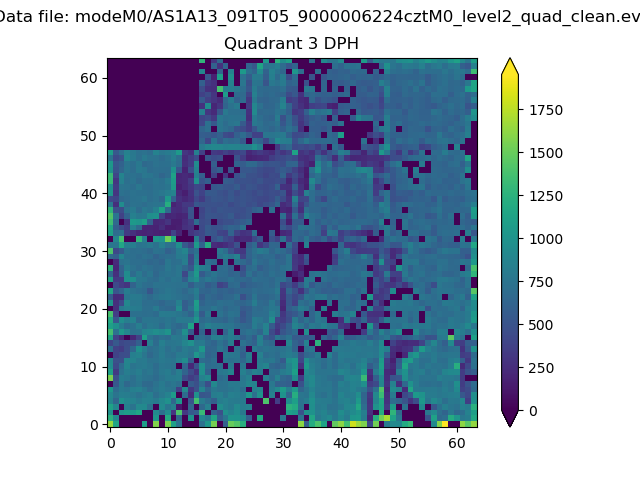 |
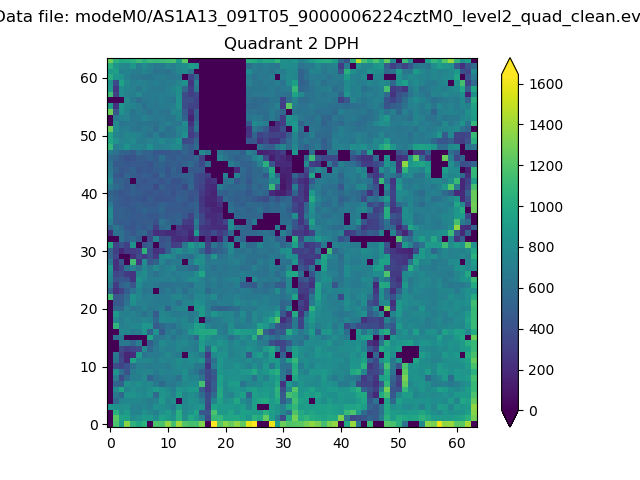 |
Quadrant C |
| Plot type | Count rate plots | Images |
|---|---|---|
| Comparison with Poisson distribution Blue bars denote a histogram of data divided into 1 sec bins. Red curve is a Poisson curve with rate = median count rate of data. |
 |
 |
| Quadrant-wise count rates Data is divided into 100 sec bins |
 |
|
| Module-wise count rates for Quadrant A Data is divided into 100 sec bins |
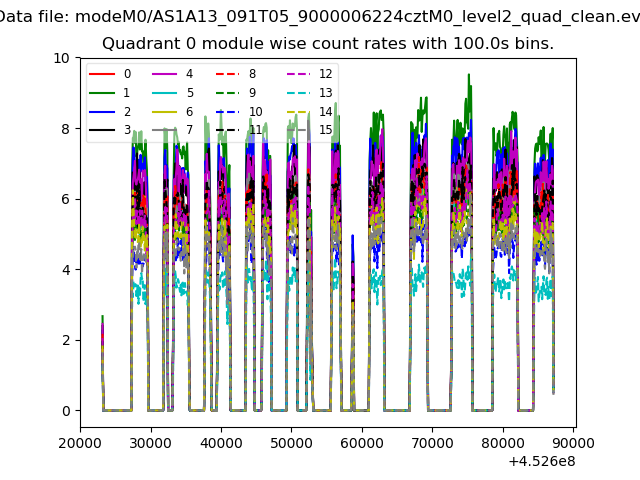 |
 |
| Module-wise count rates for Quadrant B Data is divided into 100 sec bins |
 |
 |
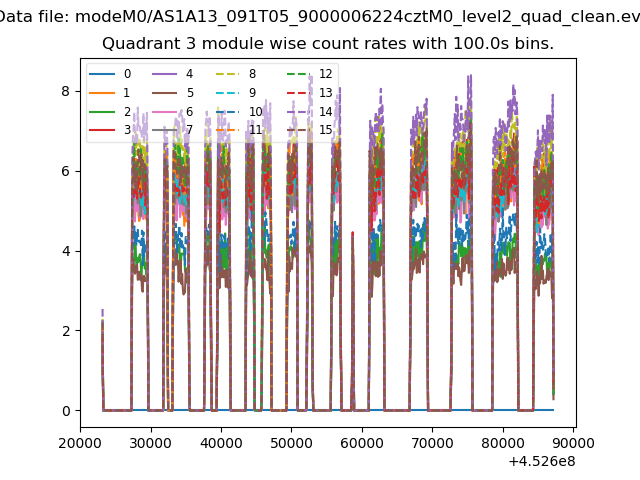
| Module-wise count rates for Quadrant C Data is divided into 100 sec bins |
 |
 |
| Module-wise count rates for Quadrant D Data is divided into 100 sec bins |
 |
 |
| Parameter | Plot |
|---|---|
| CZT HV Monitor |  |
| D_VDD | 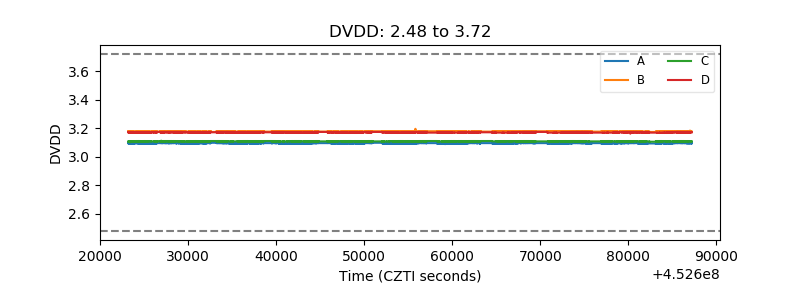 |
| Temperature 1 |  |
| Veto HV Monitor | 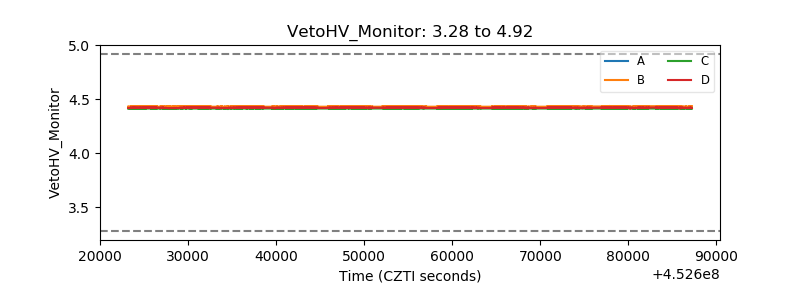 |
| Veto LLD |  |
| Alpha Counter |  |
| _CPM_Rate |  |
| CZT Counter |  |
| +2.5 Volts monitor |  |
| +5 Volts monitor |  |
| _ROLL_ROT |  |
| _Roll_DEC |  |
| _Roll_RA |  |
| Veto Counter |  |