| Param | Original file | Final file |
|---|---|---|
| Filename | modeM0/AS1C03_005T02_9000006230cztM0_level2.fits | modeM0/AS1C03_005T02_9000006230cztM0_level2_quad_clean.evt |
| Size (bytes) | 519,978,240 | 736,320,960 |
| Size | 495.9 MB | 702.2 MB |
| Events in quadrant A | 3,063,210 | 4,842,919 |
| Events in quadrant B | 3,036,774 | 5,007,077 |
| Events in quadrant C | 2,945,084 | 4,286,378 |
| Events in quadrant D | 2,586,578 | 4,055,987 |
| Mode M9 | |||
|---|---|---|---|
| Quadrant | BADHDUFLAG | Total packets | Discarded packets |
| A | 0 | 93 | 0 |
| B | 0 | 93 | 0 |
| C | 0 | 93 | 0 |
| D | 0 | 93 | 0 |
| Mode SS | |||
|---|---|---|---|
| Quadrant | BADHDUFLAG | Total packets | Discarded packets |
| A | 0 | 1216 | 0 |
| B | 0 | 1216 | 0 |
| C | 0 | 1216 | 0 |
| D | 0 | 1216 | 0 |
| Mode M0 | |||
|---|---|---|---|
| Quadrant | BADHDUFLAG | Total packets | Discarded packets |
| A | 0 | 201098 | 0 |
| B | 0 | 127926 | 0 |
| C | 0 | 178925 | 0 |
| D | 0 | 197607 | 0 |
| Quadrant | Total seconds | Saturated seconds | Saturation percentage |
|---|---|---|---|
| A | 59913 | 1945 | 3.246374% |
| B | 59913 | 752 | 1.255153% |
| C | 59911 | 7255 | 12.109629% |
| D | 59912 | 5447 | 9.091668% |
Noise dominated data is calculated using 1-second bins in cleaned event files. If a bin has >2000 counts, and if more than 50% of those come from <1% of pixels, then it is considered to be noise-dominated and hence unusable.
| Quadrant | # 1 sec bins | Bins with >0 counts | Bins with >2000 counts | High rate bins dominated by noise | Noise dominated (total time) | Noise dominated (detector-on time) | Marked lightcurve |
|---|---|---|---|---|---|---|---|
| A | 69168 | 59905 | 0 | 0 | 0.00% | 0.00% | 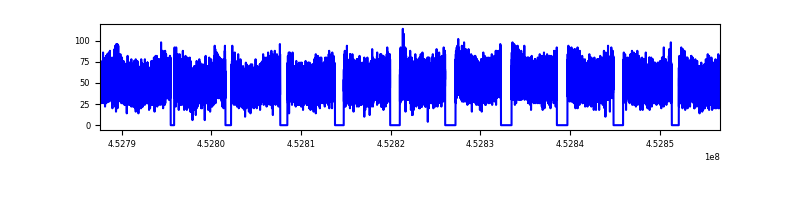 |
| B | 69168 | 59902 | 0 | 0 | 0.00% | 0.00% | 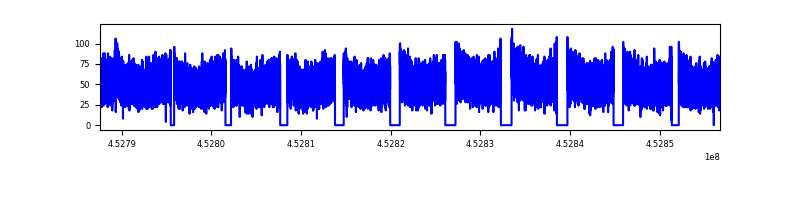 |
| C | 69168 | 59851 | 0 | 0 | 0.00% | 0.00% | 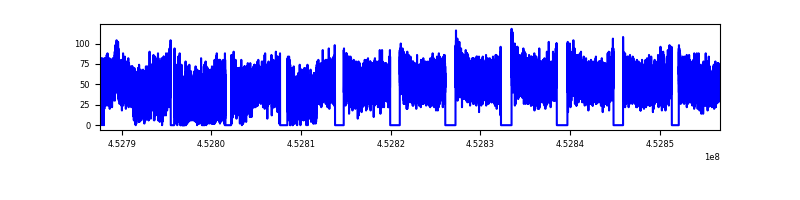 |
| D | 69167 | 59854 | 0 | 0 | 0.00% | 0.00% | 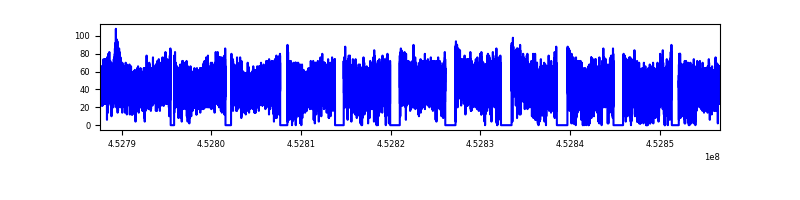 |
Top three noisy pixels from each quadrant. If the there are fewer than three noisy pixels in the level2.evt file, extra rows are filled as -1
| Pixel properties | Quadrant properties | ||||||
|---|---|---|---|---|---|---|---|
| Quadrant | DetID | PixID | Counts | Sigma | Mean | Median | Sigma |
| A | 7 | 110 | 2540 | 8.71 | 800 | 749 | 205.7 |
| A | 14 | 95 | 2400 | 8.03 | 800 | 749 | 205.7 |
| A | 7 | 109 | 2298 | 7.53 | 800 | 749 | 205.7 |
| B | 2 | 9 | 2790 | 12.63 | 805 | 770 | 159.9 |
| B | 2 | 8 | 2242 | 9.21 | 805 | 770 | 159.9 |
| B | 3 | 17 | 2124 | 8.47 | 805 | 770 | 159.9 |
| C | 1 | 81 | 2316 | 7.96 | 778 | 726 | 199.8 |
| C | 3 | 202 | 2233 | 7.54 | 778 | 726 | 199.8 |
| C | 1 | 80 | 2218 | 7.47 | 778 | 726 | 199.8 |
| D | 10 | 189 | 1955 | 6.22 | 742 | 674 | 206.0 |
| D | 6 | 67 | 1905 | 5.98 | 742 | 674 | 206.0 |
| D | 10 | 113 | 1898 | 5.94 | 742 | 674 | 206.0 |
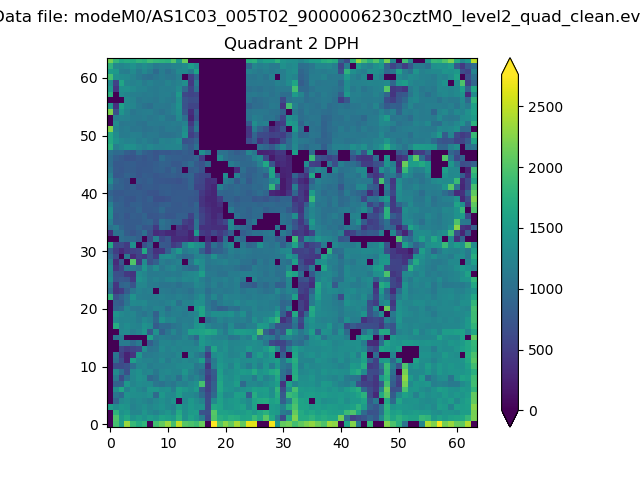
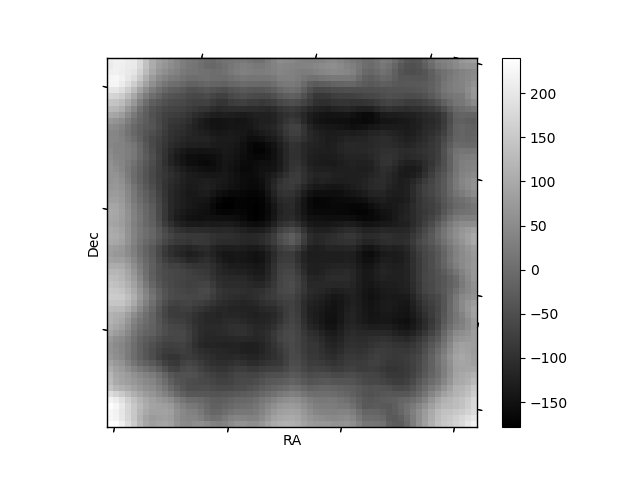
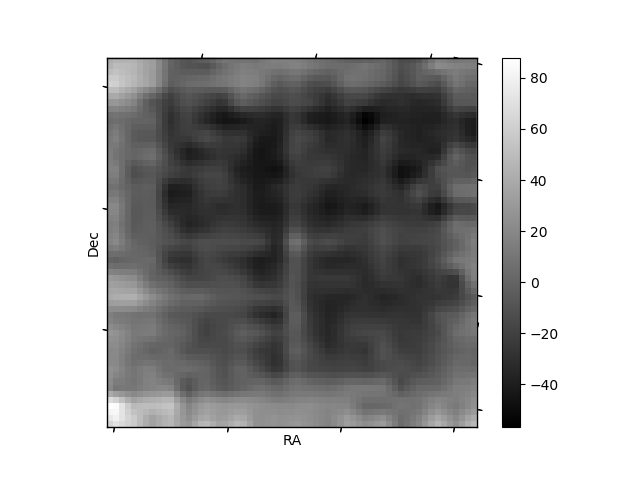
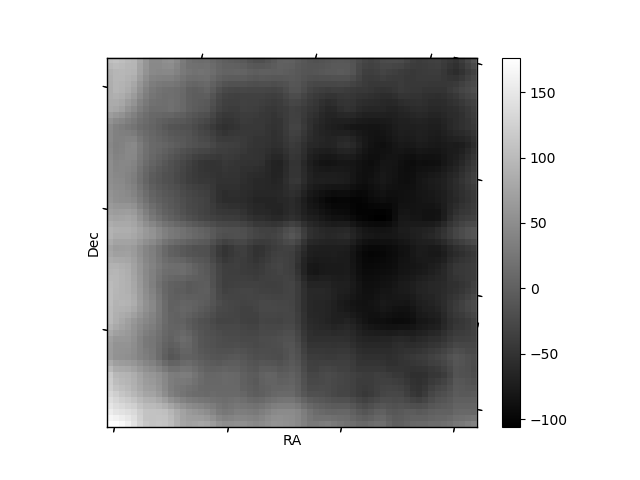
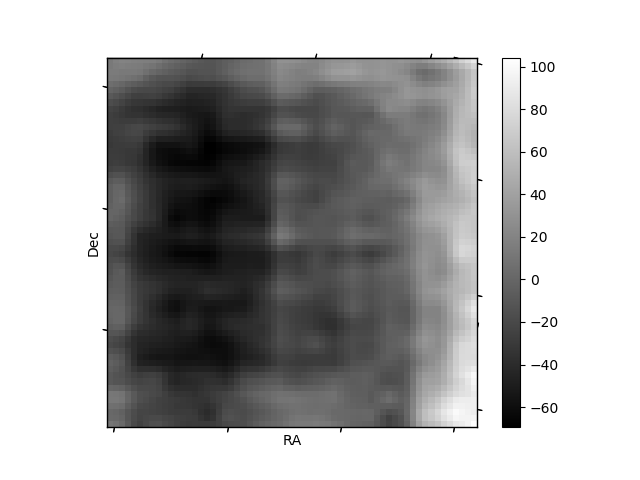
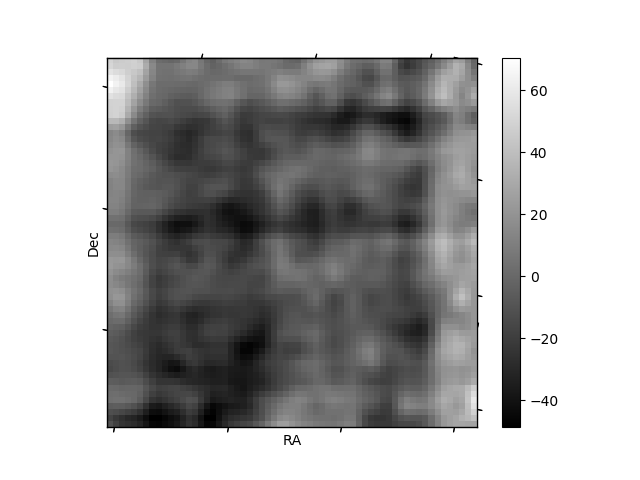
Histogram calculated using DETX and DETY for each event in the final _common_clean file
| Quadrant A | 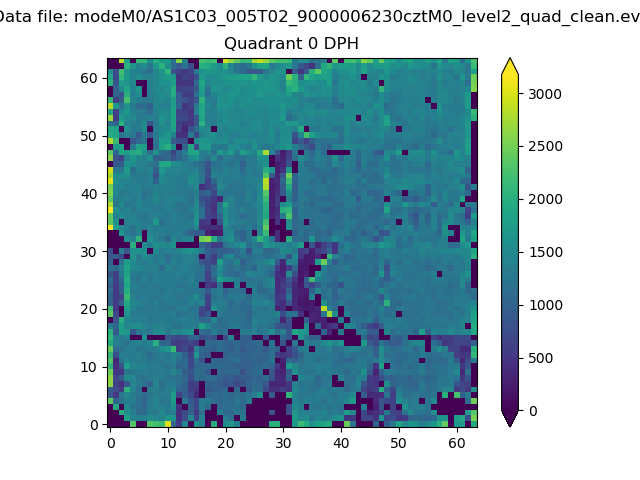 |
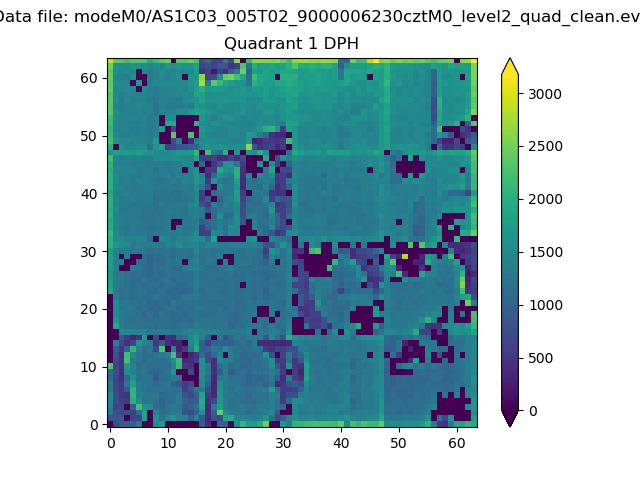 |
Quadrant B |
|---|---|---|---|
| Quadrant D | 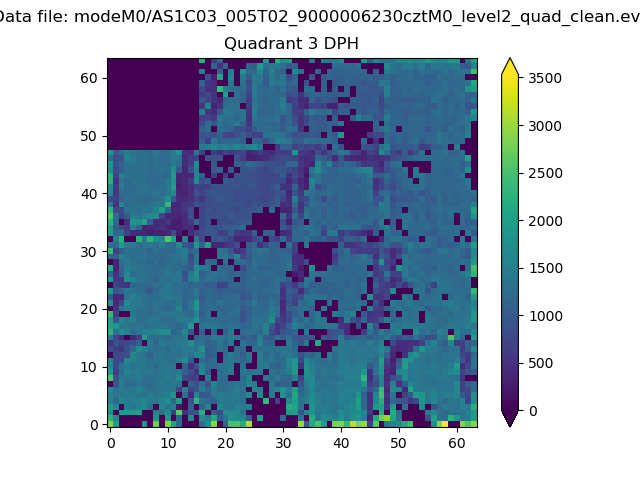 |
 |
Quadrant C |
| Plot type | Count rate plots | Images |
|---|---|---|
| Comparison with Poisson distribution Blue bars denote a histogram of data divided into 1 sec bins. Red curve is a Poisson curve with rate = median count rate of data. |
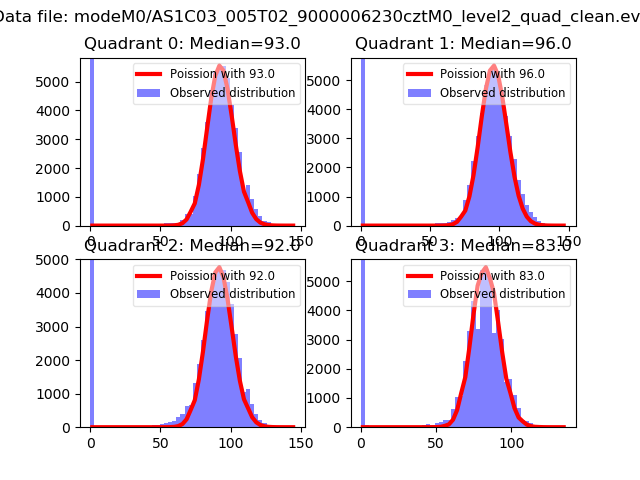 |
 |
| Quadrant-wise count rates Data is divided into 100 sec bins |
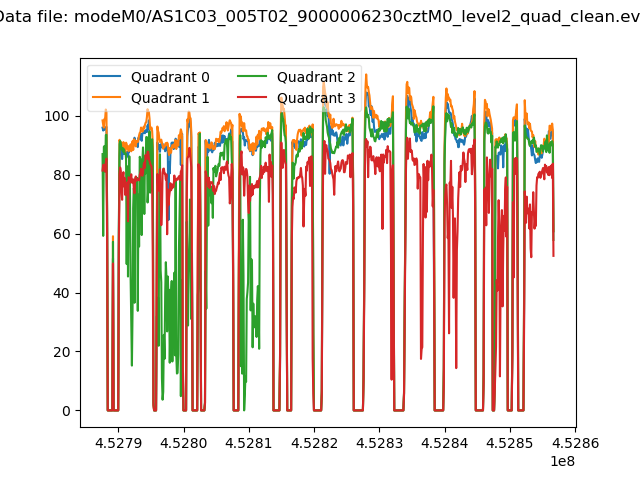 |
|
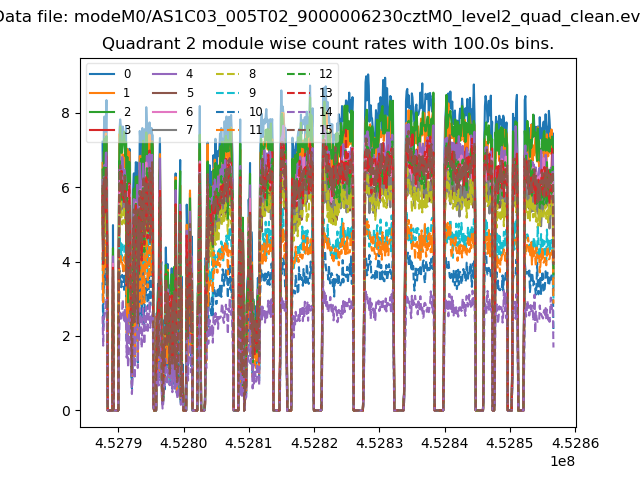
| Module-wise count rates for Quadrant A Data is divided into 100 sec bins |
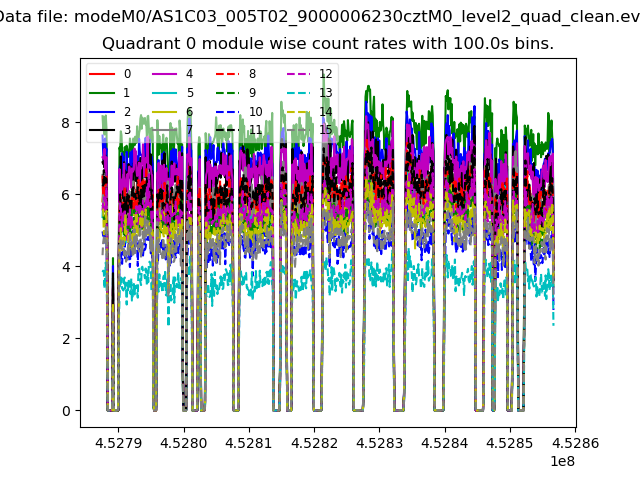 |
 |
| Module-wise count rates for Quadrant B Data is divided into 100 sec bins |
 |
 |
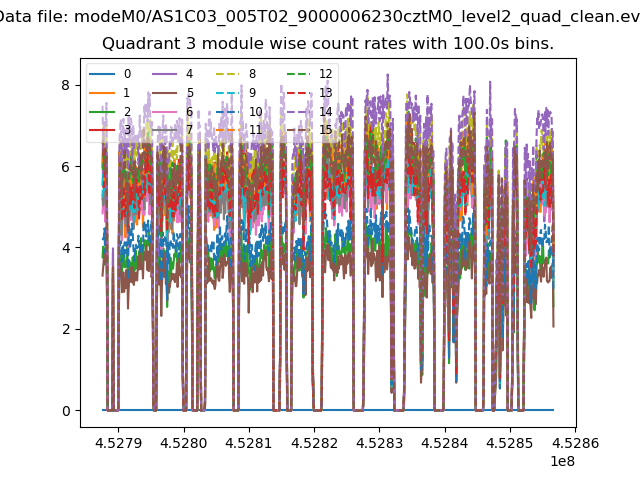
| Module-wise count rates for Quadrant C Data is divided into 100 sec bins |
 |
 |
| Module-wise count rates for Quadrant D Data is divided into 100 sec bins |
 |
 |
| Parameter | Plot |
|---|---|
| CZT HV Monitor | 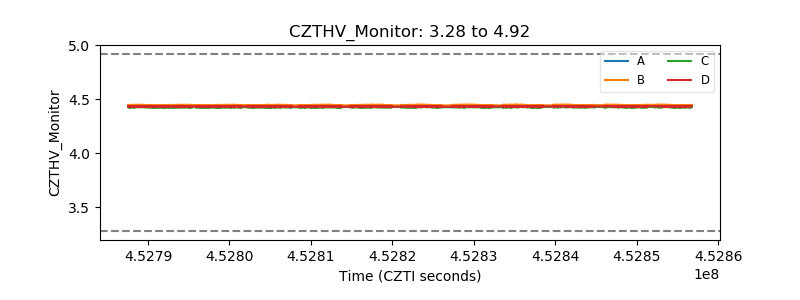 |
| D_VDD | 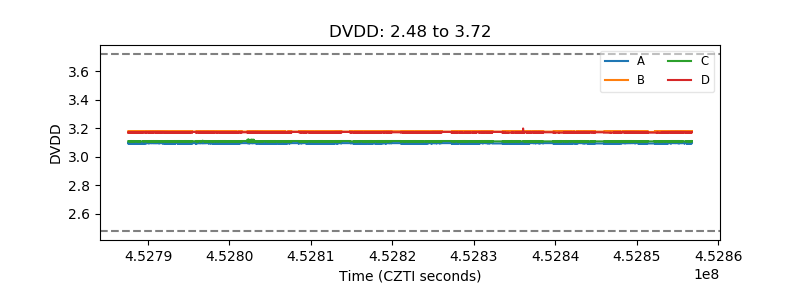 |
| Temperature 1 | 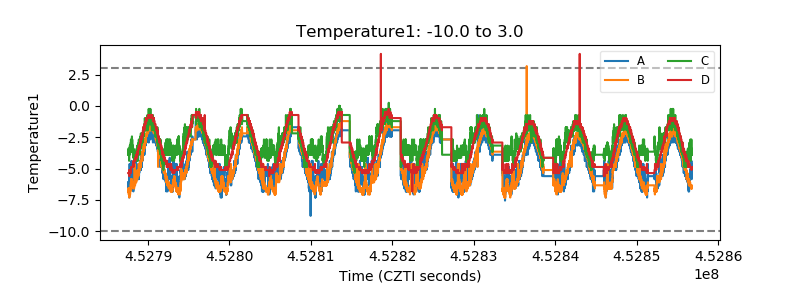 |
| Veto HV Monitor | 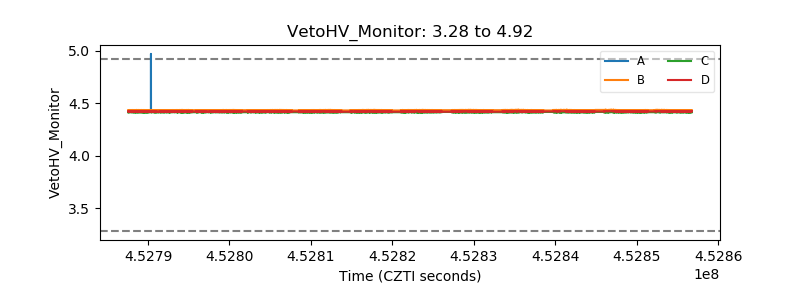 |
| Veto LLD | 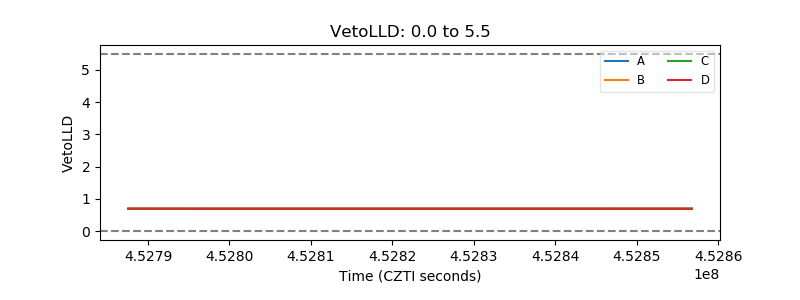 |
| Alpha Counter | 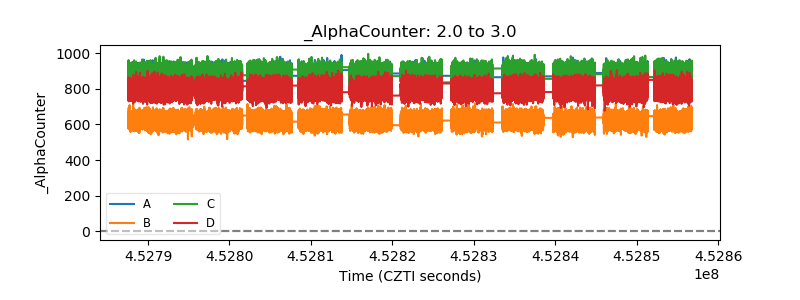 |
| _CPM_Rate | 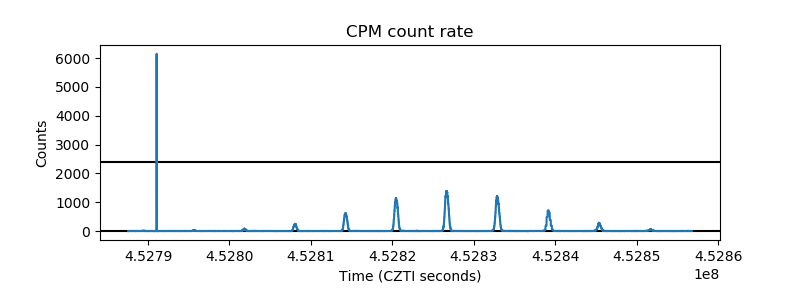 |
| CZT Counter | 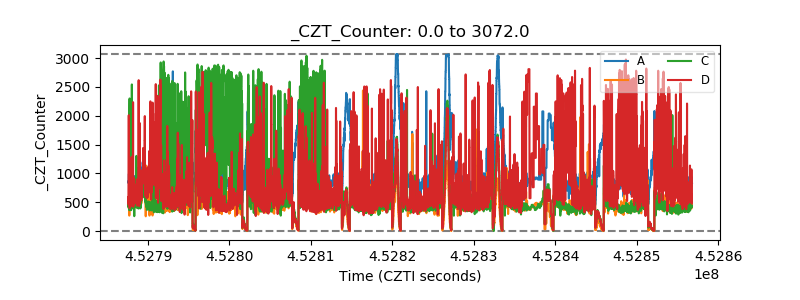 |
| +2.5 Volts monitor | 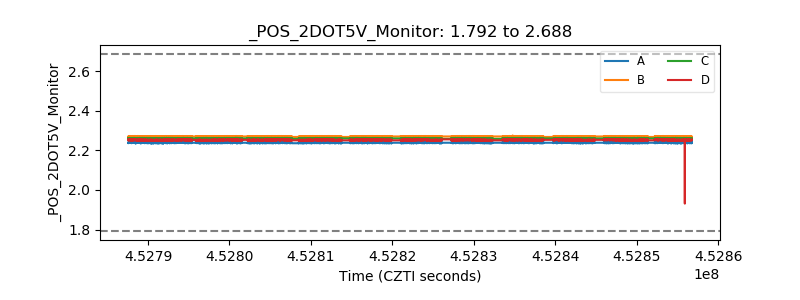 |
| +5 Volts monitor | 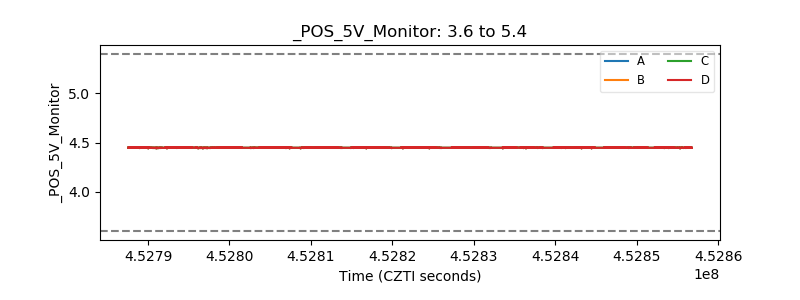 |
| _ROLL_ROT | 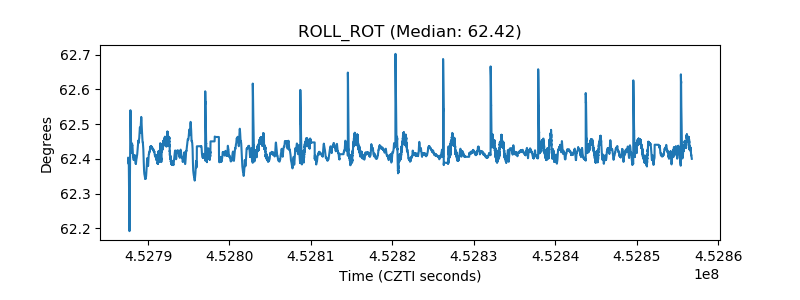 |
| _Roll_DEC | 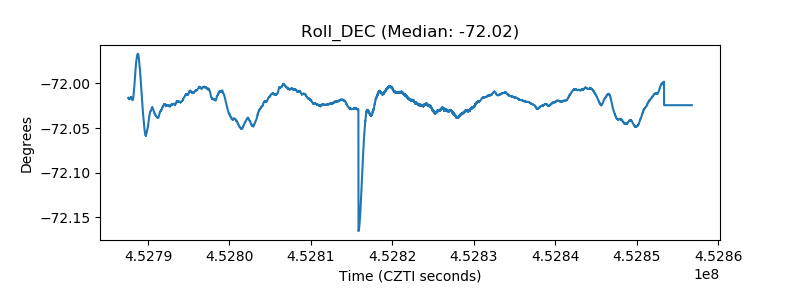 |
| _Roll_RA | 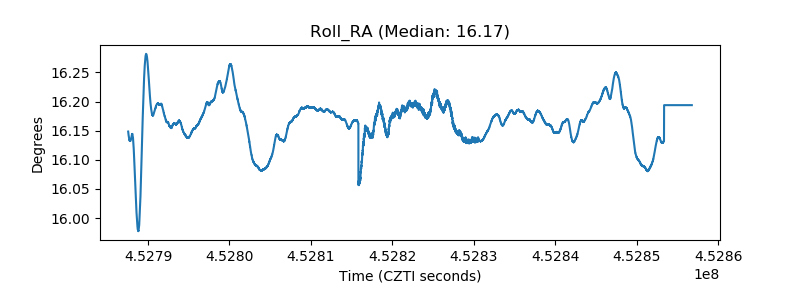 |
| Veto Counter | 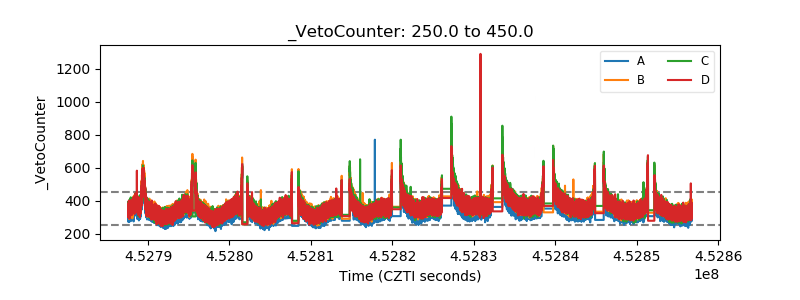 |