| Param | Original file | Final file |
|---|---|---|
| Filename | modeM0/AS1C07_001T10_9000006232cztM0_level2.fits | modeM0/AS1C07_001T10_9000006232cztM0_level2_quad_clean.evt |
| Size (bytes) | 743,993,280 | 1,102,366,080 |
| Size | 709.5 MB | 1.0 GB |
| Events in quadrant A | 4,401,608 | 7,366,920 |
| Events in quadrant B | 4,332,136 | 7,566,528 |
| Events in quadrant C | 4,513,208 | 7,448,133 |
| Events in quadrant D | 3,286,388 | 5,022,645 |
| Mode M9 | |||
|---|---|---|---|
| Quadrant | BADHDUFLAG | Total packets | Discarded packets |
| A | 0 | 93 | 0 |
| B | 0 | 93 | 0 |
| C | 0 | 93 | 0 |
| D | 0 | 93 | 0 |
| Mode M0 | |||
|---|---|---|---|
| Quadrant | BADHDUFLAG | Total packets | Discarded packets |
| A | 0 | 289463 | 0 |
| B | 0 | 193651 | 0 |
| C | 0 | 182864 | 0 |
| D | 0 | 406372 | 0 |
| Mode SS | |||
|---|---|---|---|
| Quadrant | BADHDUFLAG | Total packets | Discarded packets |
| A | 0 | 1768 | 0 |
| B | 0 | 1768 | 0 |
| C | 0 | 1768 | 0 |
| D | 0 | 1768 | 0 |
| Quadrant | Total seconds | Saturated seconds | Saturation percentage |
|---|---|---|---|
| A | 87293 | 2532 | 2.900576% |
| B | 87295 | 1755 | 2.010424% |
| C | 87296 | 775 | 0.887784% |
| D | 87297 | 25891 | 29.658522% |
Noise dominated data is calculated using 1-second bins in cleaned event files. If a bin has >2000 counts, and if more than 50% of those come from <1% of pixels, then it is considered to be noise-dominated and hence unusable.
| Quadrant | # 1 sec bins | Bins with >0 counts | Bins with >2000 counts | High rate bins dominated by noise | Noise dominated (total time) | Noise dominated (detector-on time) | Marked lightcurve |
|---|---|---|---|---|---|---|---|
| A | 102157 | 87288 | 0 | 0 | 0.00% | 0.00% |  |
| B | 102157 | 87280 | 0 | 0 | 0.00% | 0.00% |  |
| C | 102157 | 87289 | 0 | 0 | 0.00% | 0.00% |  |
| D | 102157 | 86435 | 0 | 0 | 0.00% | 0.00% |  |
Top three noisy pixels from each quadrant. If the there are fewer than three noisy pixels in the level2.evt file, extra rows are filled as -1
| Pixel properties | Quadrant properties | ||||||
|---|---|---|---|---|---|---|---|
| Quadrant | DetID | PixID | Counts | Sigma | Mean | Median | Sigma |
| A | 7 | 110 | 3593 | 8.48 | 1150 | 1075 | 296.8 |
| A | 0 | 29 | 3354 | 7.68 | 1150 | 1075 | 296.8 |
| A | 14 | 95 | 3346 | 7.65 | 1150 | 1075 | 296.8 |
| B | 2 | 9 | 4090 | 13.49 | 1146 | 1093 | 222.1 |
| B | 2 | 8 | 3258 | 9.75 | 1146 | 1093 | 222.1 |
| B | 3 | 17 | 2993 | 8.56 | 1146 | 1093 | 222.1 |
| C | 1 | 81 | 3552 | 7.89 | 1193 | 1110 | 309.7 |
| C | 3 | 202 | 3466 | 7.61 | 1193 | 1110 | 309.7 |
| C | 1 | 80 | 3455 | 7.57 | 1193 | 1110 | 309.7 |
| D | 15 | 47 | 2432 | 5.97 | 943 | 857 | 264.0 |
| D | 4 | 12 | 2430 | 5.96 | 943 | 857 | 264.0 |
| D | 6 | 38 | 2419 | 5.92 | 943 | 857 | 264.0 |
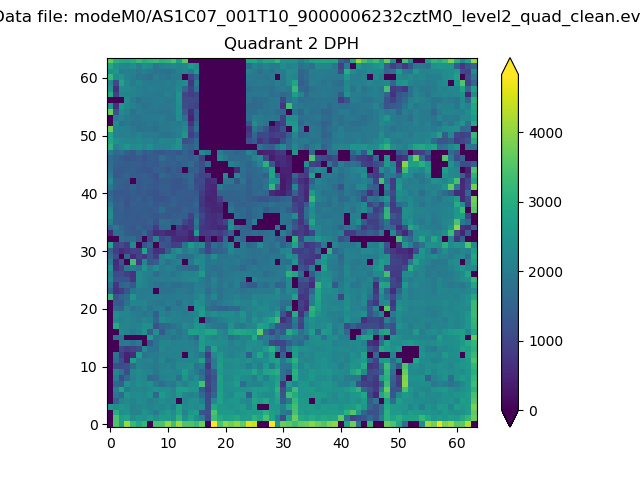
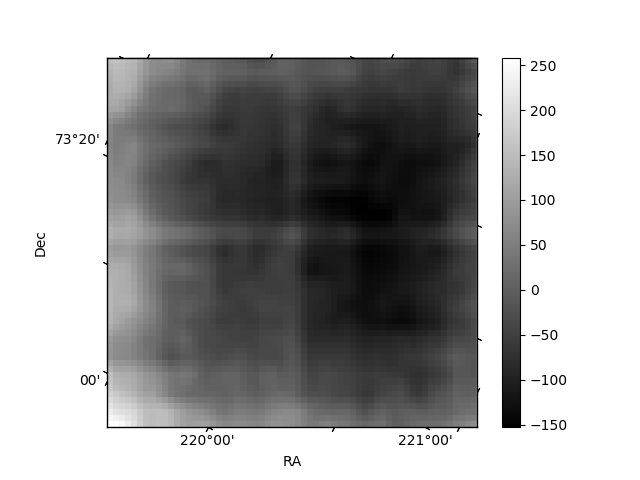
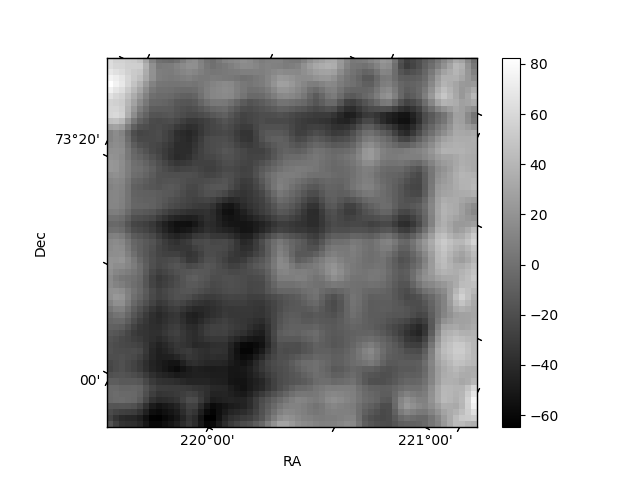
Histogram calculated using DETX and DETY for each event in the final _common_clean file
| Quadrant A | 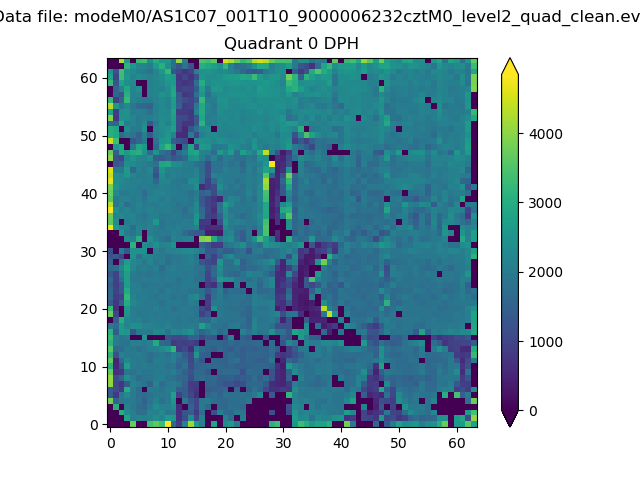 |
 |
Quadrant B |
|---|---|---|---|
| Quadrant D |  |
 |
Quadrant C |
| Plot type | Count rate plots | Images |
|---|---|---|
| Comparison with Poisson distribution Blue bars denote a histogram of data divided into 1 sec bins. Red curve is a Poisson curve with rate = median count rate of data. |
 |
 |
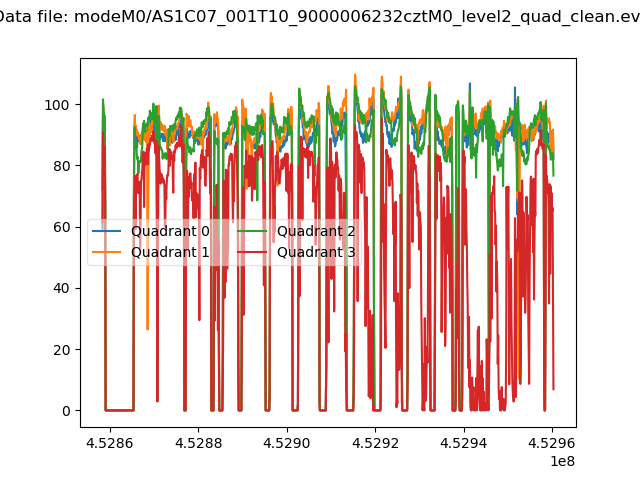
| Quadrant-wise count rates Data is divided into 100 sec bins |
 |
|
| Module-wise count rates for Quadrant A Data is divided into 100 sec bins |
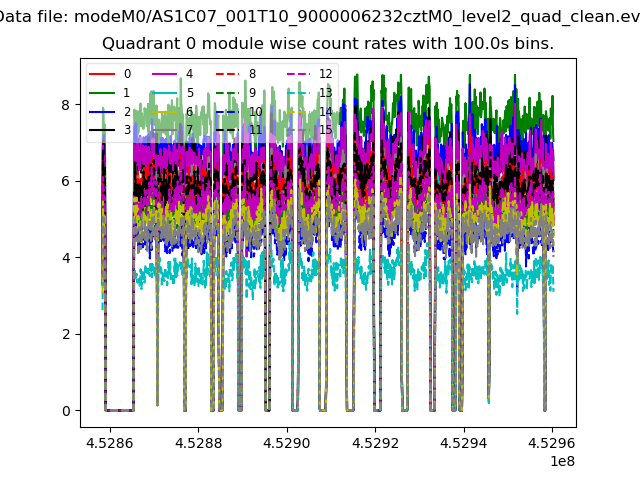 |
 |
| Module-wise count rates for Quadrant B Data is divided into 100 sec bins |
 |
 |
| Module-wise count rates for Quadrant C Data is divided into 100 sec bins |
 |
 |
| Module-wise count rates for Quadrant D Data is divided into 100 sec bins |
 |
 |
| Parameter | Plot |
|---|---|
| CZT HV Monitor | 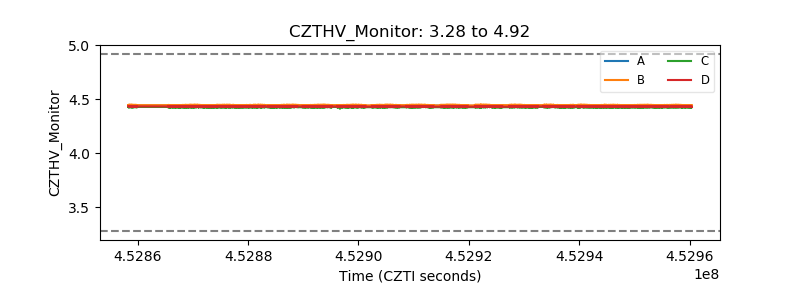 |
| D_VDD | 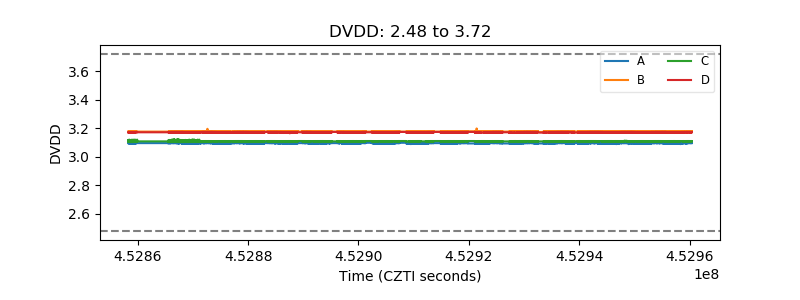 |
| Temperature 1 | 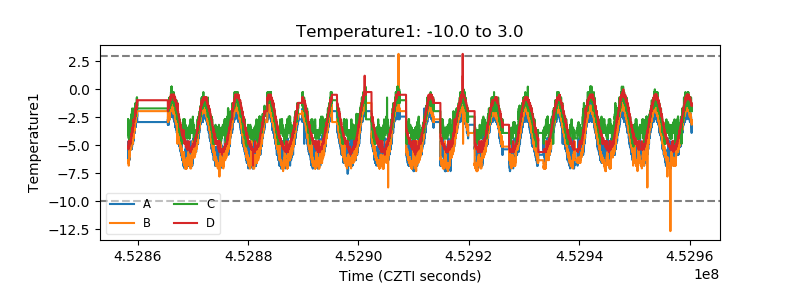 |
| Veto HV Monitor |  |
| Veto LLD |  |
| Alpha Counter |  |
| _CPM_Rate | 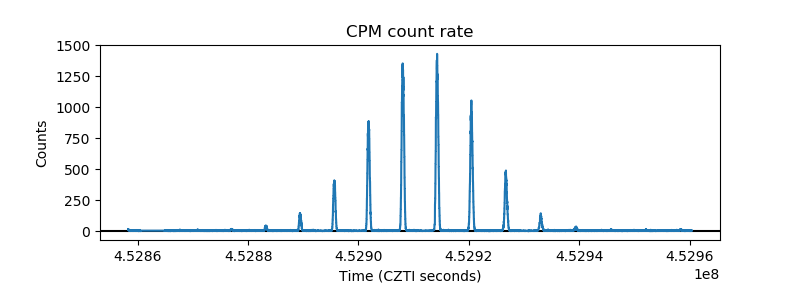 |
| CZT Counter | 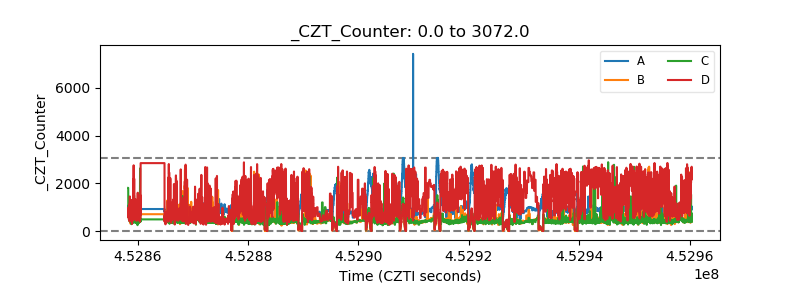 |
| +2.5 Volts monitor |  |
| +5 Volts monitor | 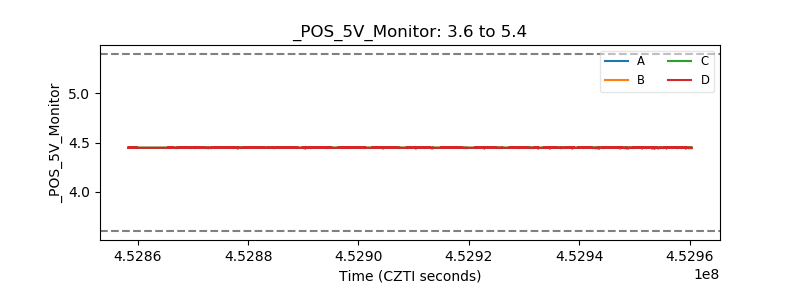 |
| _ROLL_ROT |  |
| _Roll_DEC | 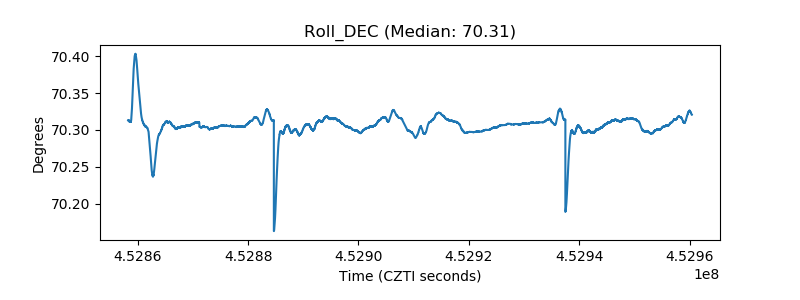 |
| _Roll_RA |  |
| Veto Counter |  |