| Param | Original file | Final file |
|---|---|---|
| Filename | modeM0/AS1A13_092T08_9000006236cztM0_level2.fits | modeM0/AS1A13_092T08_9000006236cztM0_level2_quad_clean.evt |
| Size (bytes) | 234,521,280 | 230,880,960 |
| Size | 223.7 MB | 220.2 MB |
| Events in quadrant A | 1,379,010 | 1,367,715 |
| Events in quadrant B | 1,357,066 | 1,413,431 |
| Events in quadrant C | 1,412,498 | 1,356,518 |
| Events in quadrant D | 1,072,260 | 974,767 |
| Mode M9 | |||
|---|---|---|---|
| Quadrant | BADHDUFLAG | Total packets | Discarded packets |
| A | 0 | 14 | 0 |
| B | 0 | 14 | 0 |
| C | 0 | 14 | 0 |
| D | 0 | 14 | 0 |
| Mode SS | |||
|---|---|---|---|
| Quadrant | BADHDUFLAG | Total packets | Discarded packets |
| A | 0 | 556 | 0 |
| B | 0 | 556 | 0 |
| C | 0 | 556 | 0 |
| D | 0 | 556 | 0 |
| Mode M0 | |||
|---|---|---|---|
| Quadrant | BADHDUFLAG | Total packets | Discarded packets |
| A | 0 | 97846 | 0 |
| B | 0 | 62646 | 0 |
| C | 0 | 58946 | 0 |
| D | 0 | 110193 | 0 |
| Quadrant | Total seconds | Saturated seconds | Saturation percentage |
|---|---|---|---|
| A | 27310 | 1004 | 3.676309% |
| B | 27314 | 570 | 2.086842% |
| C | 27313 | 315 | 1.153297% |
| D | 27306 | 5895 | 21.588662% |
Noise dominated data is calculated using 1-second bins in cleaned event files. If a bin has >2000 counts, and if more than 50% of those come from <1% of pixels, then it is considered to be noise-dominated and hence unusable.
| Quadrant | # 1 sec bins | Bins with >0 counts | Bins with >2000 counts | High rate bins dominated by noise | Noise dominated (total time) | Noise dominated (detector-on time) | Marked lightcurve |
|---|---|---|---|---|---|---|---|
| A | 28735 | 27313 | 0 | 0 | 0.00% | 0.00% |  |
| B | 28735 | 27315 | 0 | 0 | 0.00% | 0.00% |  |
| C | 28734 | 27313 | 0 | 0 | 0.00% | 0.00% |  |
| D | 28735 | 27206 | 0 | 0 | 0.00% | 0.00% |  |
Top three noisy pixels from each quadrant. If the there are fewer than three noisy pixels in the level2.evt file, extra rows are filled as -1
| Pixel properties | Quadrant properties | ||||||
|---|---|---|---|---|---|---|---|
| Quadrant | DetID | PixID | Counts | Sigma | Mean | Median | Sigma |
| A | 7 | 110 | 1128 | 8.42 | 359 | 335 | 94.2 |
| A | 0 | 29 | 1092 | 8.04 | 359 | 335 | 94.2 |
| A | 0 | 30 | 1029 | 7.37 | 359 | 335 | 94.2 |
| B | 2 | 9 | 1255 | 12.42 | 359 | 341 | 73.6 |
| B | 2 | 8 | 1042 | 9.52 | 359 | 341 | 73.6 |
| B | 3 | 17 | 982 | 8.71 | 359 | 341 | 73.6 |
| C | 1 | 81 | 1070 | 7.32 | 373 | 345 | 99.0 |
| C | 3 | 202 | 1068 | 7.3 | 373 | 345 | 99.0 |
| C | 3 | 158 | 1048 | 7.1 | 373 | 345 | 99.0 |
| D | 3 | 159 | 798 | 5.98 | 308 | 278 | 87.0 |
| D | 12 | 6 | 795 | 5.94 | 308 | 278 | 87.0 |
| D | 6 | 38 | 789 | 5.87 | 308 | 278 | 87.0 |
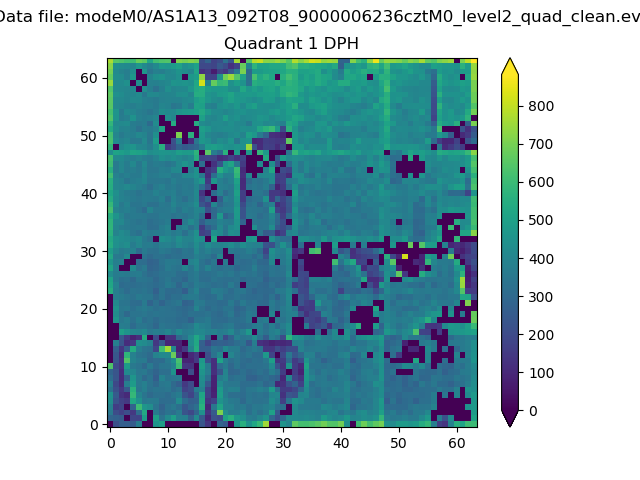
Histogram calculated using DETX and DETY for each event in the final _common_clean file
| Quadrant A |  |
 |
Quadrant B |
|---|---|---|---|
| Quadrant D |  |
 |
Quadrant C |
| Plot type | Count rate plots | Images |
|---|---|---|
| Comparison with Poisson distribution Blue bars denote a histogram of data divided into 1 sec bins. Red curve is a Poisson curve with rate = median count rate of data. |
 |
 |
| Quadrant-wise count rates Data is divided into 100 sec bins |
 |
|
| Module-wise count rates for Quadrant A Data is divided into 100 sec bins |
 |
 |
| Module-wise count rates for Quadrant B Data is divided into 100 sec bins |
 |
 |
| Module-wise count rates for Quadrant C Data is divided into 100 sec bins |
 |
 |
| Module-wise count rates for Quadrant D Data is divided into 100 sec bins |
 |
 |
| Parameter | Plot |
|---|---|
| CZT HV Monitor |  |
| D_VDD |  |
| Temperature 1 |  |
| Veto HV Monitor |  |
| Veto LLD |  |
| Alpha Counter |  |
| _CPM_Rate |  |
| CZT Counter |  |
| +2.5 Volts monitor |  |
| +5 Volts monitor |  |
| _ROLL_ROT |  |
| _Roll_DEC |  |
| _Roll_RA |  |
| Veto Counter |  |