| Param | Original file | Final file |
|---|---|---|
| Filename | modeM0/AS1A13_092T09_9000006238cztM0_level2.fits | modeM0/AS1A13_092T09_9000006238cztM0_level2_quad_clean.evt |
| Size (bytes) | 355,887,360 | 339,894,720 |
| Size | 339.4 MB | 324.1 MB |
| Events in quadrant A | 2,013,898 | 1,935,514 |
| Events in quadrant B | 2,027,636 | 1,975,893 |
| Events in quadrant C | 2,128,884 | 1,899,204 |
| Events in quadrant D | 1,690,502 | 1,570,137 |
| Mode SS | |||
|---|---|---|---|
| Quadrant | BADHDUFLAG | Total packets | Discarded packets |
| A | 0 | 862 | 0 |
| B | 0 | 862 | 0 |
| C | 0 | 862 | 0 |
| D | 0 | 862 | 0 |
| Mode M9 | |||
|---|---|---|---|
| Quadrant | BADHDUFLAG | Total packets | Discarded packets |
| A | 0 | 69 | 0 |
| B | 0 | 69 | 0 |
| C | 0 | 69 | 0 |
| D | 0 | 69 | 0 |
| Mode M0 | |||
|---|---|---|---|
| Quadrant | BADHDUFLAG | Total packets | Discarded packets |
| A | 0 | 158916 | 0 |
| B | 0 | 106821 | 0 |
| C | 0 | 93470 | 0 |
| D | 0 | 143980 | 0 |
| Quadrant | Total seconds | Saturated seconds | Saturation percentage |
|---|---|---|---|
| A | 42406 | 3897 | 9.189737% |
| B | 42406 | 2226 | 5.249257% |
| C | 42406 | 749 | 1.766259% |
| D | 42404 | 5231 | 12.336100% |
Noise dominated data is calculated using 1-second bins in cleaned event files. If a bin has >2000 counts, and if more than 50% of those come from <1% of pixels, then it is considered to be noise-dominated and hence unusable.
| Quadrant | # 1 sec bins | Bins with >0 counts | Bins with >2000 counts | High rate bins dominated by noise | Noise dominated (total time) | Noise dominated (detector-on time) | Marked lightcurve |
|---|---|---|---|---|---|---|---|
| A | 49311 | 41277 | 0 | 0 | 0.00% | 0.00% |  |
| B | 49311 | 41777 | 0 | 0 | 0.00% | 0.00% |  |
| C | 49311 | 42168 | 0 | 0 | 0.00% | 0.00% | 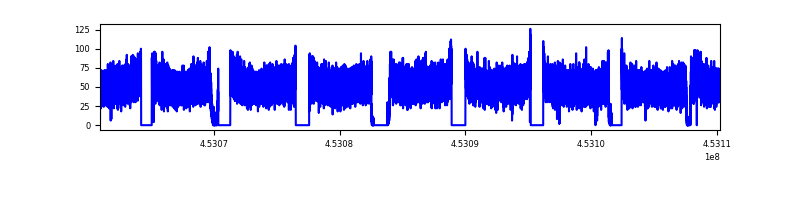 |
| D | 49311 | 41389 | 0 | 0 | 0.00% | 0.00% | 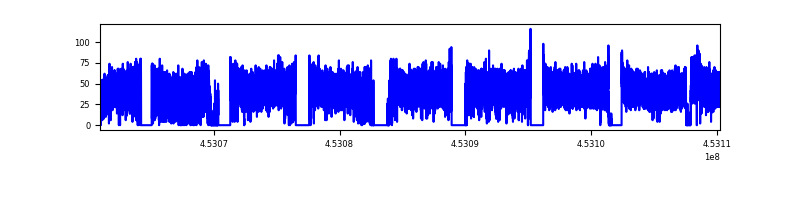 |
Top three noisy pixels from each quadrant. If the there are fewer than three noisy pixels in the level2.evt file, extra rows are filled as -1
| Pixel properties | Quadrant properties | ||||||
|---|---|---|---|---|---|---|---|
| Quadrant | DetID | PixID | Counts | Sigma | Mean | Median | Sigma |
| A | 14 | 188 | 2381 | 13.88 | 525 | 490 | 136.2 |
| A | 14 | 204 | 1920 | 10.5 | 525 | 490 | 136.2 |
| A | 7 | 110 | 1634 | 8.4 | 525 | 490 | 136.2 |
| B | 2 | 9 | 1941 | 13.33 | 535 | 509 | 107.4 |
| B | 3 | 17 | 1551 | 9.7 | 535 | 509 | 107.4 |
| B | 2 | 8 | 1497 | 9.2 | 535 | 509 | 107.4 |
| C | 3 | 202 | 1657 | 7.69 | 561 | 519 | 148.0 |
| C | 7 | 221 | 1632 | 7.52 | 561 | 519 | 148.0 |
| C | 3 | 203 | 1590 | 7.24 | 561 | 519 | 148.0 |
| D | 7 | 3 | 1251 | 5.99 | 486 | 441 | 135.2 |
| D | 12 | 6 | 1249 | 5.98 | 486 | 441 | 135.2 |
| D | 3 | 14 | 1240 | 5.91 | 486 | 441 | 135.2 |
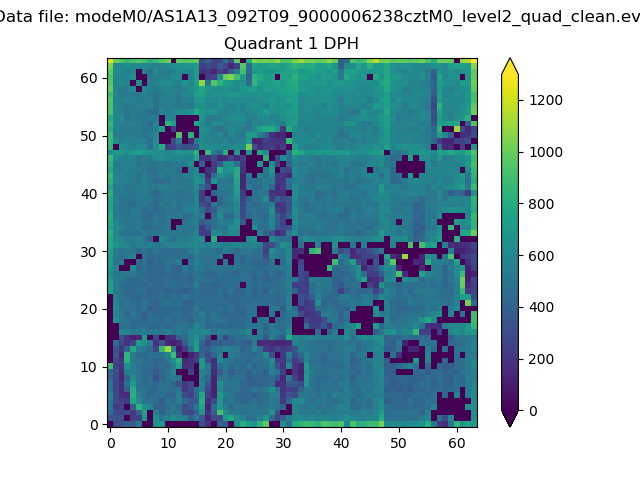
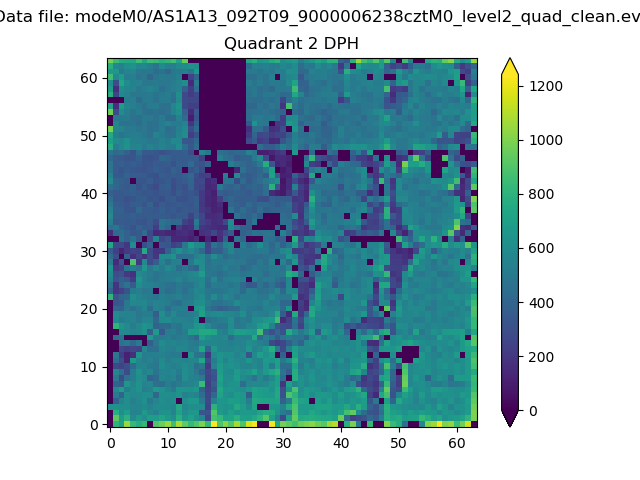
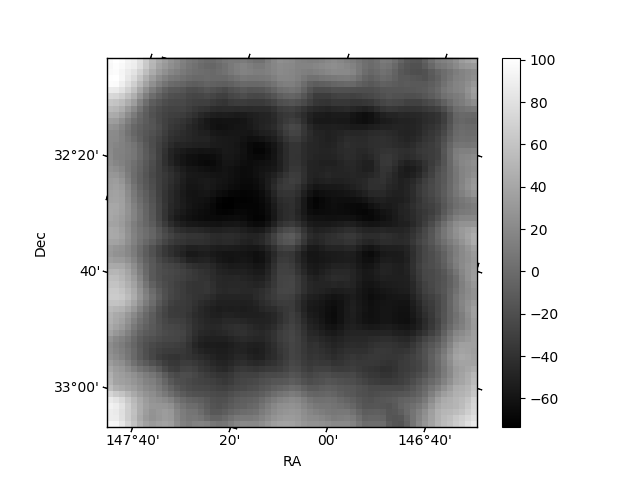
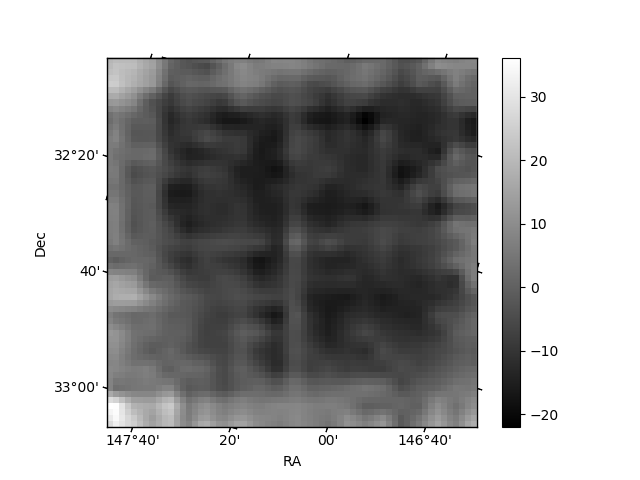
Histogram calculated using DETX and DETY for each event in the final _common_clean file
| Quadrant A |  |
 |
Quadrant B |
|---|---|---|---|
| Quadrant D |  |
 |
Quadrant C |
| Plot type | Count rate plots | Images |
|---|---|---|
| Comparison with Poisson distribution Blue bars denote a histogram of data divided into 1 sec bins. Red curve is a Poisson curve with rate = median count rate of data. |
 |
 |
| Quadrant-wise count rates Data is divided into 100 sec bins |
 |
|
| Module-wise count rates for Quadrant A Data is divided into 100 sec bins |
 |
 |
| Module-wise count rates for Quadrant B Data is divided into 100 sec bins |
 |
 |
| Module-wise count rates for Quadrant C Data is divided into 100 sec bins |
 |
 |
| Module-wise count rates for Quadrant D Data is divided into 100 sec bins |
 |
 |
| Parameter | Plot |
|---|---|
| CZT HV Monitor |  |
| D_VDD | 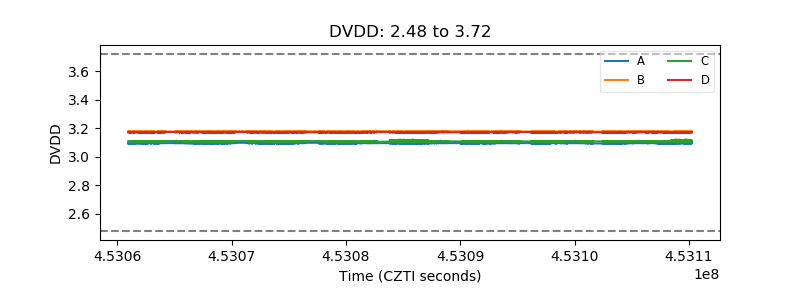 |
| Temperature 1 |  |
| Veto HV Monitor |  |
| Veto LLD |  |
| Alpha Counter | 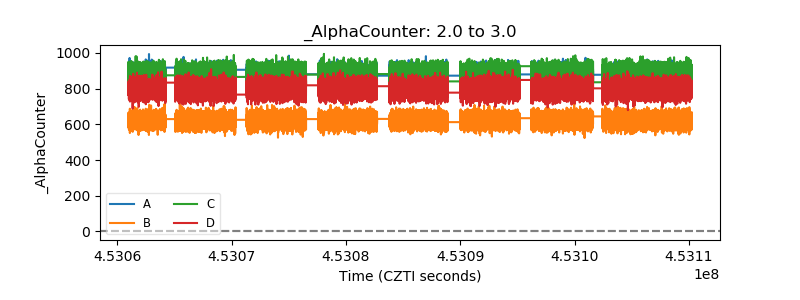 |
| _CPM_Rate | 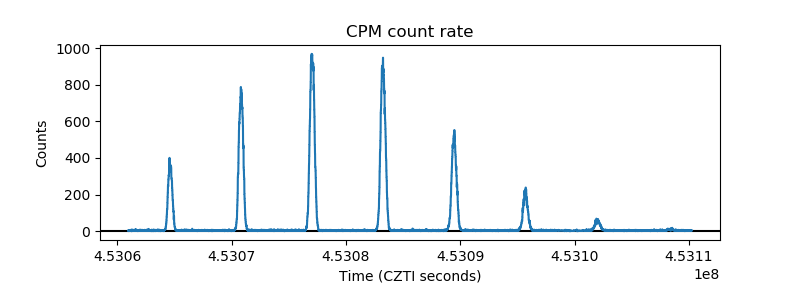 |
| CZT Counter |  |
| +2.5 Volts monitor |  |
| +5 Volts monitor |  |
| _ROLL_ROT | 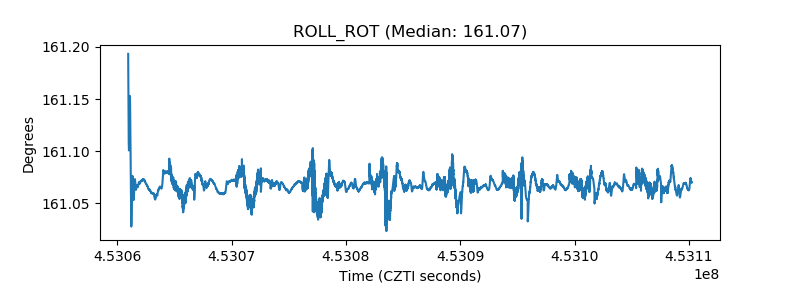 |
| _Roll_DEC | 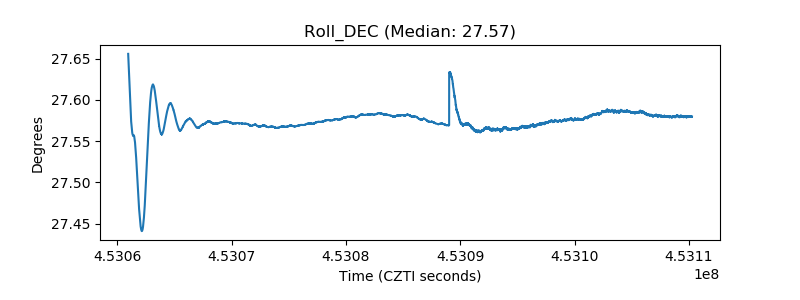 |
| _Roll_RA |  |
| Veto Counter |  |