| Param | Original file | Final file |
|---|---|---|
| Filename | modeM0/AS1A13_080T02_9000006242cztM0_level2.fits | modeM0/AS1A13_080T02_9000006242cztM0_level2_quad_clean.evt |
| Size (bytes) | 482,826,240 | 747,613,440 |
| Size | 460.5 MB | 713.0 MB |
| Events in quadrant A | 2,795,044 | 4,940,209 |
| Events in quadrant B | 2,704,560 | 4,834,080 |
| Events in quadrant C | 2,854,266 | 4,782,450 |
| Events in quadrant D | 2,341,710 | 4,165,447 |
| Mode SS | |||
|---|---|---|---|
| Quadrant | BADHDUFLAG | Total packets | Discarded packets |
| A | 0 | 1154 | 0 |
| B | 0 | 1154 | 0 |
| C | 0 | 1154 | 0 |
| D | 0 | 1154 | 0 |
| Mode M0 | |||
|---|---|---|---|
| Quadrant | BADHDUFLAG | Total packets | Discarded packets |
| A | 0 | 191563 | 0 |
| B | 0 | 139731 | 0 |
| C | 0 | 121827 | 0 |
| D | 0 | 170427 | 0 |
| Mode M9 | |||
|---|---|---|---|
| Quadrant | BADHDUFLAG | Total packets | Discarded packets |
| A | 0 | 66 | 0 |
| B | 0 | 66 | 0 |
| C | 0 | 68 | 0 |
| D | 0 | 68 | 0 |
| Quadrant | Total seconds | Saturated seconds | Saturation percentage |
|---|---|---|---|
| A | 57179 | 1908 | 3.336889% |
| B | 57181 | 2860 | 5.001661% |
| C | 57181 | 703 | 1.229429% |
| D | 57180 | 4700 | 8.219657% |
Noise dominated data is calculated using 1-second bins in cleaned event files. If a bin has >2000 counts, and if more than 50% of those come from <1% of pixels, then it is considered to be noise-dominated and hence unusable.
| Quadrant | # 1 sec bins | Bins with >0 counts | Bins with >2000 counts | High rate bins dominated by noise | Noise dominated (total time) | Noise dominated (detector-on time) | Marked lightcurve |
|---|---|---|---|---|---|---|---|
| A | 82072 | 57163 | 0 | 0 | 0.00% | 0.00% |  |
| B | 82072 | 57104 | 0 | 0 | 0.00% | 0.00% |  |
| C | 82072 | 57178 | 0 | 0 | 0.00% | 0.00% |  |
| D | 82072 | 57096 | 0 | 0 | 0.00% | 0.00% |  |
Top three noisy pixels from each quadrant. If the there are fewer than three noisy pixels in the level2.evt file, extra rows are filled as -1
| Pixel properties | Quadrant properties | ||||||
|---|---|---|---|---|---|---|---|
| Quadrant | DetID | PixID | Counts | Sigma | Mean | Median | Sigma |
| A | 7 | 110 | 2338 | 8.69 | 729 | 684 | 190.3 |
| A | 14 | 95 | 2164 | 7.78 | 729 | 684 | 190.3 |
| A | 0 | 29 | 2122 | 7.56 | 729 | 684 | 190.3 |
| B | 2 | 9 | 2534 | 12.85 | 715 | 682 | 144.1 |
| B | 2 | 8 | 2091 | 9.78 | 715 | 682 | 144.1 |
| B | 3 | 17 | 1967 | 8.92 | 715 | 682 | 144.1 |
| C | 1 | 81 | 2274 | 8.02 | 753 | 703 | 195.8 |
| C | 3 | 202 | 2269 | 8.0 | 753 | 703 | 195.8 |
| C | 1 | 80 | 2157 | 7.43 | 753 | 703 | 195.8 |
| D | 10 | 189 | 1833 | 6.52 | 672 | 611 | 187.5 |
| D | 15 | 47 | 1779 | 6.23 | 672 | 611 | 187.5 |
| D | 15 | 63 | 1745 | 6.05 | 672 | 611 | 187.5 |
Histogram calculated using DETX and DETY for each event in the final _common_clean file
| Quadrant A | 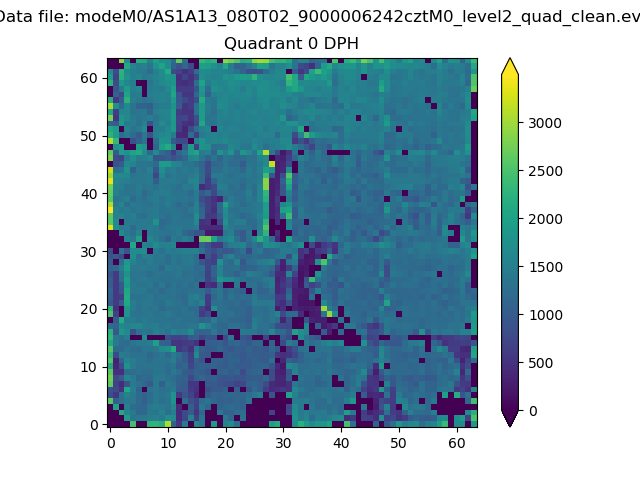 |
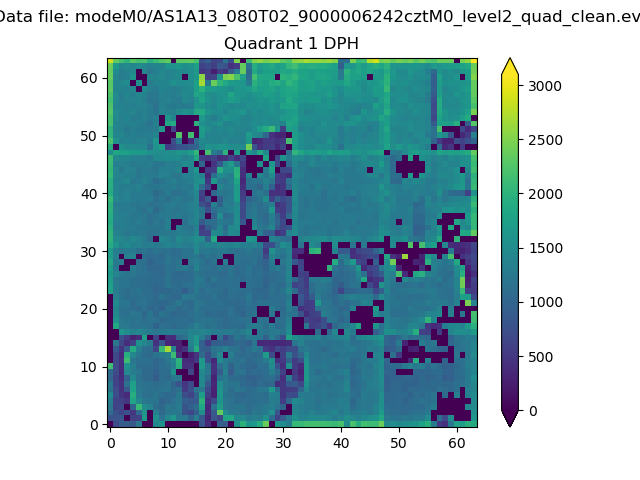 |
Quadrant B |
|---|---|---|---|
| Quadrant D | 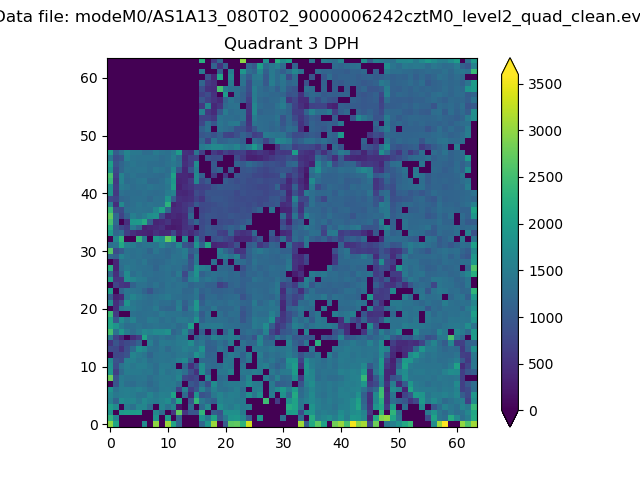 |
 |
Quadrant C |
| Plot type | Count rate plots | Images |
|---|---|---|
| Comparison with Poisson distribution Blue bars denote a histogram of data divided into 1 sec bins. Red curve is a Poisson curve with rate = median count rate of data. |
 |
 |
| Quadrant-wise count rates Data is divided into 100 sec bins |
 |
|
| Module-wise count rates for Quadrant A Data is divided into 100 sec bins |
 |
 |
| Module-wise count rates for Quadrant B Data is divided into 100 sec bins |
 |
 |
| Module-wise count rates for Quadrant C Data is divided into 100 sec bins |
 |
 |
| Module-wise count rates for Quadrant D Data is divided into 100 sec bins |
 |
 |
| Parameter | Plot |
|---|---|
| CZT HV Monitor |  |
| D_VDD | 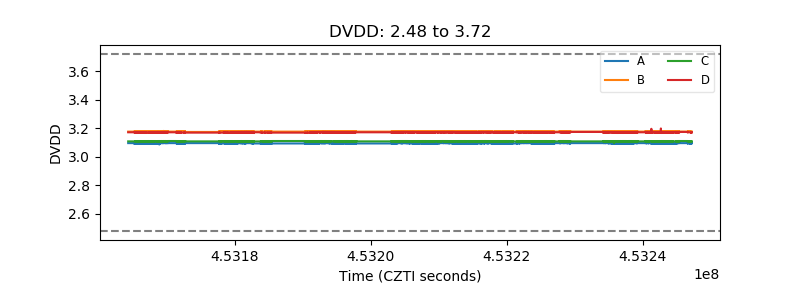 |
| Temperature 1 |  |
| Veto HV Monitor |  |
| Veto LLD |  |
| Alpha Counter |  |
| _CPM_Rate |  |
| CZT Counter |  |
| +2.5 Volts monitor |  |
| +5 Volts monitor |  |
| _ROLL_ROT |  |
| _Roll_DEC |  |
| _Roll_RA |  |
| Veto Counter |  |