| Param | Original file | Final file |
|---|---|---|
| Filename | modeM0/AS1A13_039T01_9000006246cztM0_level2.fits | modeM0/AS1A13_039T01_9000006246cztM0_level2_quad_clean.evt |
| Size (bytes) | 816,497,280 | 1,251,601,920 |
| Size | 778.7 MB | 1.2 GB |
| Events in quadrant A | 4,701,170 | 8,053,140 |
| Events in quadrant B | 4,630,742 | 8,258,009 |
| Events in quadrant C | 4,820,754 | 7,998,193 |
| Events in quadrant D | 4,013,072 | 7,043,862 |
| Mode M0 | |||
|---|---|---|---|
| Quadrant | BADHDUFLAG | Total packets | Discarded packets |
| A | 0 | 329390 | 0 |
| B | 0 | 223302 | 0 |
| C | 0 | 204637 | 0 |
| D | 0 | 261903 | 0 |
| Mode SS | |||
|---|---|---|---|
| Quadrant | BADHDUFLAG | Total packets | Discarded packets |
| A | 0 | 1944 | 0 |
| B | 0 | 1944 | 0 |
| C | 0 | 1944 | 0 |
| D | 0 | 1944 | 0 |
| Mode M9 | |||
|---|---|---|---|
| Quadrant | BADHDUFLAG | Total packets | Discarded packets |
| A | 0 | 134 | 0 |
| B | 0 | 134 | 0 |
| C | 0 | 134 | 0 |
| D | 0 | 134 | 0 |
| Quadrant | Total seconds | Saturated seconds | Saturation percentage |
|---|---|---|---|
| A | 95655 | 2794 | 2.920914% |
| B | 95667 | 2004 | 2.094766% |
| C | 95668 | 1040 | 1.087093% |
| D | 95668 | 4423 | 4.623281% |
Noise dominated data is calculated using 1-second bins in cleaned event files. If a bin has >2000 counts, and if more than 50% of those come from <1% of pixels, then it is considered to be noise-dominated and hence unusable.
| Quadrant | # 1 sec bins | Bins with >0 counts | Bins with >2000 counts | High rate bins dominated by noise | Noise dominated (total time) | Noise dominated (detector-on time) | Marked lightcurve |
|---|---|---|---|---|---|---|---|
| A | 114283 | 95696 | 0 | 0 | 0.00% | 0.00% |  |
| B | 114283 | 95665 | 0 | 0 | 0.00% | 0.00% |  |
| C | 114283 | 95692 | 0 | 0 | 0.00% | 0.00% |  |
| D | 114283 | 95588 | 0 | 0 | 0.00% | 0.00% |  |
Top three noisy pixels from each quadrant. If the there are fewer than three noisy pixels in the level2.evt file, extra rows are filled as -1
| Pixel properties | Quadrant properties | ||||||
|---|---|---|---|---|---|---|---|
| Quadrant | DetID | PixID | Counts | Sigma | Mean | Median | Sigma |
| A | 7 | 110 | 3827 | 8.42 | 1229 | 1152 | 317.7 |
| A | 0 | 29 | 3708 | 8.04 | 1229 | 1152 | 317.7 |
| A | 14 | 95 | 3637 | 7.82 | 1229 | 1152 | 317.7 |
| B | 2 | 9 | 4357 | 13.27 | 1227 | 1172 | 240.1 |
| B | 2 | 8 | 3636 | 10.26 | 1227 | 1172 | 240.1 |
| B | 3 | 17 | 3412 | 9.33 | 1227 | 1172 | 240.1 |
| C | 3 | 202 | 3888 | 8.06 | 1276 | 1187 | 335.3 |
| C | 3 | 203 | 3756 | 7.66 | 1276 | 1187 | 335.3 |
| C | 1 | 81 | 3677 | 7.43 | 1276 | 1187 | 335.3 |
| D | 10 | 189 | 3099 | 6.46 | 1152 | 1044 | 318.2 |
| D | 6 | 38 | 2960 | 6.02 | 1152 | 1044 | 318.2 |
| D | 4 | 16 | 2927 | 5.92 | 1152 | 1044 | 318.2 |
Histogram calculated using DETX and DETY for each event in the final _common_clean file
| Quadrant A | 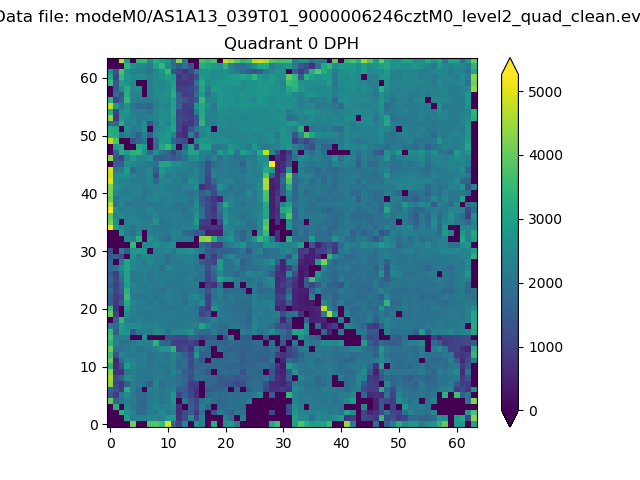 |
 |
Quadrant B |
|---|---|---|---|
| Quadrant D | 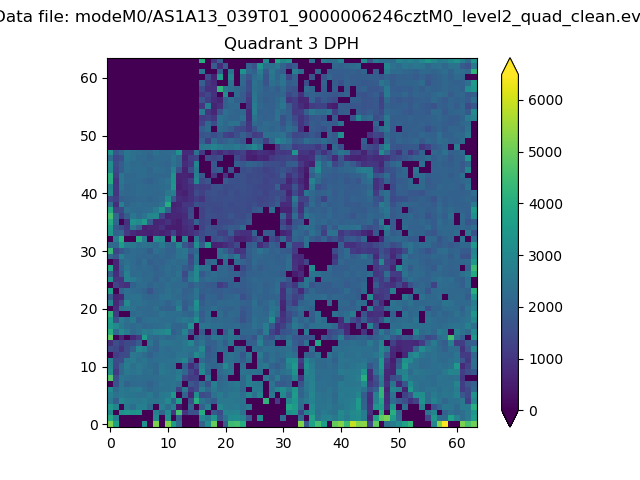 |
 |
Quadrant C |
| Plot type | Count rate plots | Images |
|---|---|---|
| Comparison with Poisson distribution Blue bars denote a histogram of data divided into 1 sec bins. Red curve is a Poisson curve with rate = median count rate of data. |
 |
 |
| Quadrant-wise count rates Data is divided into 100 sec bins |
 |
|
| Module-wise count rates for Quadrant A Data is divided into 100 sec bins |
 |
 |
| Module-wise count rates for Quadrant B Data is divided into 100 sec bins |
 |
 |
| Module-wise count rates for Quadrant C Data is divided into 100 sec bins |
 |
 |
| Module-wise count rates for Quadrant D Data is divided into 100 sec bins |
 |
 |
| Parameter | Plot |
|---|---|
| CZT HV Monitor |  |
| D_VDD | 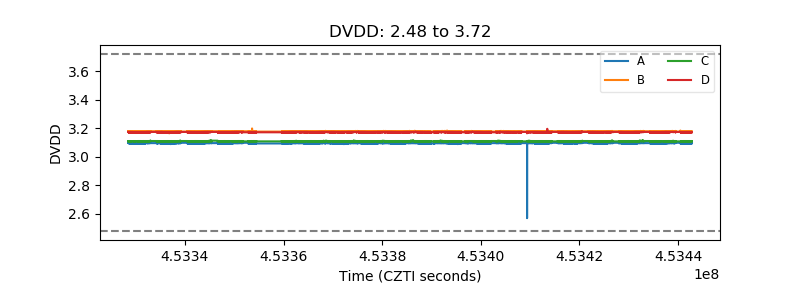 |
| Temperature 1 |  |
| Veto HV Monitor |  |
| Veto LLD |  |
| Alpha Counter |  |
| _CPM_Rate |  |
| CZT Counter |  |
| +2.5 Volts monitor |  |
| +5 Volts monitor |  |
| _ROLL_ROT |  |
| _Roll_DEC |  |
| _Roll_RA |  |
| Veto Counter |  |