| Param | Original file | Final file |
|---|---|---|
| Filename | modeM0/AS1A13_092T16_9000006250cztM0_level2.fits | modeM0/AS1A13_092T16_9000006250cztM0_level2_quad_clean.evt |
| Size (bytes) | 44,075,520 | 34,041,600 |
| Size | 42.0 MB | 32.5 MB |
| Events in quadrant A | 251,454 | 173,578 |
| Events in quadrant B | 250,350 | 176,904 |
| Events in quadrant C | 263,084 | 177,067 |
| Events in quadrant D | 222,042 | 154,613 |
| Mode M9 | |||
|---|---|---|---|
| Quadrant | BADHDUFLAG | Total packets | Discarded packets |
| A | 0 | 12 | 0 |
| B | 0 | 12 | 0 |
| C | 0 | 12 | 0 |
| D | 0 | 12 | 0 |
| Mode SS | |||
|---|---|---|---|
| Quadrant | BADHDUFLAG | Total packets | Discarded packets |
| A | 0 | 100 | 0 |
| B | 0 | 100 | 0 |
| C | 0 | 100 | 0 |
| D | 0 | 100 | 0 |
| Mode M0 | |||
|---|---|---|---|
| Quadrant | BADHDUFLAG | Total packets | Discarded packets |
| A | 0 | 18166 | 0 |
| B | 0 | 13806 | 0 |
| C | 0 | 10240 | 0 |
| D | 0 | 12855 | 0 |
| Quadrant | Total seconds | Saturated seconds | Saturation percentage |
|---|---|---|---|
| A | 4961 | 312 | 6.289055% |
| B | 4961 | 319 | 6.430155% |
| C | 4961 | 13 | 0.262044% |
| D | 4961 | 150 | 3.023584% |
Noise dominated data is calculated using 1-second bins in cleaned event files. If a bin has >2000 counts, and if more than 50% of those come from <1% of pixels, then it is considered to be noise-dominated and hence unusable.
| Quadrant | # 1 sec bins | Bins with >0 counts | Bins with >2000 counts | High rate bins dominated by noise | Noise dominated (total time) | Noise dominated (detector-on time) | Marked lightcurve |
|---|---|---|---|---|---|---|---|
| A | 6141 | 4961 | 0 | 0 | 0.00% | 0.00% | 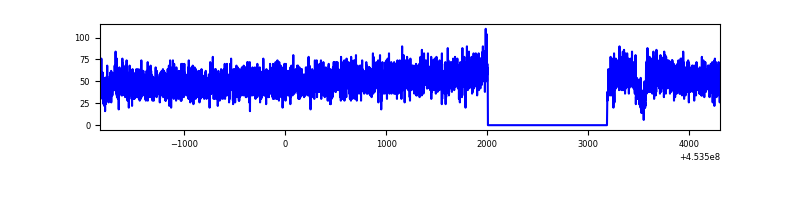 |
| B | 6141 | 4961 | 0 | 0 | 0.00% | 0.00% |  |
| C | 6141 | 4961 | 0 | 0 | 0.00% | 0.00% |  |
| D | 6141 | 4961 | 0 | 0 | 0.00% | 0.00% | 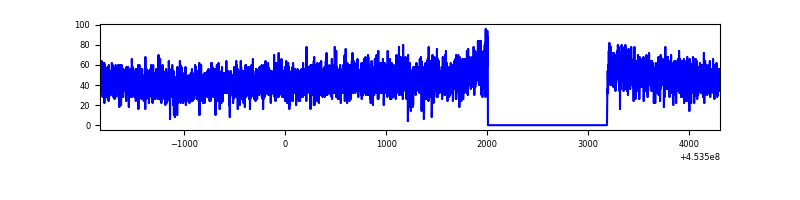 |
Top three noisy pixels from each quadrant. If the there are fewer than three noisy pixels in the level2.evt file, extra rows are filled as -1
| Pixel properties | Quadrant properties | ||||||
|---|---|---|---|---|---|---|---|
| Quadrant | DetID | PixID | Counts | Sigma | Mean | Median | Sigma |
| A | 7 | 110 | 206 | 7.74 | 65 | 62 | 18.6 |
| A | 9 | 239 | 192 | 6.98 | 65 | 62 | 18.6 |
| A | 12 | 254 | 189 | 6.82 | 65 | 62 | 18.6 |
| B | 2 | 9 | 235 | 11.12 | 66 | 63 | 15.5 |
| B | 2 | 8 | 188 | 8.08 | 66 | 63 | 15.5 |
| B | 2 | 245 | 184 | 7.82 | 66 | 63 | 15.5 |
| C | 1 | 80 | 195 | 6.58 | 69 | 64 | 19.9 |
| C | 3 | 203 | 189 | 6.28 | 69 | 64 | 19.9 |
| C | 3 | 202 | 185 | 6.08 | 69 | 64 | 19.9 |
| D | 10 | 189 | 182 | 6.5 | 63 | 58 | 19.1 |
| D | 7 | 3 | 181 | 6.45 | 63 | 58 | 19.1 |
| D | 15 | 47 | 169 | 5.82 | 63 | 58 | 19.1 |
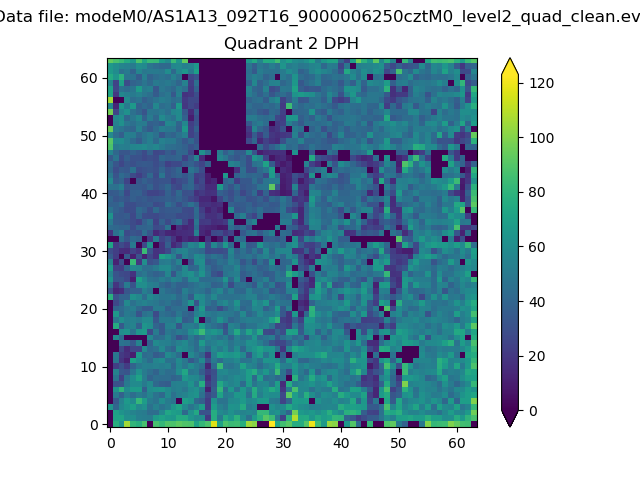
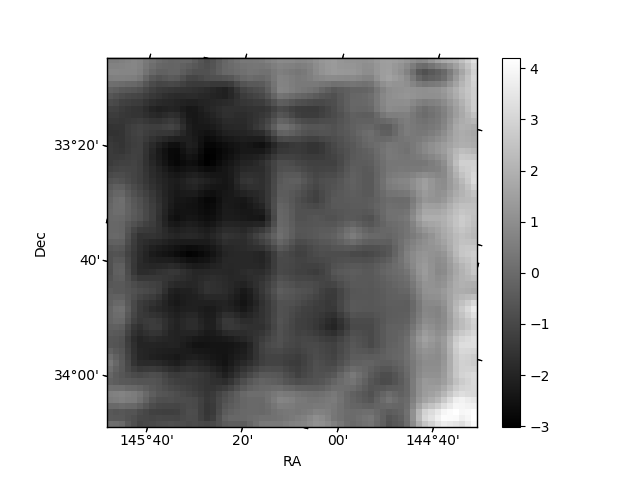
Histogram calculated using DETX and DETY for each event in the final _common_clean file
| Quadrant A | 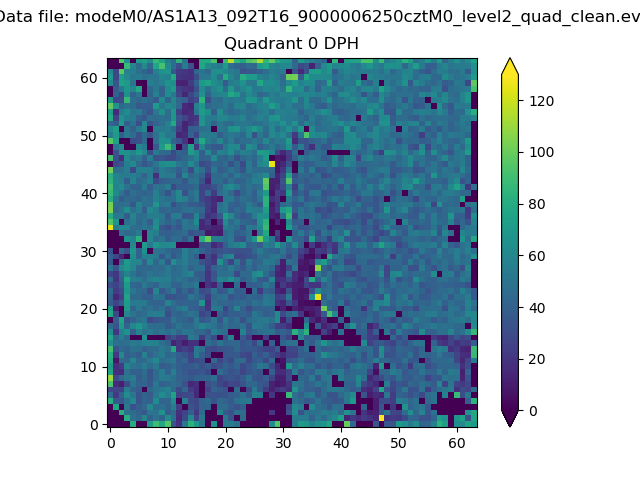 |
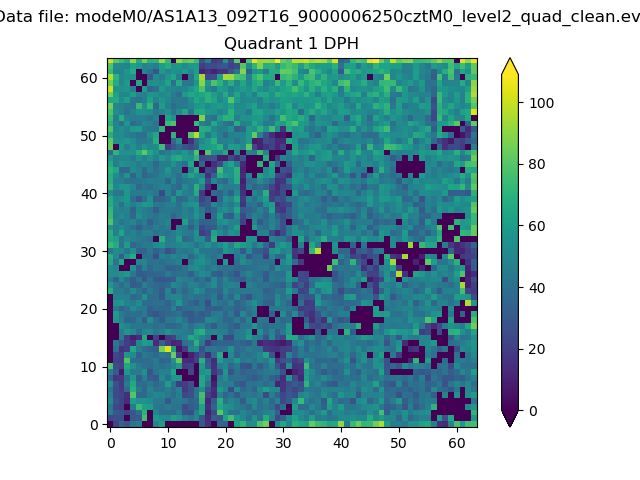 |
Quadrant B |
|---|---|---|---|
| Quadrant D |  |
 |
Quadrant C |
| Plot type | Count rate plots | Images |
|---|---|---|
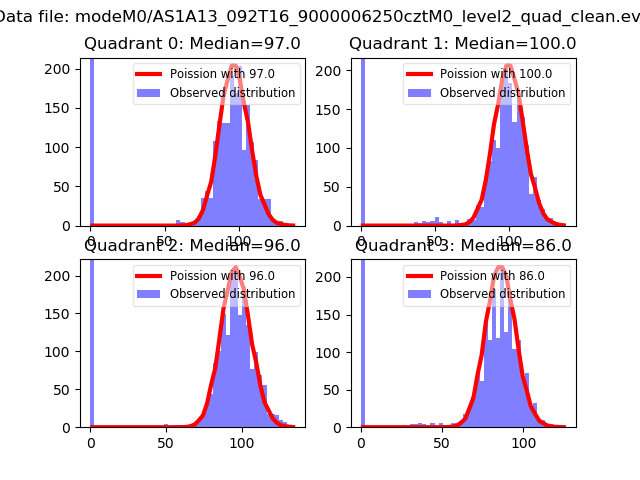
| Comparison with Poisson distribution Blue bars denote a histogram of data divided into 1 sec bins. Red curve is a Poisson curve with rate = median count rate of data. |
 |
 |
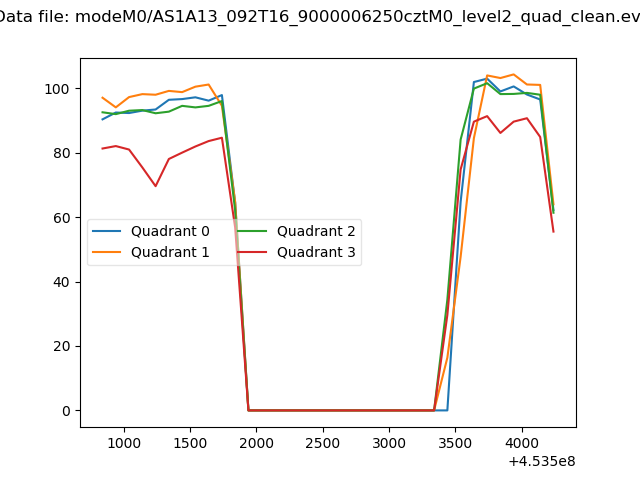
| Quadrant-wise count rates Data is divided into 100 sec bins |
 |
|
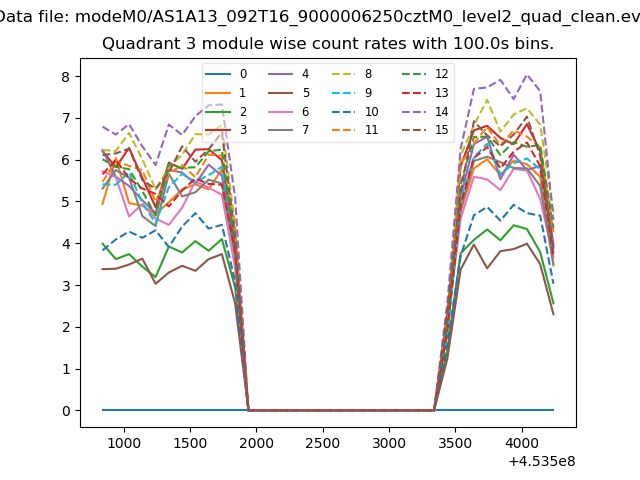
| Module-wise count rates for Quadrant A Data is divided into 100 sec bins |
 |
 |
| Module-wise count rates for Quadrant B Data is divided into 100 sec bins |
 |
 |
| Module-wise count rates for Quadrant C Data is divided into 100 sec bins |
 |
 |
| Module-wise count rates for Quadrant D Data is divided into 100 sec bins |
 |
 |
| Parameter | Plot |
|---|---|
| CZT HV Monitor |  |
| D_VDD |  |
| Temperature 1 |  |
| Veto HV Monitor |  |
| Veto LLD | 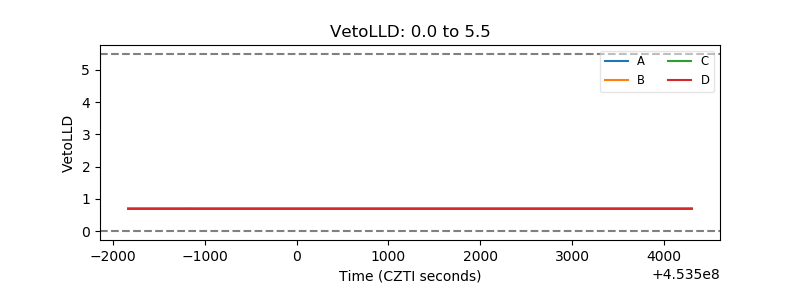 |
| Alpha Counter | 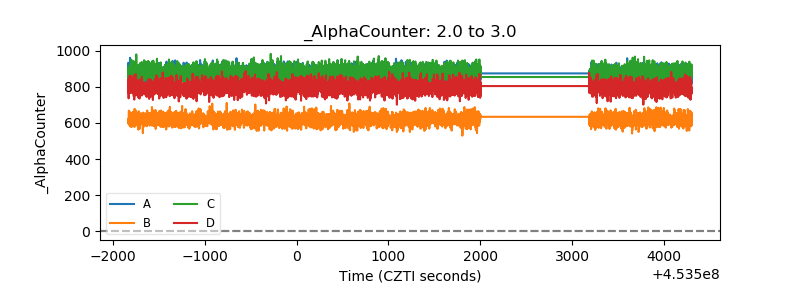 |
| _CPM_Rate | 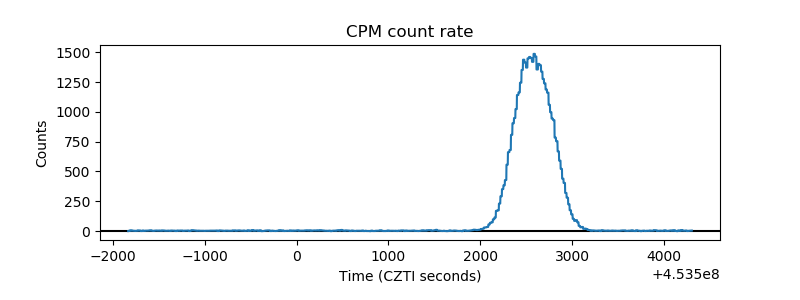 |
| CZT Counter |  |
| +2.5 Volts monitor |  |
| +5 Volts monitor |  |
| _ROLL_ROT | 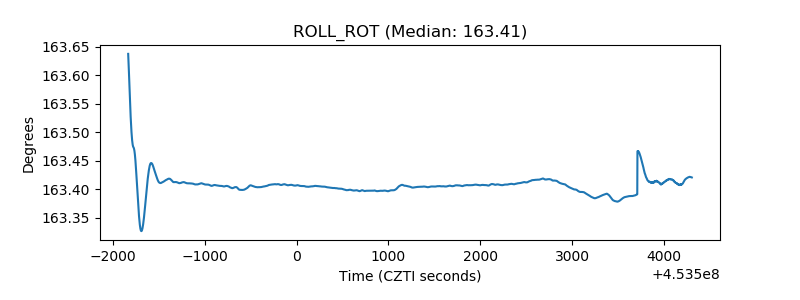 |
| _Roll_DEC |  |
| _Roll_RA |  |
| Veto Counter |  |