| Param | Original file | Final file |
|---|---|---|
| Filename | modeM0/AS1A13_092T18_9000006248cztM0_level2.fits | modeM0/AS1A13_092T18_9000006248cztM0_level2_quad_clean.evt |
| Size (bytes) | 400,155,840 | 430,758,720 |
| Size | 381.6 MB | 410.8 MB |
| Events in quadrant A | 2,311,088 | 2,565,869 |
| Events in quadrant B | 2,247,598 | 2,599,991 |
| Events in quadrant C | 2,366,790 | 2,545,942 |
| Events in quadrant D | 1,932,310 | 2,075,769 |
| Mode SS | |||
|---|---|---|---|
| Quadrant | BADHDUFLAG | Total packets | Discarded packets |
| A | 0 | 962 | 0 |
| B | 0 | 962 | 0 |
| C | 0 | 962 | 0 |
| D | 0 | 962 | 0 |
| Mode M0 | |||
|---|---|---|---|
| Quadrant | BADHDUFLAG | Total packets | Discarded packets |
| A | 0 | 165367 | 0 |
| B | 0 | 120831 | 0 |
| C | 0 | 98783 | 0 |
| D | 0 | 155647 | 0 |
| Mode M9 | |||
|---|---|---|---|
| Quadrant | BADHDUFLAG | Total packets | Discarded packets |
| A | 0 | 43 | 0 |
| B | 0 | 43 | 0 |
| C | 0 | 43 | 0 |
| D | 0 | 43 | 0 |
| Quadrant | Total seconds | Saturated seconds | Saturation percentage |
|---|---|---|---|
| A | 47456 | 1808 | 3.809845% |
| B | 47456 | 1864 | 3.927849% |
| C | 47456 | 352 | 0.741740% |
| D | 47457 | 4530 | 9.545483% |
Noise dominated data is calculated using 1-second bins in cleaned event files. If a bin has >2000 counts, and if more than 50% of those come from <1% of pixels, then it is considered to be noise-dominated and hence unusable.
| Quadrant | # 1 sec bins | Bins with >0 counts | Bins with >2000 counts | High rate bins dominated by noise | Noise dominated (total time) | Noise dominated (detector-on time) | Marked lightcurve |
|---|---|---|---|---|---|---|---|
| A | 51821 | 47454 | 0 | 0 | 0.00% | 0.00% |  |
| B | 51821 | 47454 | 0 | 0 | 0.00% | 0.00% |  |
| C | 51821 | 47456 | 0 | 0 | 0.00% | 0.00% |  |
| D | 51822 | 47290 | 0 | 0 | 0.00% | 0.00% |  |
Top three noisy pixels from each quadrant. If the there are fewer than three noisy pixels in the level2.evt file, extra rows are filled as -1
| Pixel properties | Quadrant properties | ||||||
|---|---|---|---|---|---|---|---|
| Quadrant | DetID | PixID | Counts | Sigma | Mean | Median | Sigma |
| A | 7 | 110 | 1868 | 8.2 | 603 | 561 | 159.3 |
| A | 0 | 29 | 1796 | 7.75 | 603 | 561 | 159.3 |
| A | 14 | 95 | 1736 | 7.37 | 603 | 561 | 159.3 |
| B | 2 | 9 | 2182 | 13.56 | 595 | 565 | 119.3 |
| B | 2 | 8 | 1748 | 9.92 | 595 | 565 | 119.3 |
| B | 3 | 17 | 1634 | 8.96 | 595 | 565 | 119.3 |
| C | 1 | 81 | 1831 | 7.53 | 626 | 579 | 166.4 |
| C | 3 | 202 | 1771 | 7.16 | 626 | 579 | 166.4 |
| C | 1 | 80 | 1766 | 7.13 | 626 | 579 | 166.4 |
| D | 7 | 3 | 1408 | 5.88 | 554 | 502 | 154.1 |
| D | 3 | 31 | 1391 | 5.77 | 554 | 502 | 154.1 |
| D | 10 | 189 | 1387 | 5.74 | 554 | 502 | 154.1 |
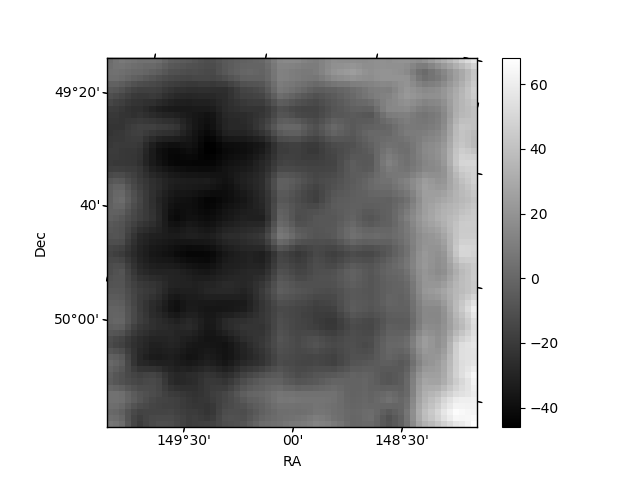
Histogram calculated using DETX and DETY for each event in the final _common_clean file
| Quadrant A | 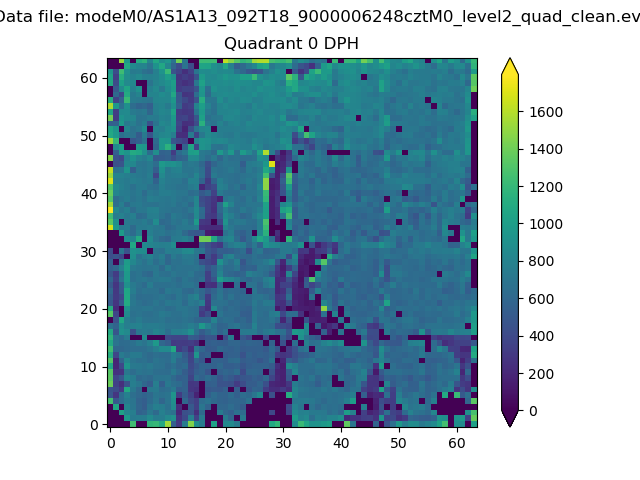 |
 |
Quadrant B |
|---|---|---|---|
| Quadrant D | 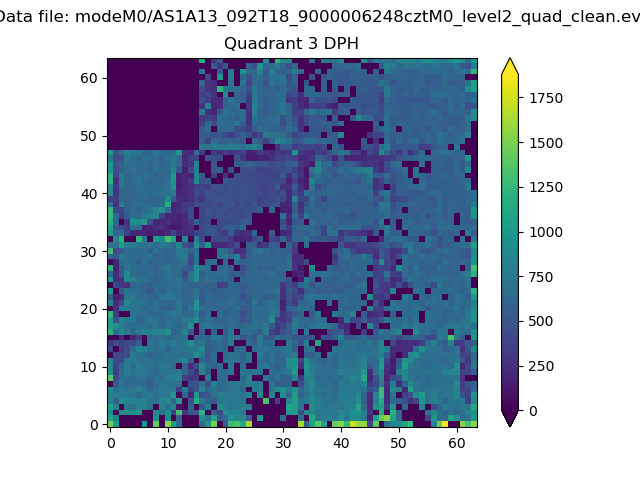 |
 |
Quadrant C |
| Plot type | Count rate plots | Images |
|---|---|---|
| Comparison with Poisson distribution Blue bars denote a histogram of data divided into 1 sec bins. Red curve is a Poisson curve with rate = median count rate of data. |
 |
 |
| Quadrant-wise count rates Data is divided into 100 sec bins |
 |
|
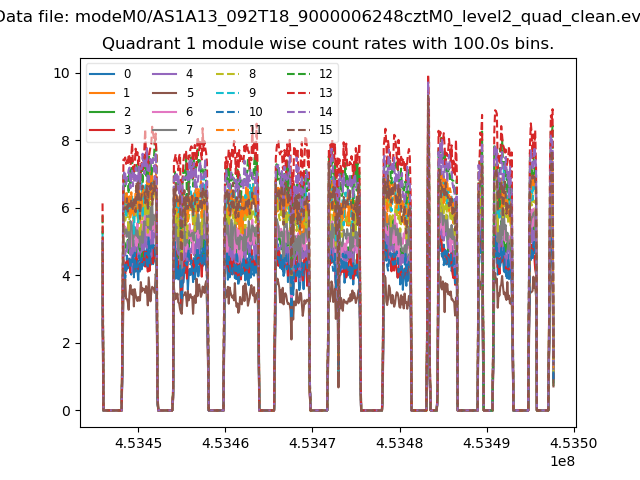
| Module-wise count rates for Quadrant A Data is divided into 100 sec bins |
 |
 |
| Module-wise count rates for Quadrant B Data is divided into 100 sec bins |
 |
 |
| Module-wise count rates for Quadrant C Data is divided into 100 sec bins |
 |
 |
| Module-wise count rates for Quadrant D Data is divided into 100 sec bins |
 |
 |
| Parameter | Plot |
|---|---|
| CZT HV Monitor |  |
| D_VDD | 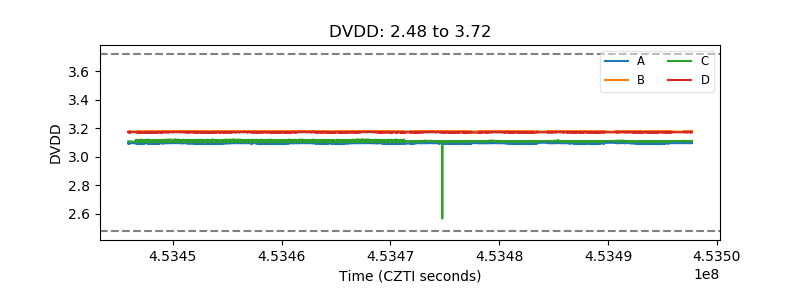 |
| Temperature 1 | 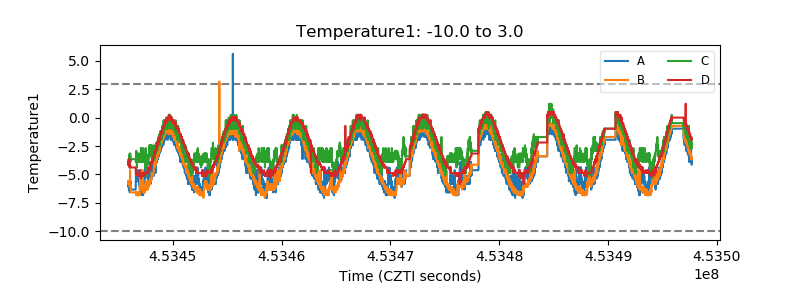 |
| Veto HV Monitor |  |
| Veto LLD |  |
| Alpha Counter |  |
| _CPM_Rate |  |
| CZT Counter | 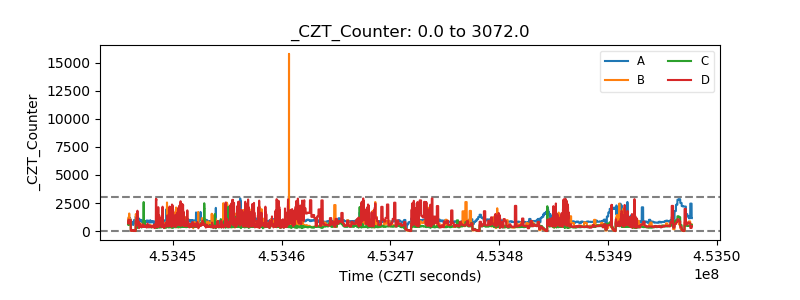 |
| +2.5 Volts monitor |  |
| +5 Volts monitor | 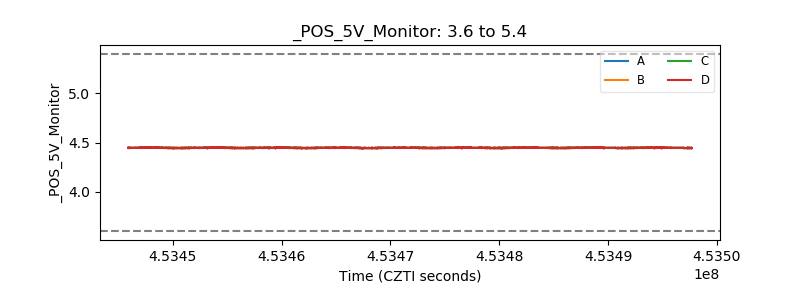 |
| _ROLL_ROT |  |
| _Roll_DEC |  |
| _Roll_RA | 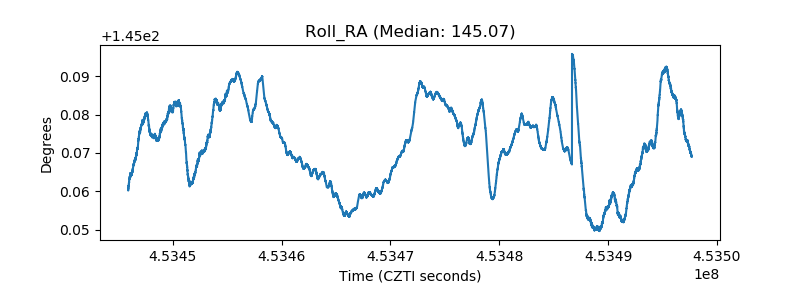 |
| Veto Counter |  |