| Param | Original file | Final file |
|---|---|---|
| Filename | modeM0/AS1A13_092T20_9000006254cztM0_level2.fits | modeM0/AS1A13_092T20_9000006254cztM0_level2_quad_clean.evt |
| Size (bytes) | 403,735,680 | 388,065,600 |
| Size | 385.0 MB | 370.1 MB |
| Events in quadrant A | 2,349,460 | 2,238,074 |
| Events in quadrant B | 2,294,140 | 2,263,488 |
| Events in quadrant C | 2,398,450 | 2,194,882 |
| Events in quadrant D | 1,989,142 | 1,861,472 |
| Mode M9 | |||
|---|---|---|---|
| Quadrant | BADHDUFLAG | Total packets | Discarded packets |
| A | 0 | 78 | 0 |
| B | 0 | 78 | 0 |
| C | 0 | 78 | 0 |
| D | 0 | 78 | 0 |
| Mode SS | |||
|---|---|---|---|
| Quadrant | BADHDUFLAG | Total packets | Discarded packets |
| A | 0 | 950 | 0 |
| B | 0 | 950 | 0 |
| C | 0 | 950 | 0 |
| D | 0 | 950 | 0 |
| Mode M0 | |||
|---|---|---|---|
| Quadrant | BADHDUFLAG | Total packets | Discarded packets |
| A | 0 | 160958 | 0 |
| B | 0 | 111678 | 0 |
| C | 0 | 99808 | 0 |
| D | 0 | 134305 | 0 |
| Quadrant | Total seconds | Saturated seconds | Saturation percentage |
|---|---|---|---|
| A | 46517 | 1578 | 3.392308% |
| B | 46518 | 1304 | 2.803216% |
| C | 46518 | 488 | 1.049056% |
| D | 46518 | 2729 | 5.866546% |
Noise dominated data is calculated using 1-second bins in cleaned event files. If a bin has >2000 counts, and if more than 50% of those come from <1% of pixels, then it is considered to be noise-dominated and hence unusable.
| Quadrant | # 1 sec bins | Bins with >0 counts | Bins with >2000 counts | High rate bins dominated by noise | Noise dominated (total time) | Noise dominated (detector-on time) | Marked lightcurve |
|---|---|---|---|---|---|---|---|
| A | 54452 | 46513 | 0 | 0 | 0.00% | 0.00% | 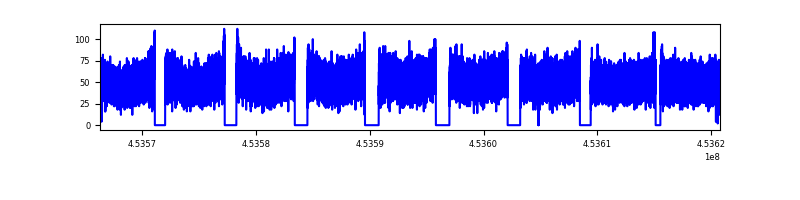 |
| B | 54453 | 46517 | 0 | 0 | 0.00% | 0.00% | 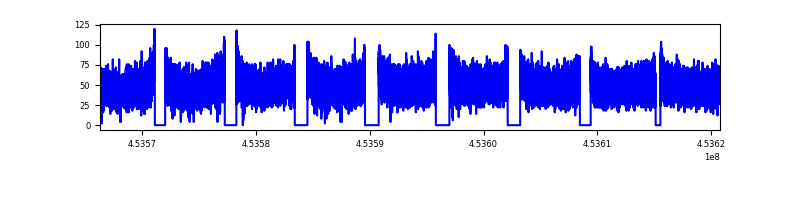 |
| C | 54453 | 46513 | 0 | 0 | 0.00% | 0.00% | 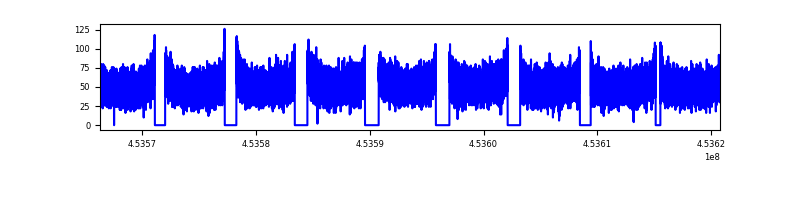 |
| D | 54453 | 46336 | 0 | 0 | 0.00% | 0.00% | 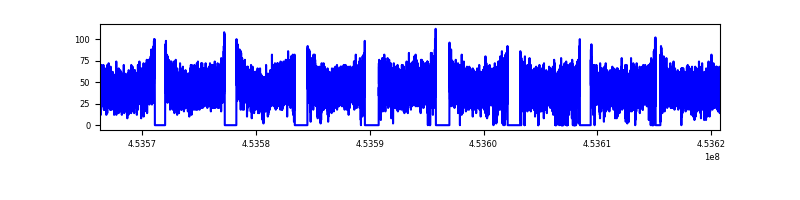 |
Top three noisy pixels from each quadrant. If the there are fewer than three noisy pixels in the level2.evt file, extra rows are filled as -1
| Pixel properties | Quadrant properties | ||||||
|---|---|---|---|---|---|---|---|
| Quadrant | DetID | PixID | Counts | Sigma | Mean | Median | Sigma |
| A | 7 | 110 | 1924 | 8.48 | 612 | 569 | 159.8 |
| A | 0 | 29 | 1845 | 7.99 | 612 | 569 | 159.8 |
| A | 14 | 95 | 1695 | 7.05 | 612 | 569 | 159.8 |
| B | 2 | 9 | 2197 | 13.57 | 608 | 579 | 119.3 |
| B | 2 | 8 | 1775 | 10.03 | 608 | 579 | 119.3 |
| B | 3 | 17 | 1657 | 9.04 | 608 | 579 | 119.3 |
| C | 1 | 81 | 1828 | 7.38 | 635 | 590 | 167.8 |
| C | 3 | 202 | 1819 | 7.33 | 635 | 590 | 167.8 |
| C | 3 | 203 | 1735 | 6.82 | 635 | 590 | 167.8 |
| D | 12 | 6 | 1473 | 6.01 | 571 | 517 | 159.1 |
| D | 10 | 189 | 1469 | 5.98 | 571 | 517 | 159.1 |
| D | 6 | 67 | 1460 | 5.93 | 571 | 517 | 159.1 |
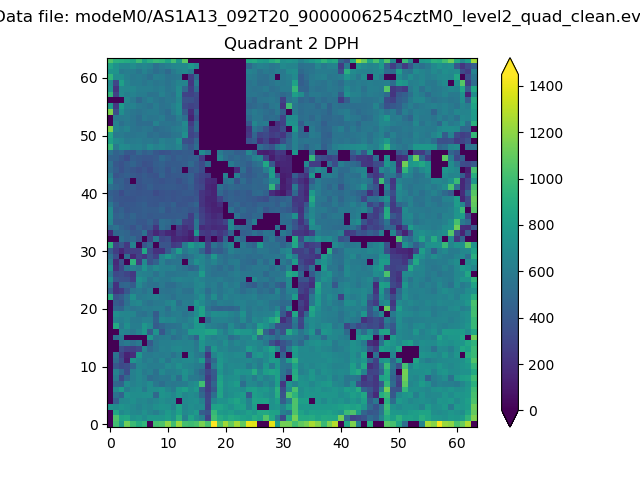
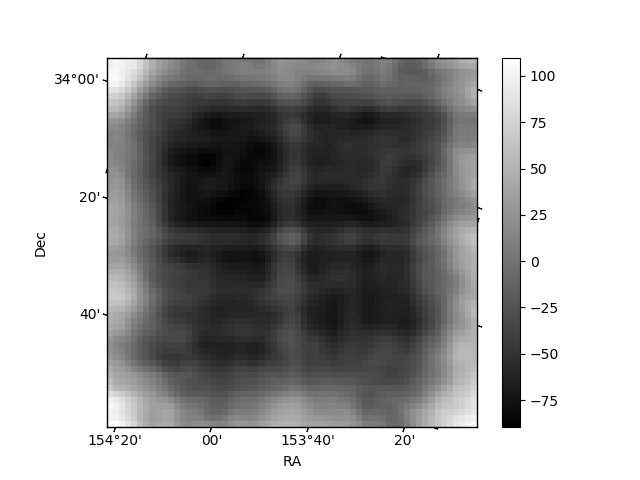
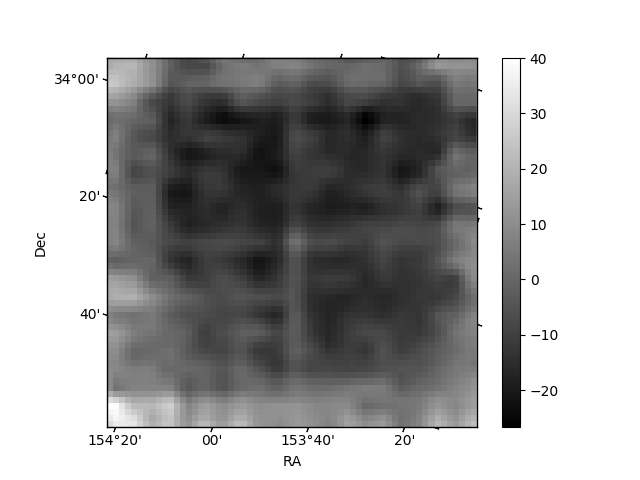
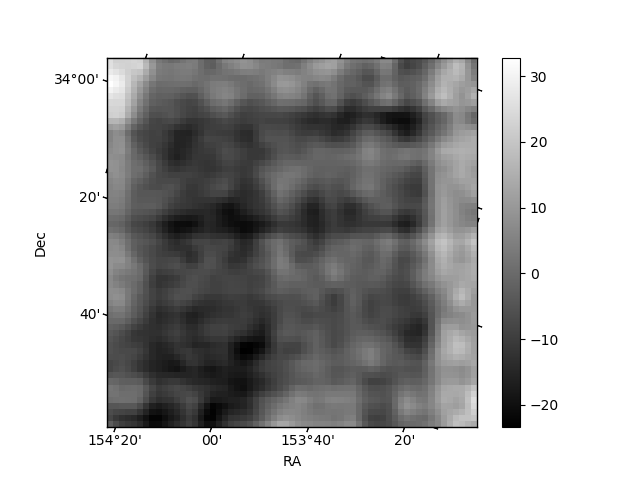
Histogram calculated using DETX and DETY for each event in the final _common_clean file
| Quadrant A | 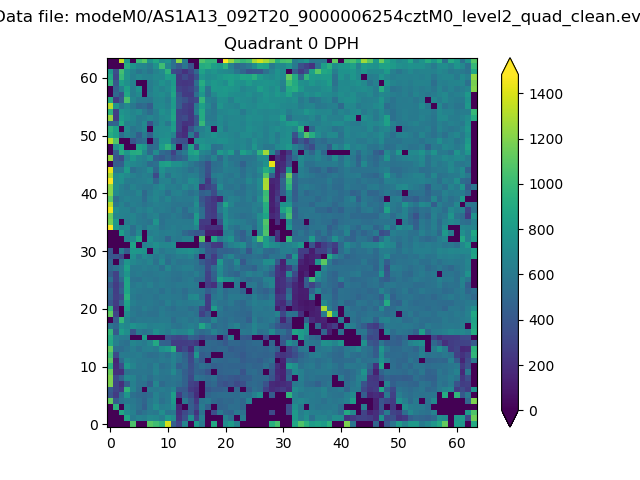 |
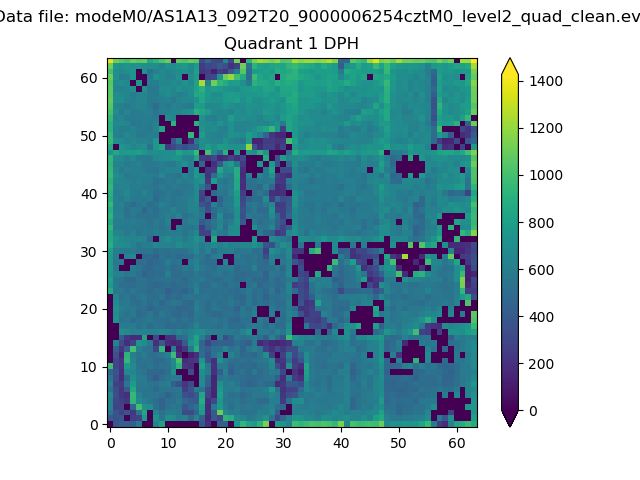 |
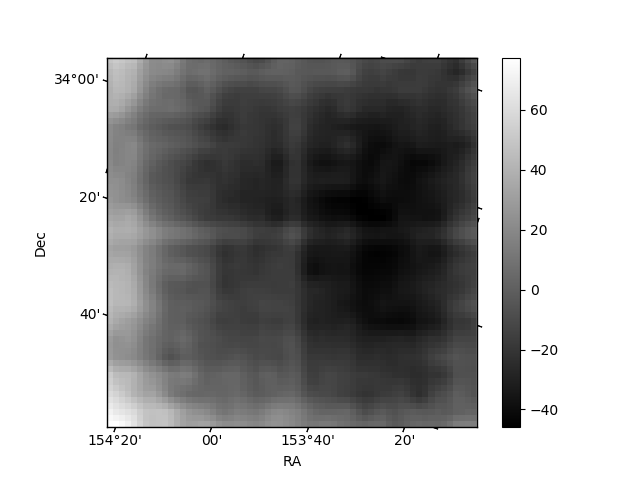
Quadrant B |
|---|---|---|---|
| Quadrant D | 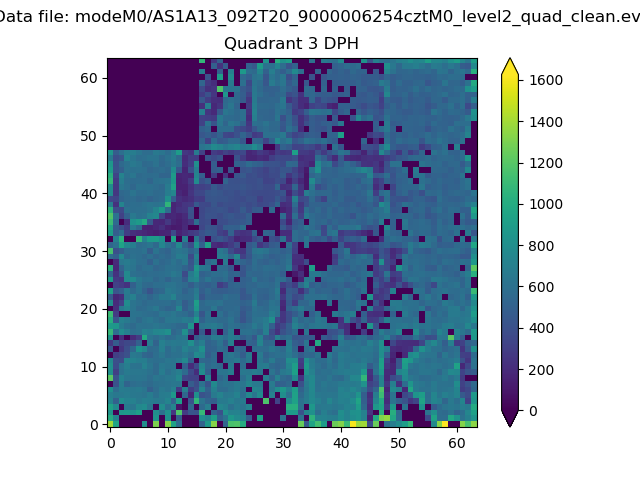 |
 |
Quadrant C |
| Plot type | Count rate plots | Images |
|---|---|---|
| Comparison with Poisson distribution Blue bars denote a histogram of data divided into 1 sec bins. Red curve is a Poisson curve with rate = median count rate of data. |
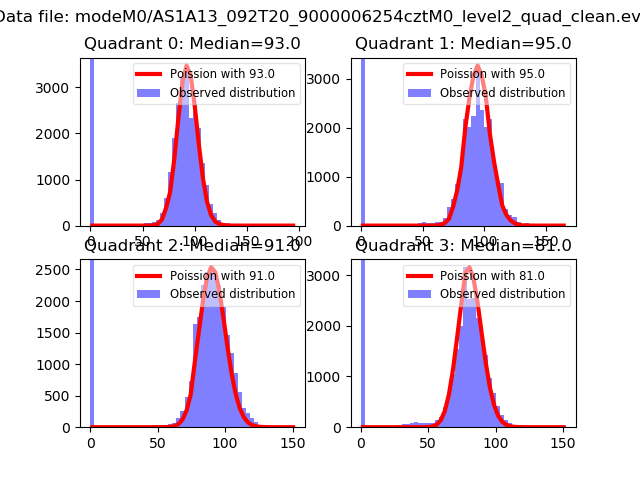 |
 |
| Quadrant-wise count rates Data is divided into 100 sec bins |
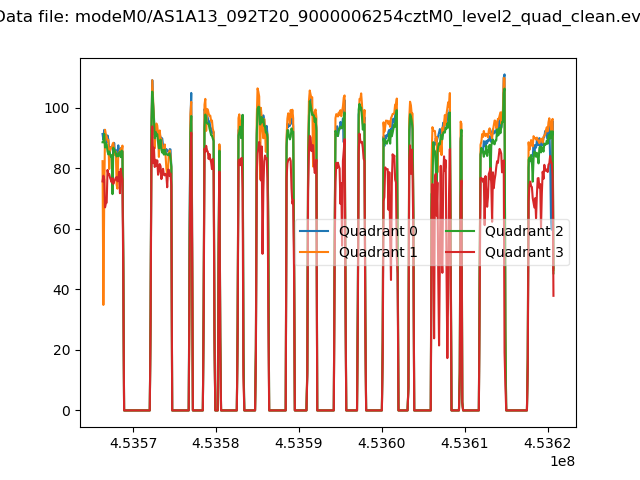 |
|
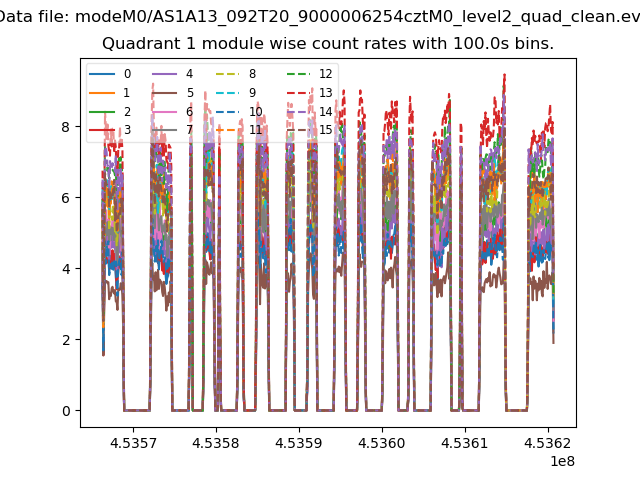
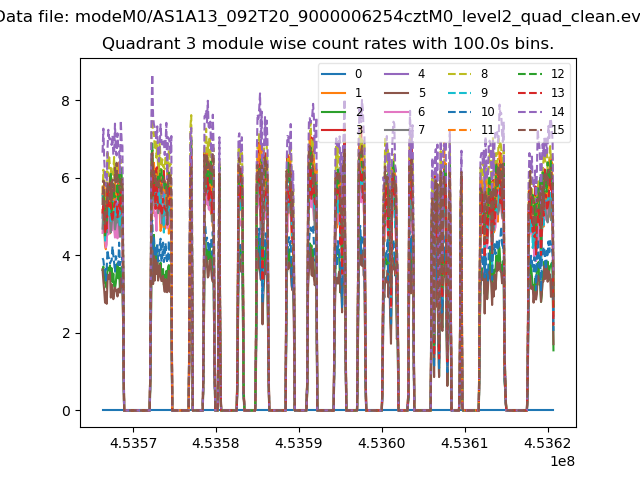
| Module-wise count rates for Quadrant A Data is divided into 100 sec bins |
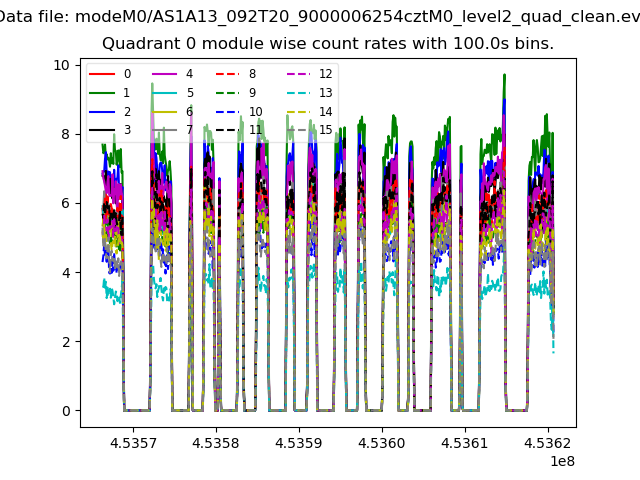 |
 |
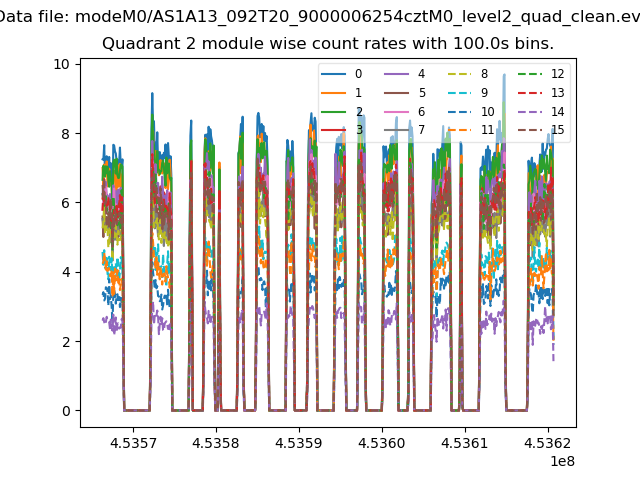
| Module-wise count rates for Quadrant B Data is divided into 100 sec bins |
 |
 |
| Module-wise count rates for Quadrant C Data is divided into 100 sec bins |
 |
 |
| Module-wise count rates for Quadrant D Data is divided into 100 sec bins |
 |
 |
| Parameter | Plot |
|---|---|
| CZT HV Monitor | 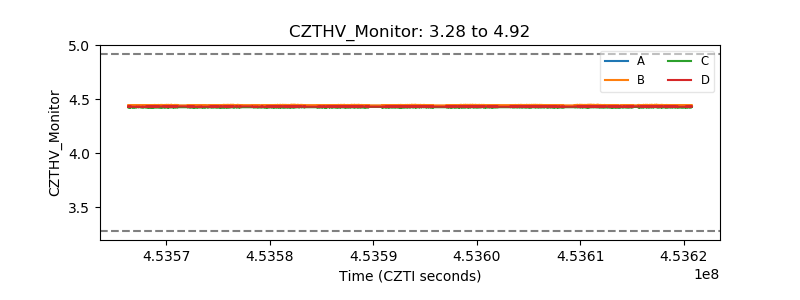 |
| D_VDD | 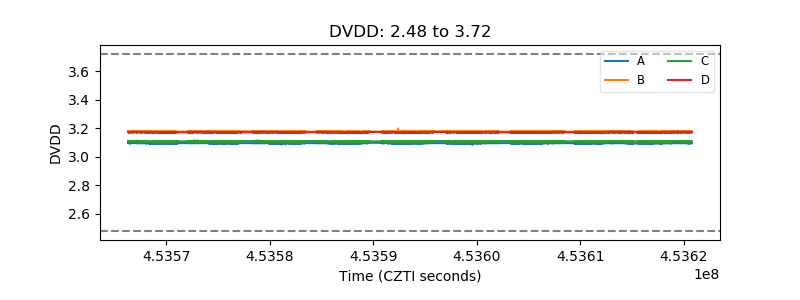 |
| Temperature 1 | 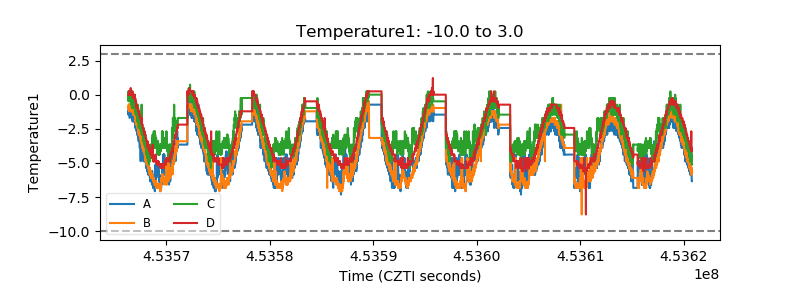 |
| Veto HV Monitor | 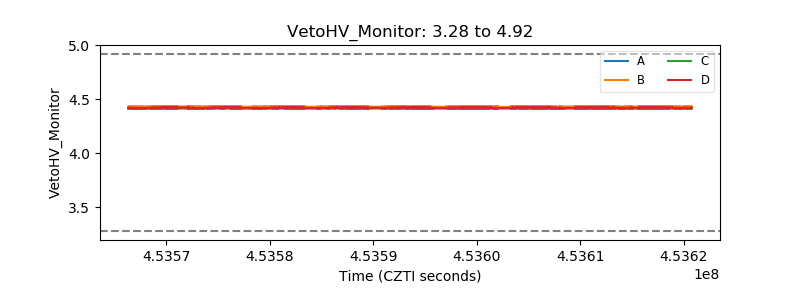 |
| Veto LLD | 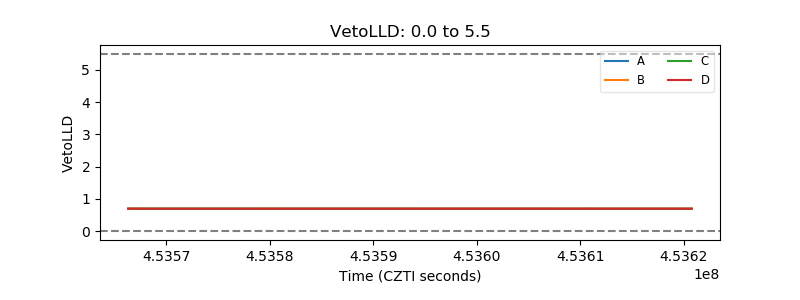 |
| Alpha Counter | 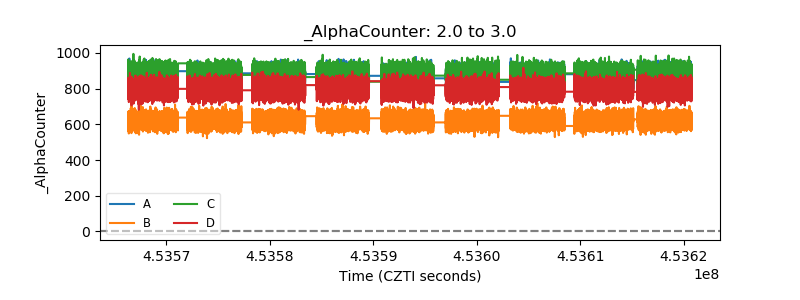 |
| _CPM_Rate | 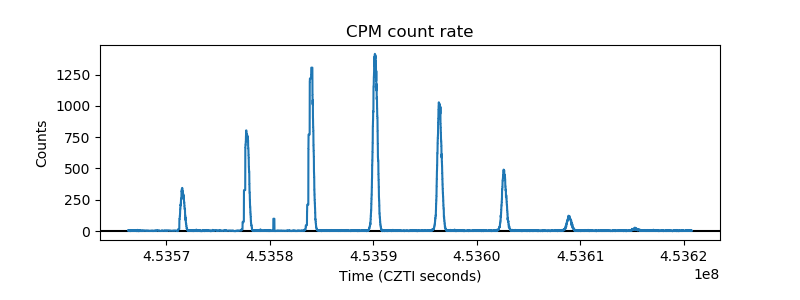 |
| CZT Counter | 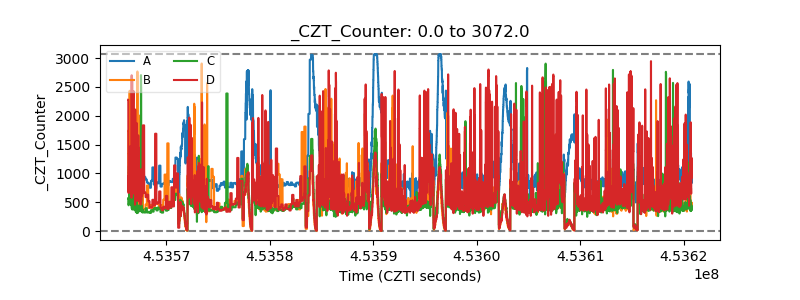 |
| +2.5 Volts monitor | 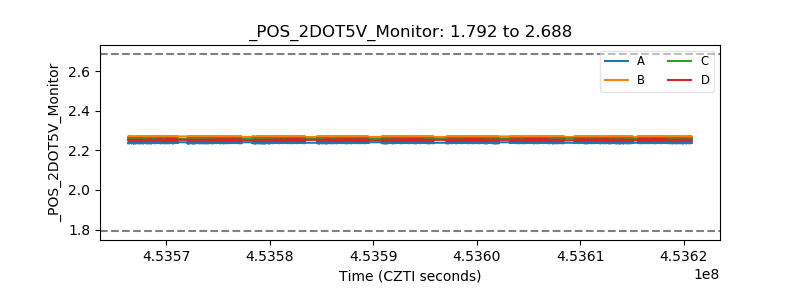 |
| +5 Volts monitor | 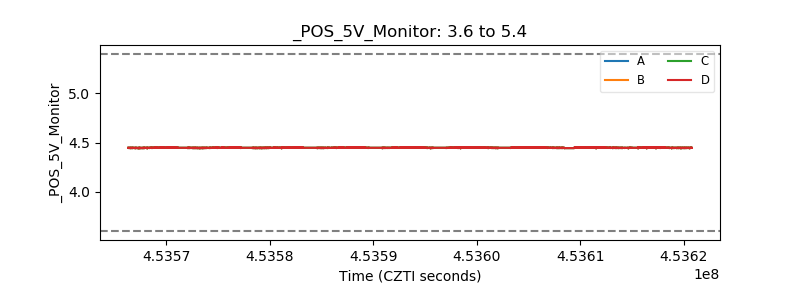 |
| _ROLL_ROT | 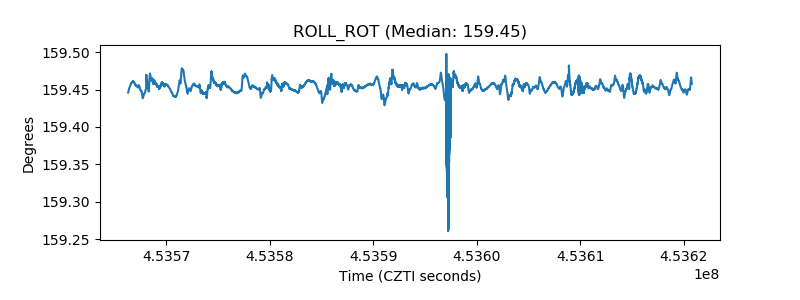 |
| _Roll_DEC | 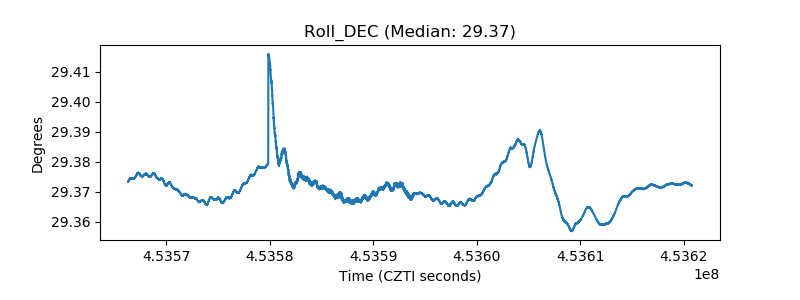 |
| _Roll_RA | 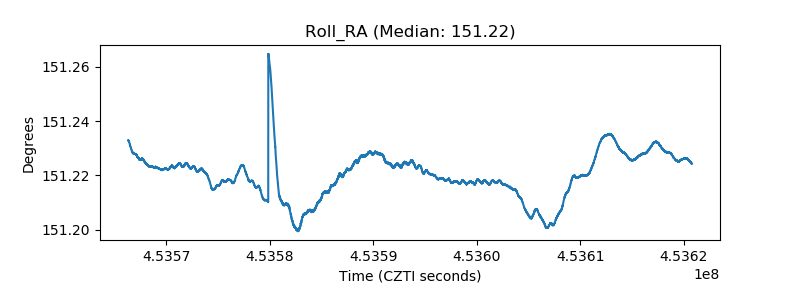 |
| Veto Counter | 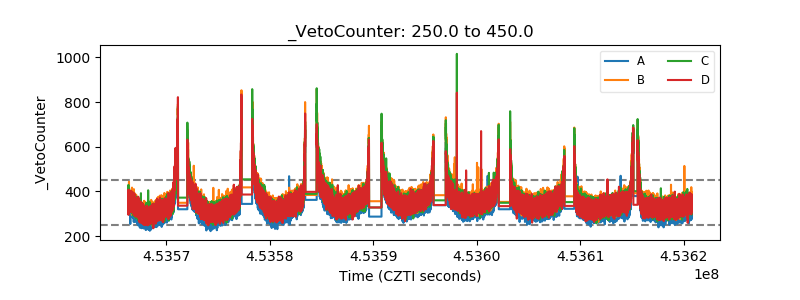 |